Conjugate Heat Transfer Analysis on a graphics card.
Aim:To perform a steady-state conjugate heat transfer analysis on a model of a graphics card.
Introduction: As we know-The term conjugate heat transfer (CHT) is used to describe processes which
involve variations of temperature within solids and fluids, due to thermal interaction between the solids
and fluids. The exchange of thermal energy between the two physical bodies is called study of Heat
Transfer, the rate of transferred heat is directly proportional to the temperature difference between the
bodies. A typical example is the heating or cooling of a solid object by the flow of air in which it is
immersed and some other example includes conduction through solids, free and forced convection in the
gases/fluids and thermal radiation.Analysis involving study of CHT is known as CHT analysis.
Importance of the topic:
All the electronic devices generate heat during the operation.Every component and material have some
limitation for maximum temperrature it can withstand while in operation.Therefore thermal management
is extremely crucial for system reliability and preventing failure of device or component.
In this challenge we are going to study CHT analysis on a basic Graphic card model used in Computer.In
a Graphic card ,processor is the souce of heat generation,it has to do lot of calculation they complete it
by running electricity through the card.
It is similar to Human being like when we do some physical activity our body heats up.
All Graphic card has certain temperature range in which it can operate,exceeding the temperature will
result in reduction in efficiency of Graphic card and can cause permanent heat damage also.
Solving and Modelling Approach:
Geometry is given already prepared .
Need to download and import it in Spaceclaim.
Then Meshing in Mesh Tool ,which region need to be meshed
Setting up case and creating solution from analysis.
Then Post process the results.
Pre-Processing and Solver setting:
We will discuss total results of 3 cases:
1.When cooling air velocity is 1m/s when only processor is refined.
2.When cooling air velocity is 3m/s when only processor is refined.
3.When cooling air velcity is 5 m/s when both processor and Fins are refined.
Lets see Case -1:
##Geometry:
Geometry was prepared already .It was imported in Spaceclaim.
For sharing properties between different components Share topology is enabled.
So that in this challenge as we want to do CHT analysis,sharing will enable Heat transfer
between different bodies.
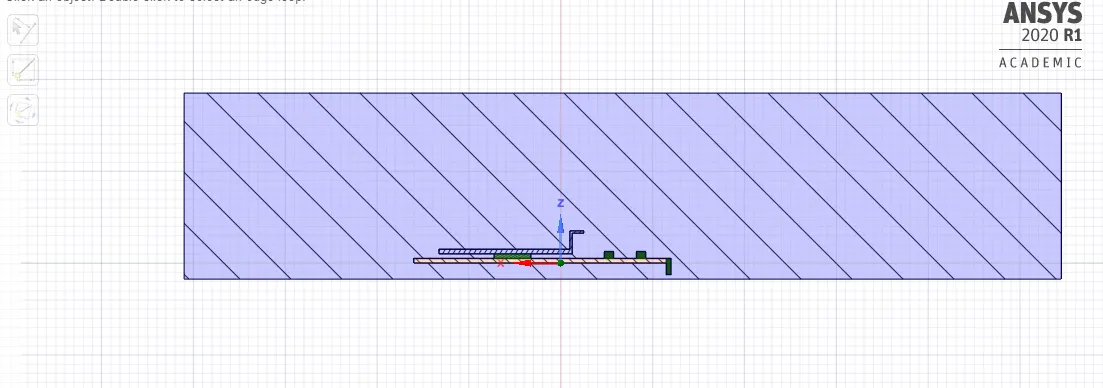
Graphic card basic assembly consists of Fins,Processor,Solid base(electronic components) and all of them
are placed inside an enclosure.

##Meshing:
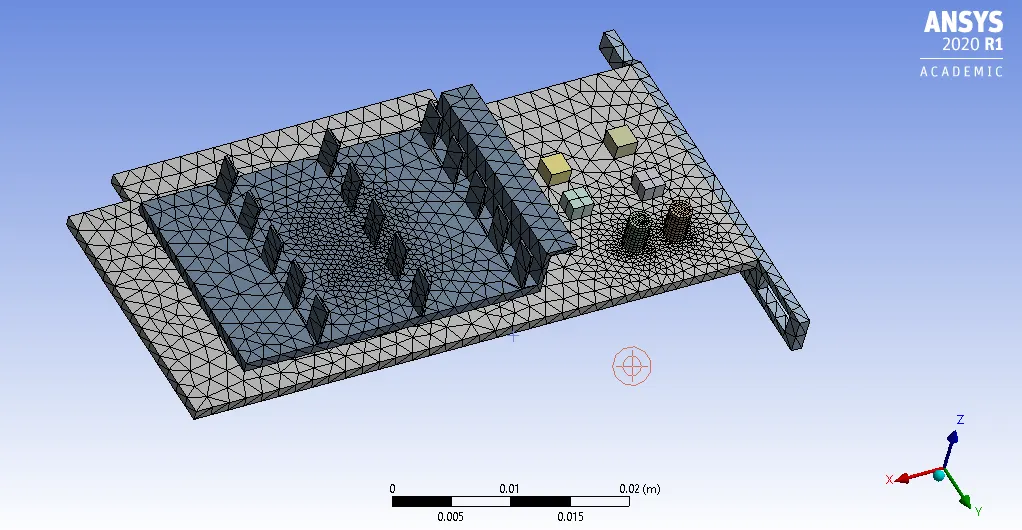
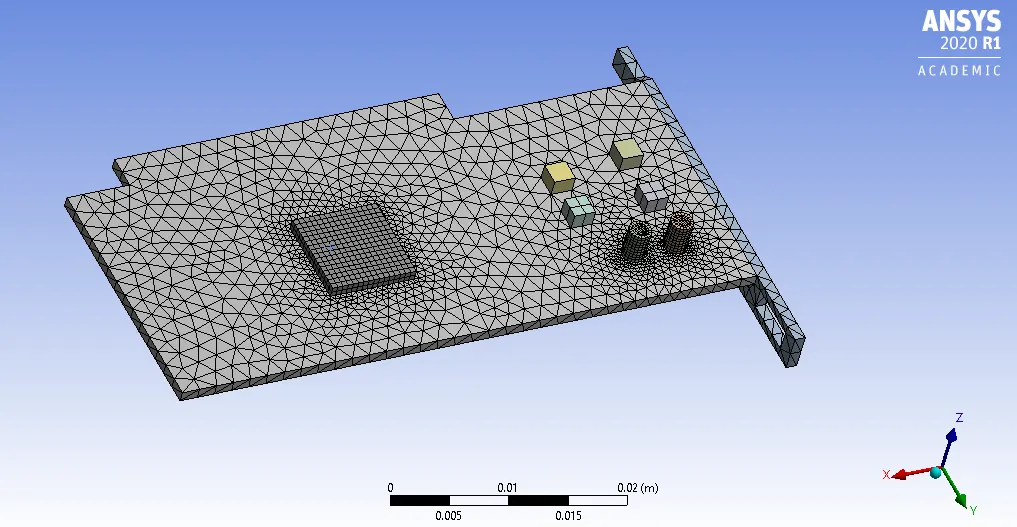
Global element size----------0.00165 m.
Processor body(Face sizing)--0.0005 m.
##Setup:
Solver used-Steady State , Pressure Based.
Turbulence Model- `komegasst`
Material used:
Fin body--Aluminium.
Processor--Silicon solid.--------------Specific Dissipation Rate--`2e^7``(kg)/(m^3-s^2)`
Solid Base--Calcium Oxide.
Cooling Medium--Air.
Boundaries:
Inlet Air velocity-1 `ms^-1`
Outlet-Atmospheric Pressure.
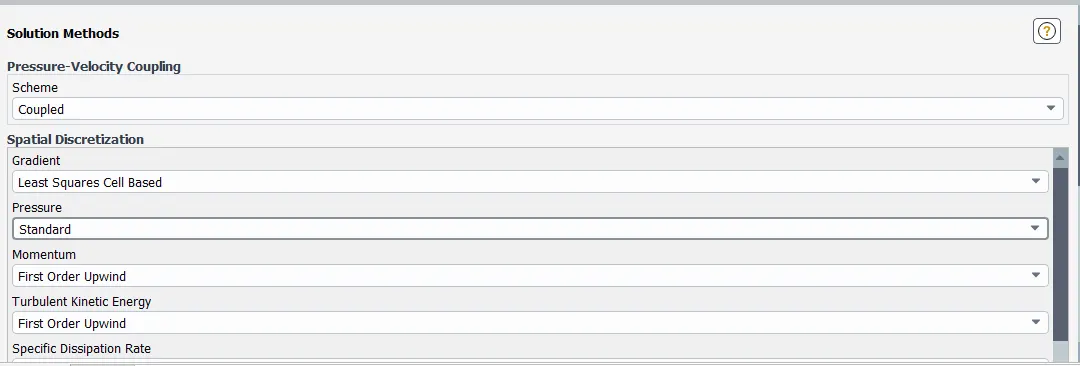
Solution Method:
Solution Controls:
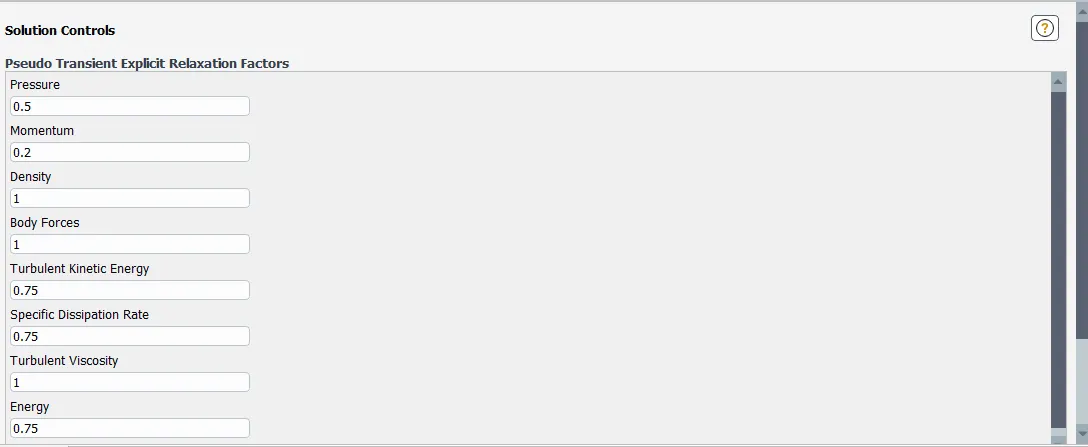
Hybrid Initialization of Solution.
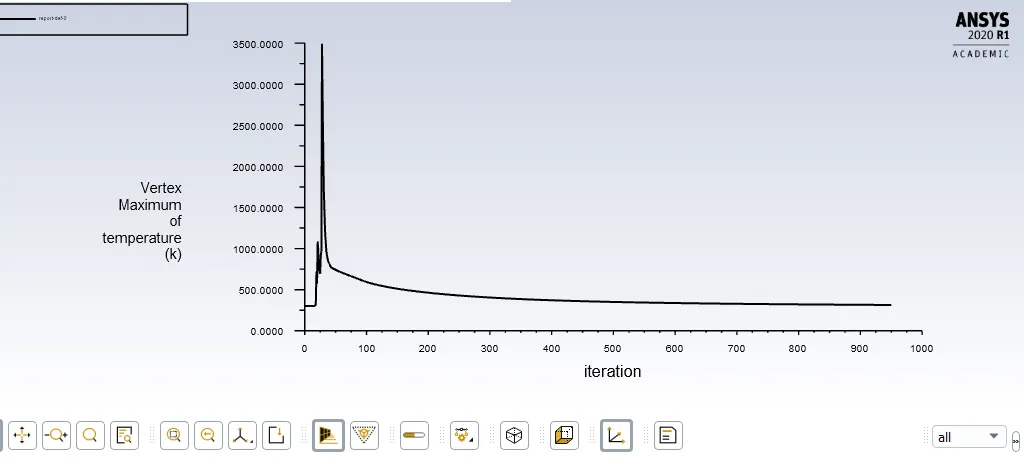
Then Run simulation for calculation for 950 iterations(that is till Max. Temperature across
processor becomes steady).
##Results:
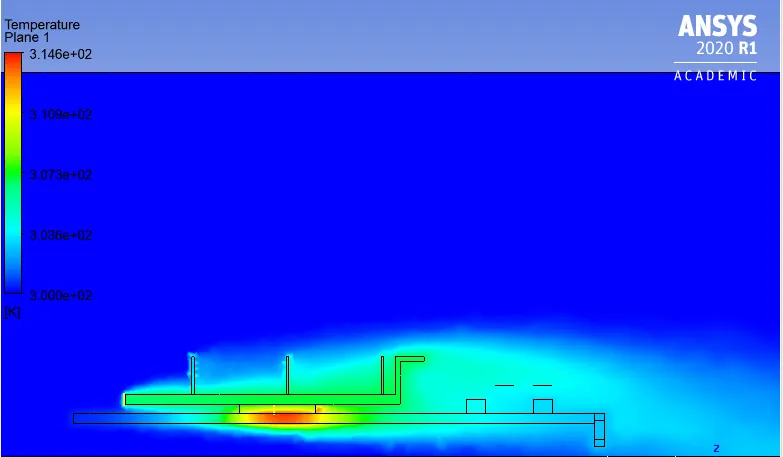
1.Temperature Plot
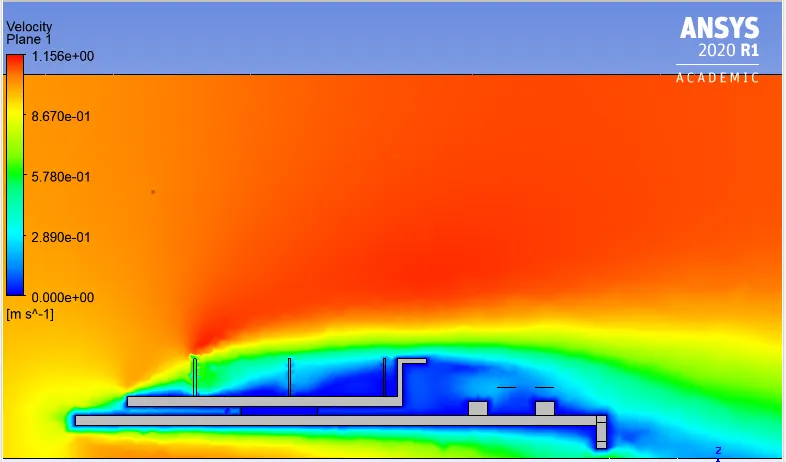
2.Velocity Plot
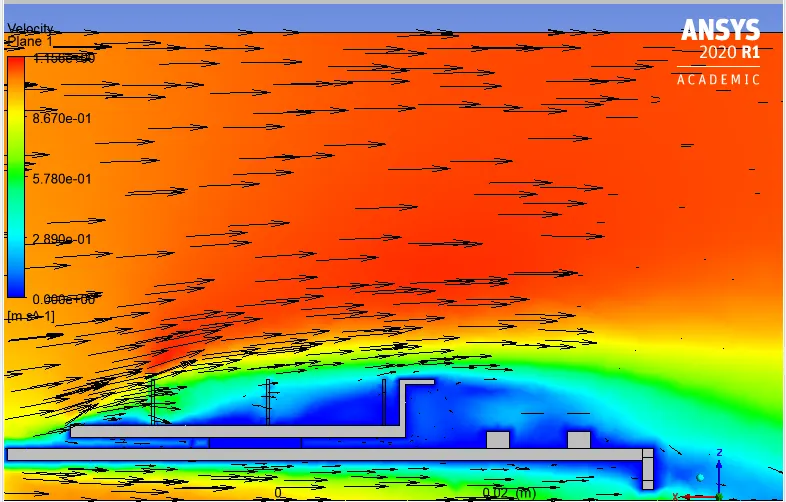
3.Velocity vector plot:
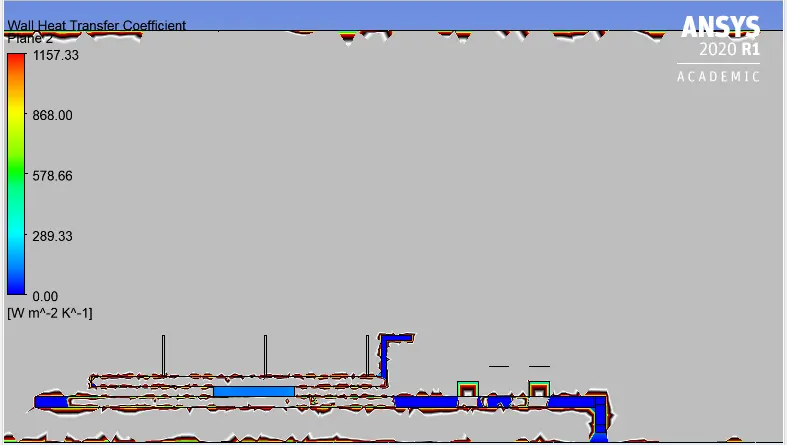
4.Wall Heat Transfer Coefficient Plot:
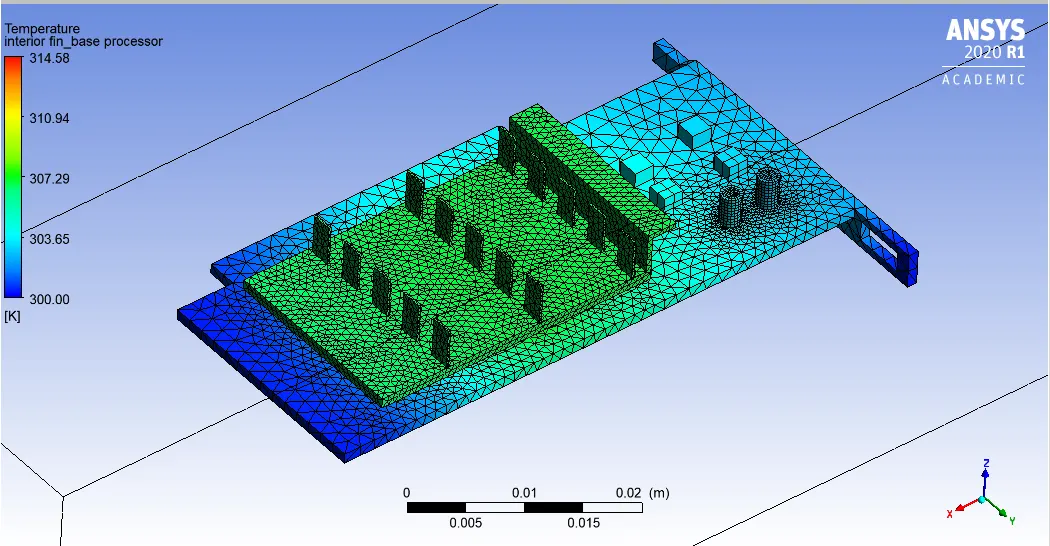
5.Temperature distribution over Graphic card:
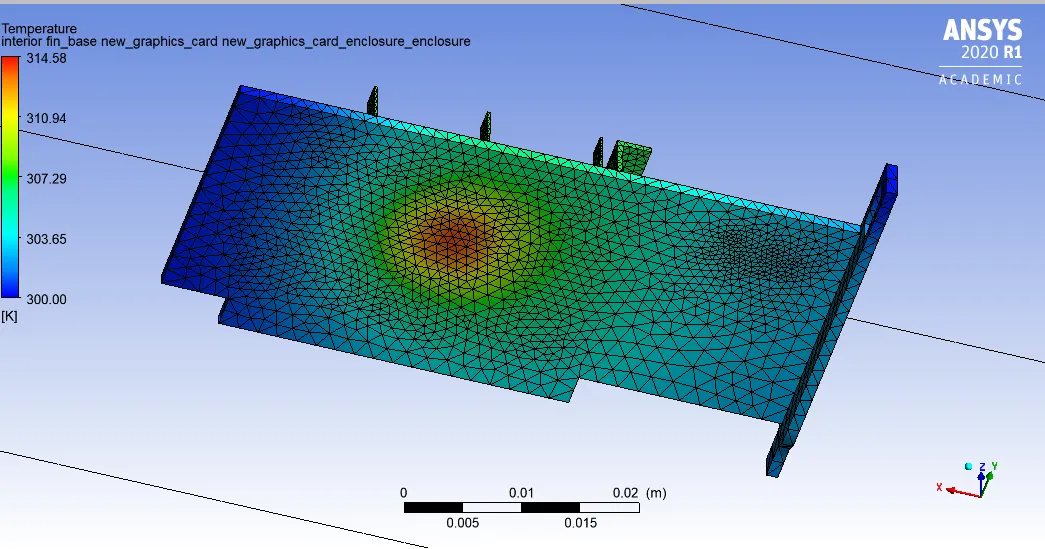
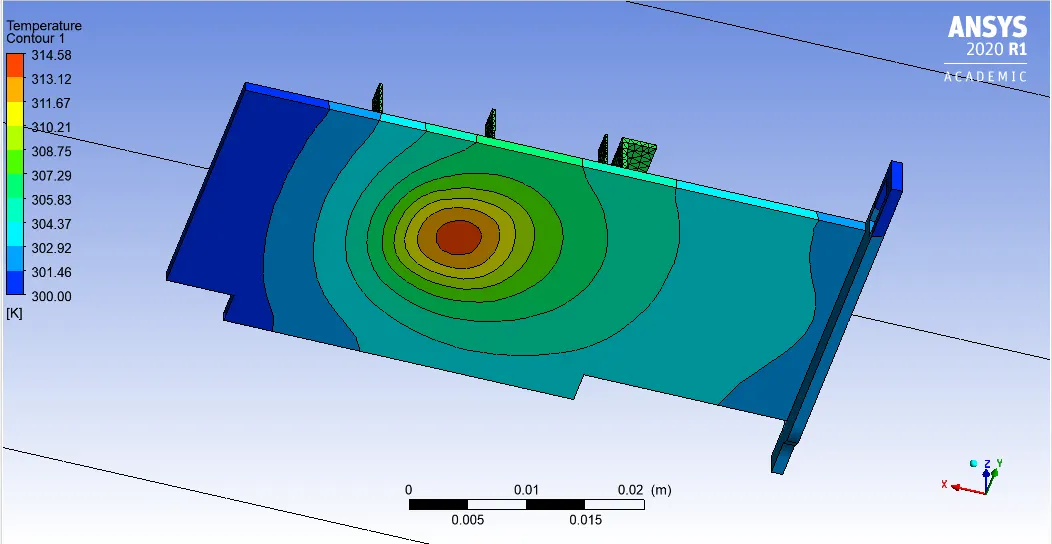
6.Temperature Contour Plot showing Hot spot on Graphic card body:
7.Maximum temperature at Processor Convergence Plot:
Case-2:
#Geometry:
Same as above case.
#Meshing:
Global element size----------0.00165 m.
Processor body(Face sizing)--0.0005 m.
##Setup:
Solver used-Steady State , Pressure Based.
Turbulence Model- `komegasst`
Material used:
Fin body--Aluminium.
Processor--Silicon solid.--------------Specific Dissipation Rate--`2e^7``(kg)/(m^3-s^2)`
Solid Base--Calcium Oxide.
Cooling Medium--Air.
Boundaries:
Inlet Air velocity-3 `ms^-1`
Outlet-Atmospheric Pressure.
Hybrid Initialization of Solution.
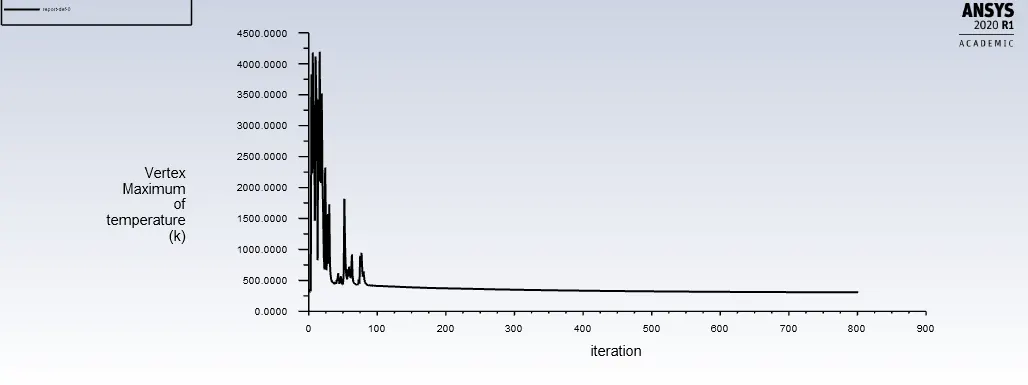
Then Run simulation for calculation for 800 iterations(that is till Max. Temperature across
processor becomes steady).
##Results:
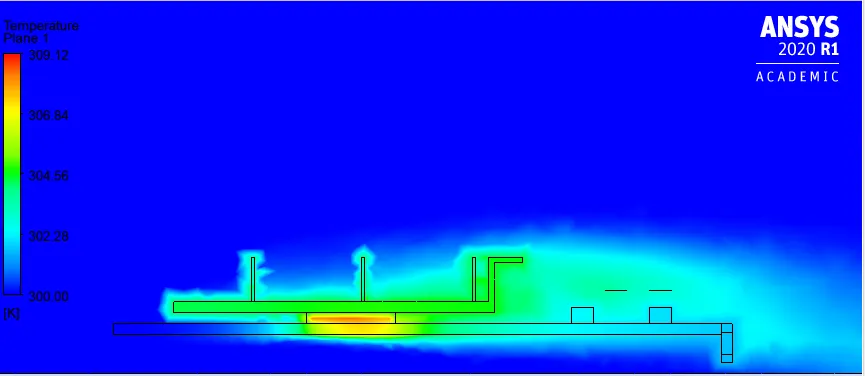
1.Temperature Plot.
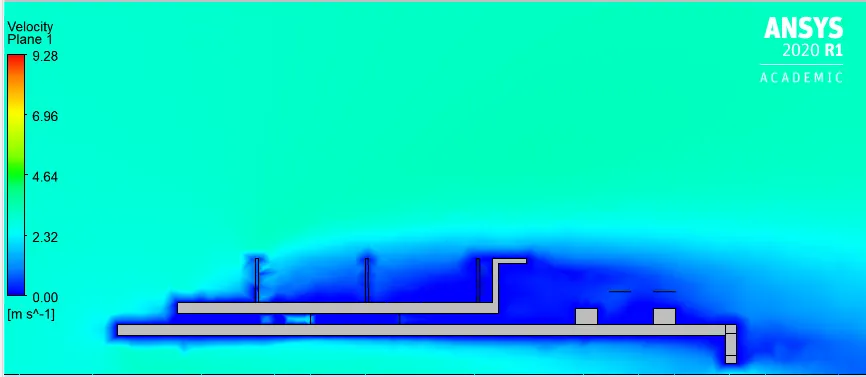
2.Velocity Plot.
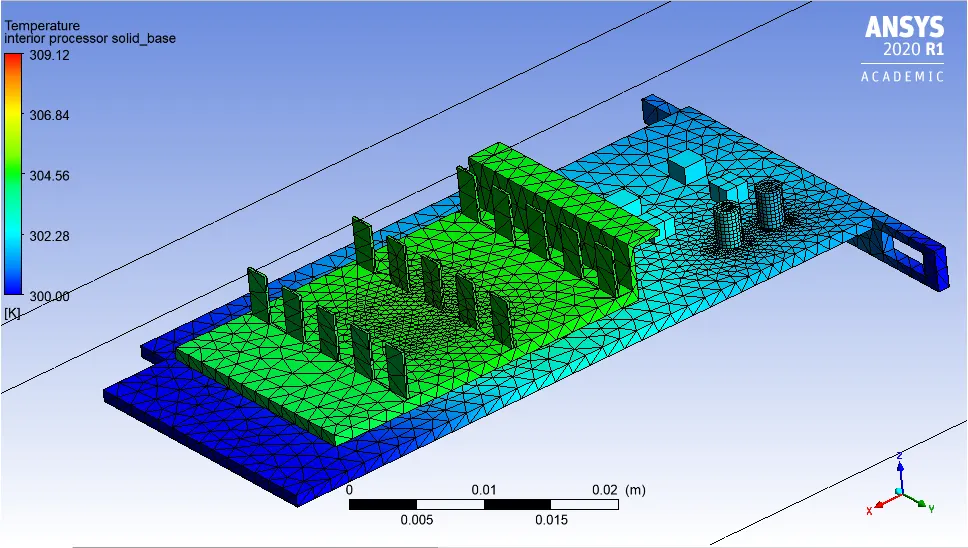
3.Temperature distribution over Graphic card.
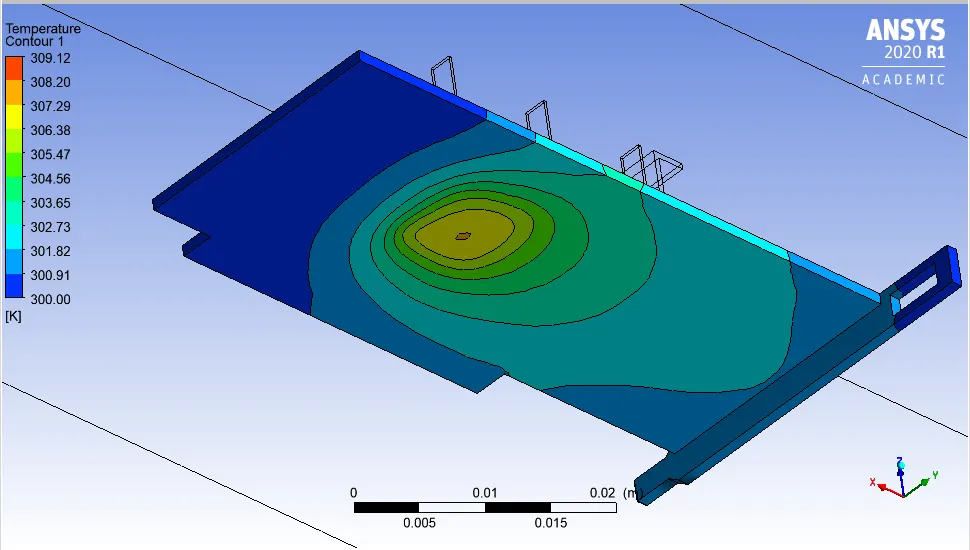
4.Contour Plot showing Hot spot.
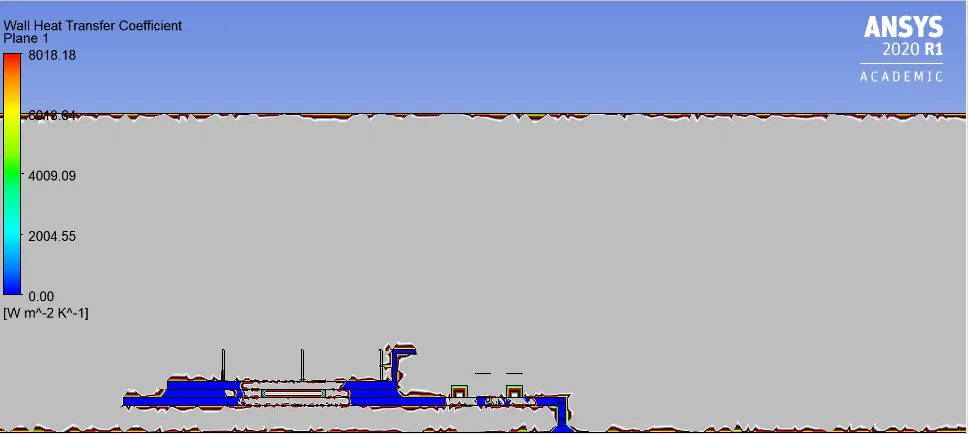
5.Wall Heat Transfer Coefficient Plot.
6.Max. Temperature at Processor Body Convergence Plot
Case-3:
#Geometry:
Same as above case.
#Meshing:
Global element size----------0.0018 m.
Processor body(Face sizing)--0.00045 m.
Fins (Face Sizing)---0.00075 m.
##Setup:
Solver used-Steady State , Pressure Based.
Turbulence Model- `komegasst`
Material used:
Fin body--Aluminium.
Processor--Silicon solid.--------------Specific Dissipation Rate--`2e^7``(kg)/(m^3-s^2)`
Solid Base--Calcium Oxide.
Cooling Medium--Air.
Boundaries:
Inlet Air velocity-5 `ms^-1`
Outlet-Atmospheric Pressure.
Hybrid Initialization of Solution.
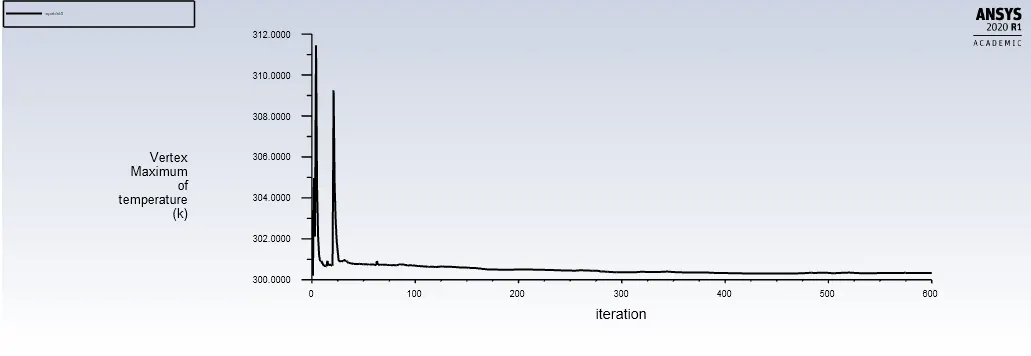
Then Run simulation for calculation for 800 iterations(that is till Max. Temperature across
processor becomes steady).
##Results:
1.Max. Temperature at Processor Body Convergence Plot
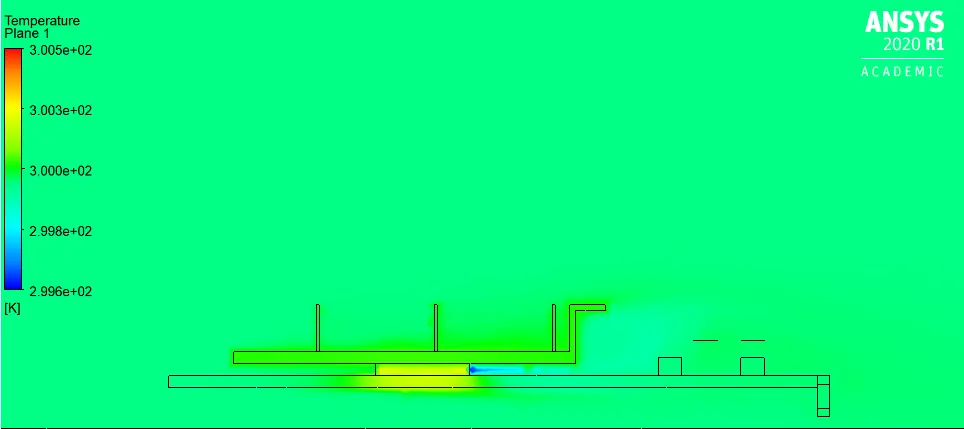
2.Temperature Plot.
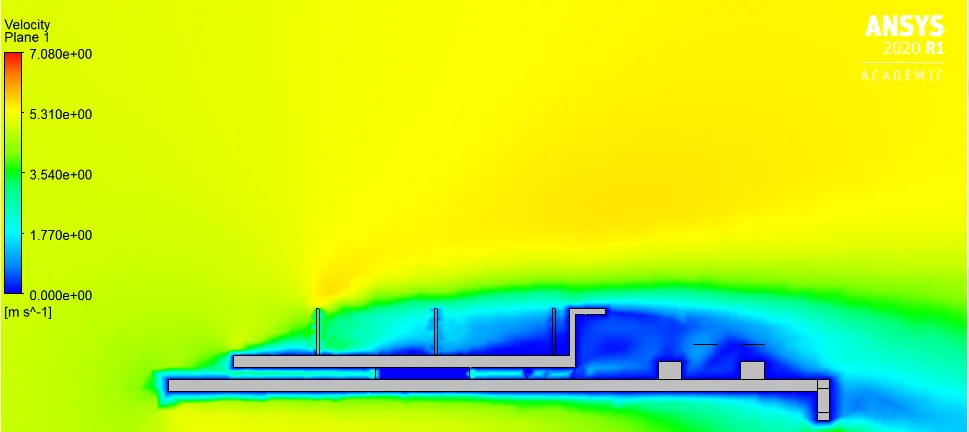
3.Velocity Plot.
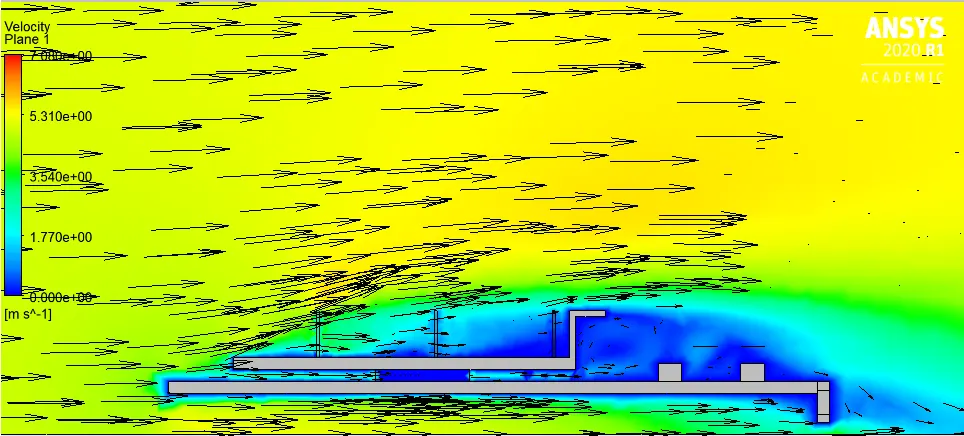
4.Velocity Vector Plot.
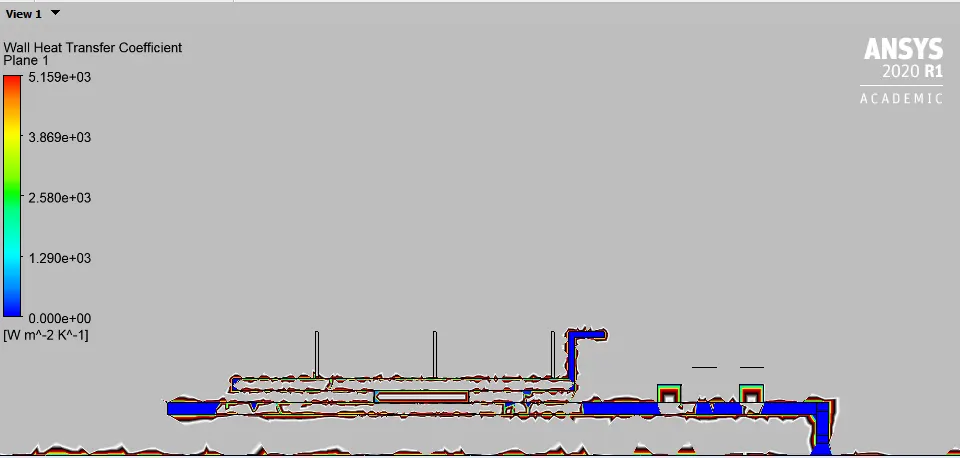
5.Wall Heat Transfer Coefficient Plot.
6.Temperature distribution over Graphic card
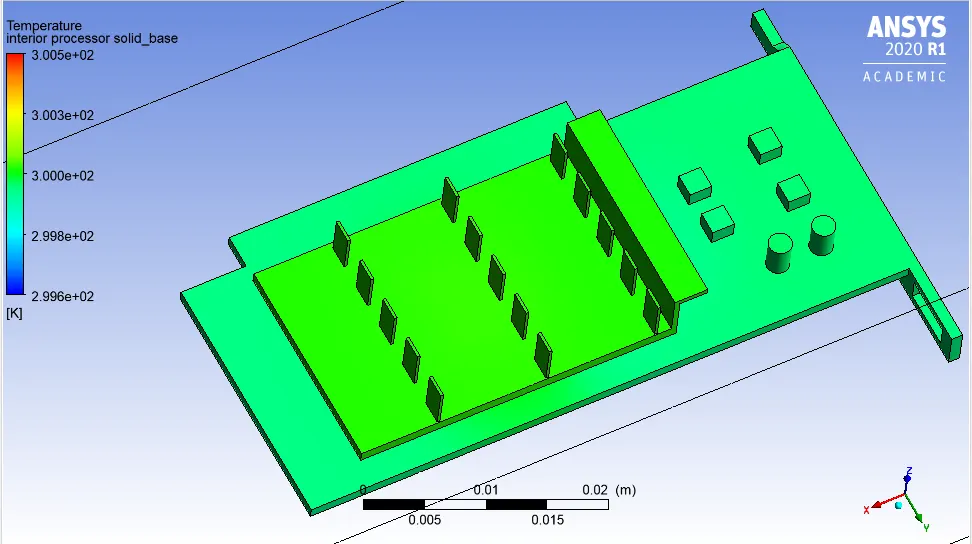
7.Contour Plot showing Hot spot.
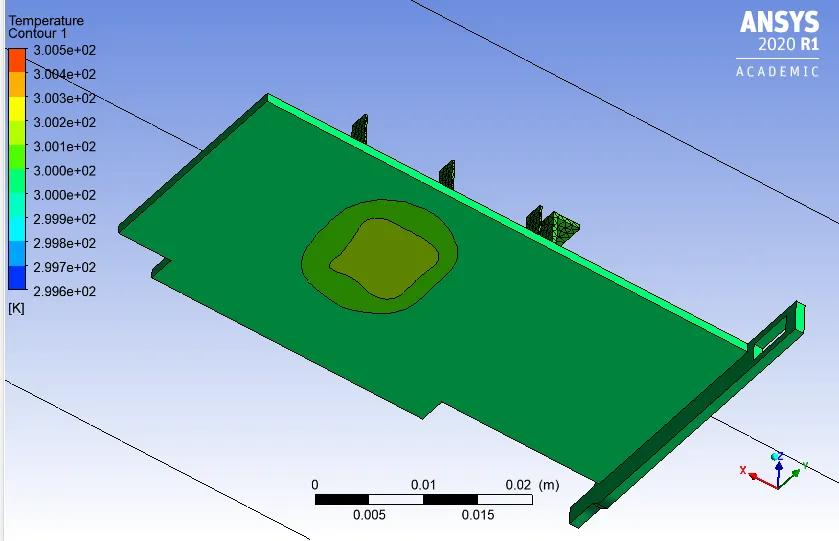
Objectives Answered:
1.Simulation was ran for Air velocity 1,3 and 5 `m/s`.From the results obtained we can say
--a)With the increase in velocity of air ,Wall HTC increases.
--b)Max. Temperature attained by processor body decreases with increase in velocity.
--c)With the increase in velocity,Temperature and region of Hotspot generated on solid base of processor
is reduced.
2.Max. Temperature and HTC attained :
| S. No | Velocity | Maximum Temperature attained by processor | Heat Transfer Coefficient attained by processor | Maximum Heat Transfer Coefficient attained by Graphic card |
| 1 | 1 | 314.29 | 190 | 1157.3 |
| 2 | 3 | 307.62 | 1070 | 8020.3 |
| 3 | 5 | 300.33 | 1540 | 10905.6 |
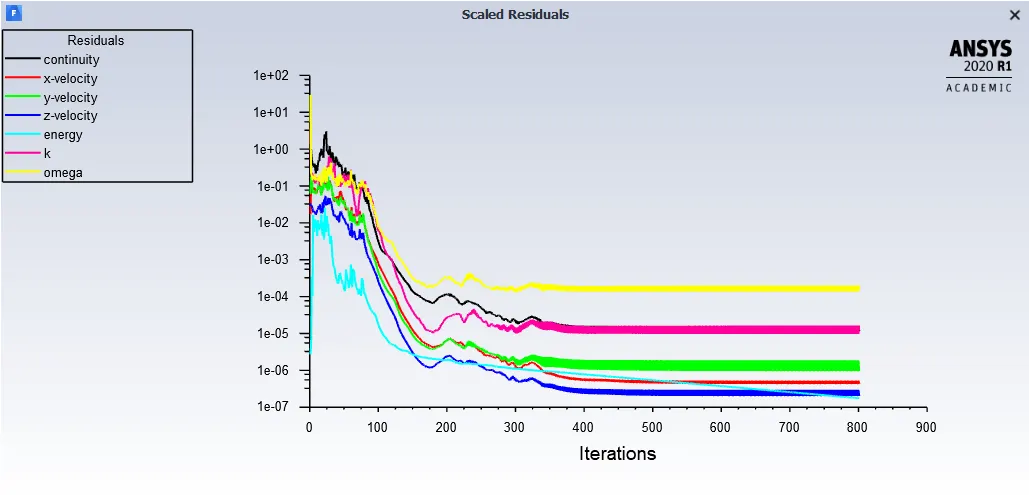
3.Basis of Convergence of Solution:
Above shows Max. Temperature Attained by processor plot.It shows that the temperature at processor body has become steady.
One basis is Residual plot and other is Max. Temp steady behaviour on processor.
4.Hotspot generation region:
Plot shown above is Temperature contour plot for case when velocity of cooling air is 1 `m/s`.
It can be seen Hotspot is generated at the bottom region of processor on Solid base of Graphic card.
Because there very less air is coming in contact with Solid base body .Like on top of processor ,fins are
there for better heat transfer.But at the bottom of processor no fins are present so temperature there is
higher.
##Use of Different Mesh setting for Same case:
Two different mesh is used for same case when Velocity of air is 5`m/s` .
In one Only Processor was refined and in the other one both processor and fins are refined.
Our main aim was to study results around processor .
Case-a--When Only processor is Refined ,there Max. Wall HTC at some random location on Fin
is 112.5 `Wm^-2K^-1`
Case-b--When both Processor and Fins are refined,there at the same point we mentioned
above Max. Wall HTC is 219 `Wm^-2K^-1`
It shows clearly effect of Mesh size on results accuracy.
#Conclusion:
In short,CHT analysis of any component is important for better performance of electronic components.Like we saw as velocity of air increased ,hot spot temperature and region of Hotspot is reduced.So by analysis we can find in which area hotspot is generating,air flow is sufficient to cool the processor as it is continously generating heat.
So before manufacturing of Graphic card,these all factors are important that can only be done by CHT analysis.