Comparison of bending in beams
AIM:
To compare the performance of three types of beams under a bending load and compare the results of stress, displacement and strain for all the three cases, we must suggest the best out of three cases.
BASIC PARAMETERS GIVEN:
1) Load = 1500N
2) Extrude Length = 400mm
3) Material Property Selected = Alloy Steel.
CASE 1:
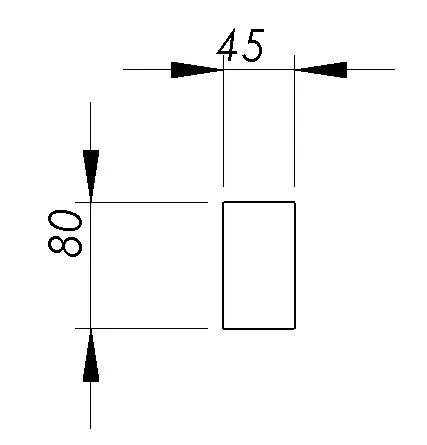
ALL DIMENSIONS ARE IN MM
PROCEDURE:
1) Using above dimensions, we have created a bar of length = 80mm, breadth = 45mm and height = 400mm which is created by extruding to a distance of 400mm.
2) A bar is created with 400mm dimension. Material of the bar is selected from the material property menu.
3) We have selected Alloy Steel as the material for the bar.
4) Selected material is applied to the bar. We then move on the simulation option in solidworks.
5) A new study is opened in Solidworks Simulation and the bar is imported to the Simulation section.
6) A new dialogue box appears, we click on static analysis to perform the required simulation.
7) We then provide the necessary fixtures by fixing one end of the bar and making it behave like a Cantilever.
8) Using the Force option, we are providing a load of 1500 N on the top surface of the bar which is 45mm.
9) We use the mesh option to create the required mesh for the bar. We have set it to standard mesh and provided outer mesh = 6mm , inner mesh = 1mm.
10) Once the mesh is done, we click on the Run Simulation option to get required results.
11) On doing so, we obtain the results for Stess, Strain and Displacement acting on the bar.
OUTPUT OBTAINED:
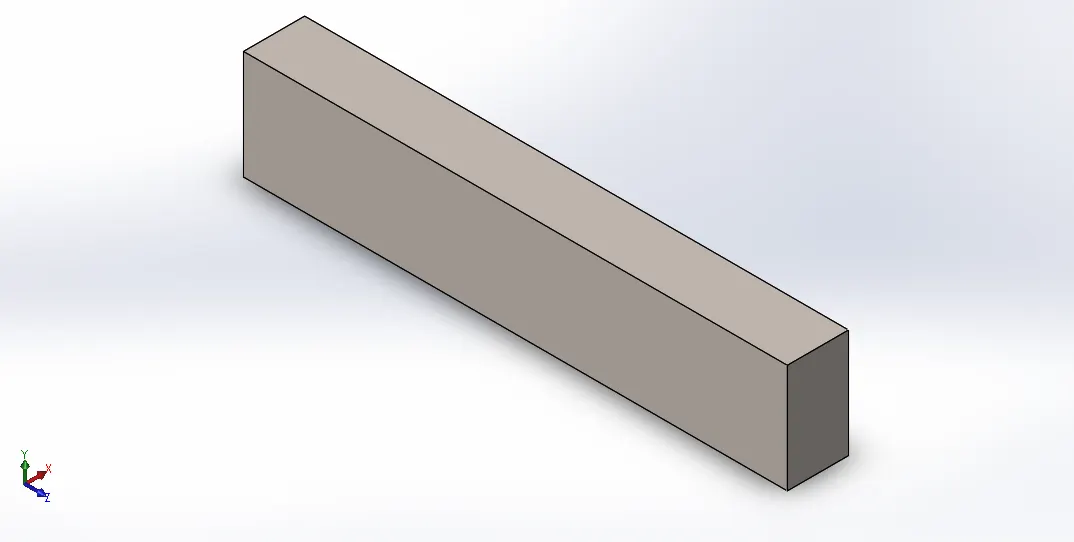
This is the bar with the respective dimensions mentioned and material used is Alloy Steel.
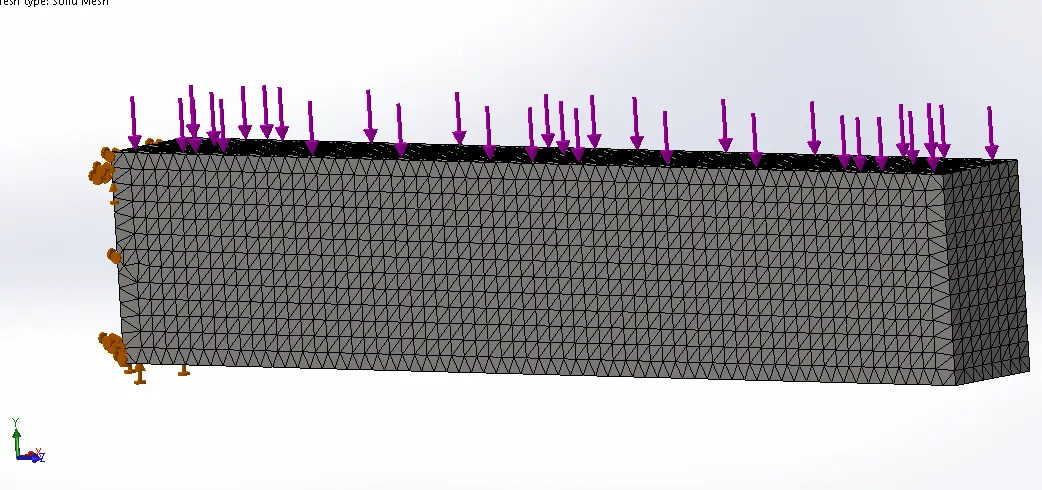
1) Using the Simulation option, We click on new study and select static analysis.
2) On clicking, We get a wide range of options.
3) Using the Fixtures command, we are fixing one end of the bar to make it perform like a cantilever.
4) The Force command is used to provide the required force of 1500N on the top view of the bar.
5) We provide the necessary mesh for the bar which is suitable for simulation.
6) Using the Run Command, we are able to study the static analysis for the stress induced in the bar, strain acting on the bar, the displacement of the bar. The following results are shown as follows:
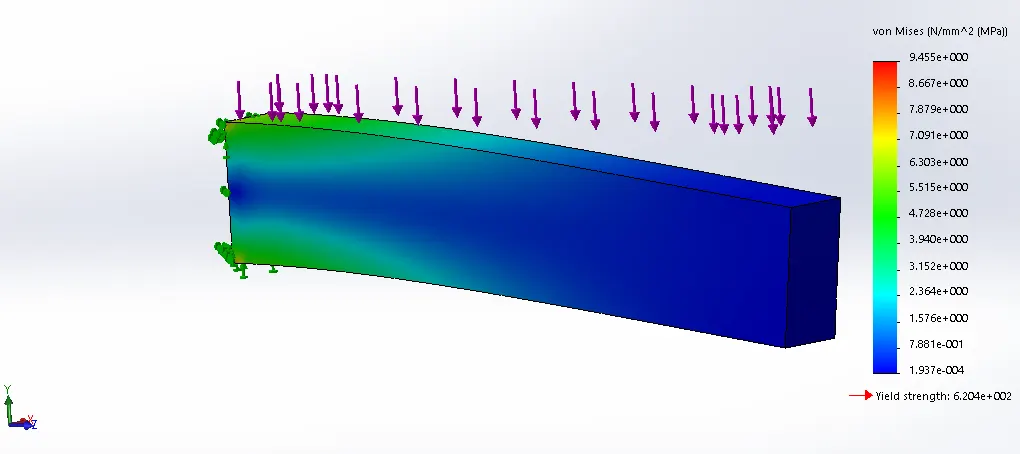
STRESS PLOT FOR BAR
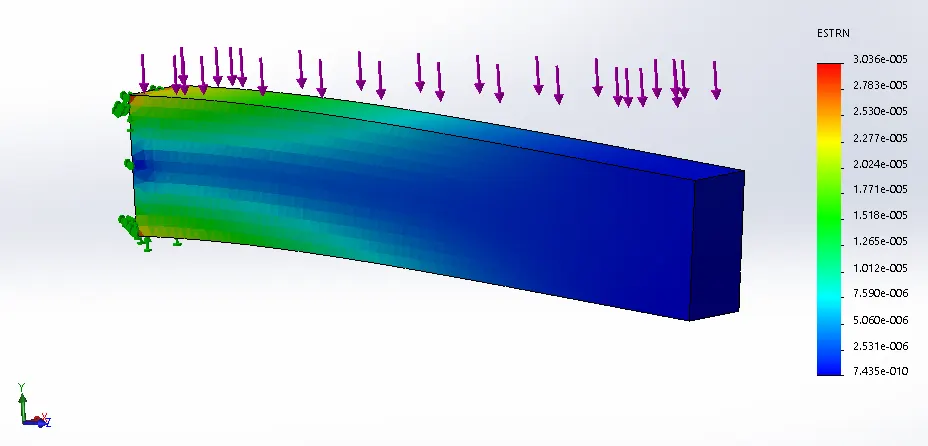
STRAIN PLOT FOR BAR
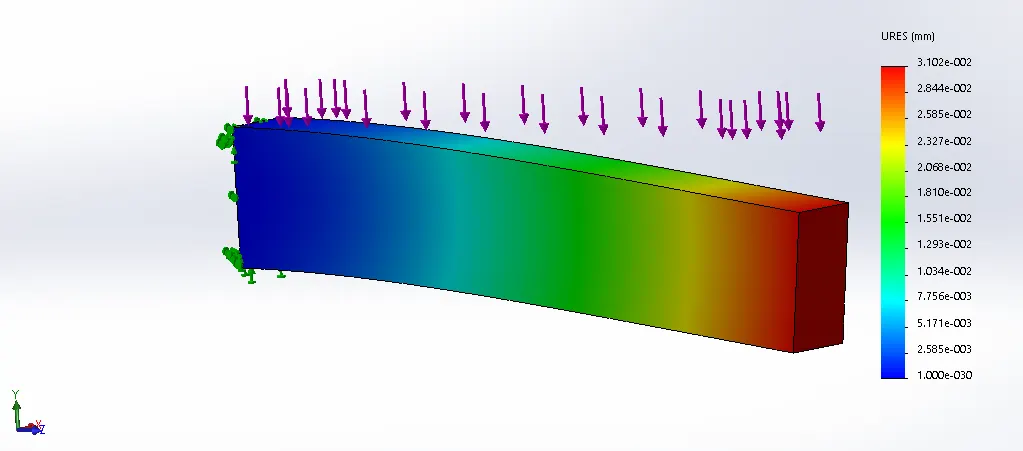
DISPLACEMENT PLOT FOR BAR
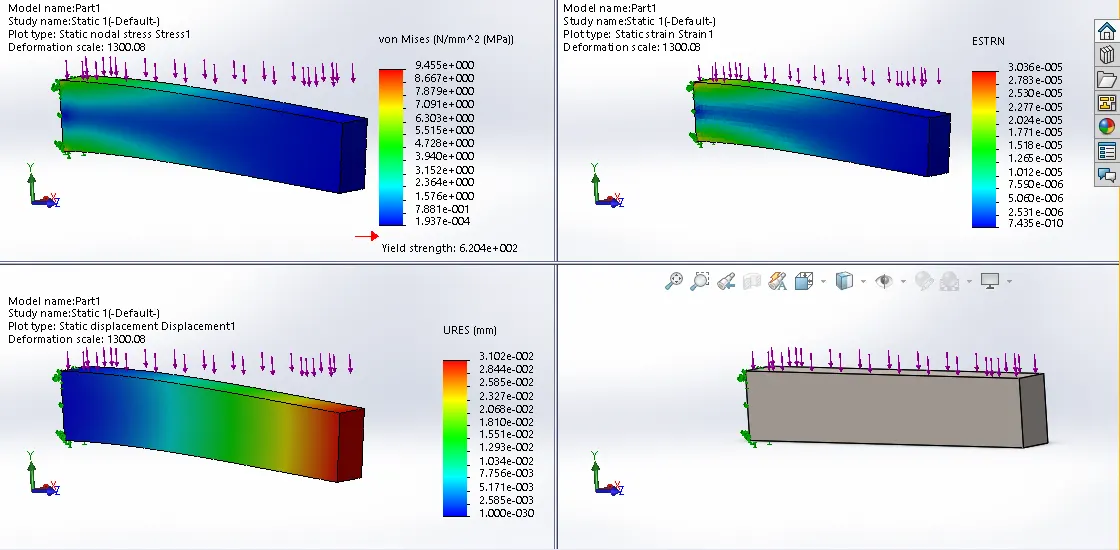
COMPARING RESULTS OF STRESS , STRAIN AND DISPLACEMENT FOR BAR
From the plots obtained, we can conclude the following:
1) MAXIMUM STRESS: `9.455` `frac{N}{mm^2}`
2) MAXIMUM STRAIN: `3.03*10^-5`
3) MAXIMUM DISPLACEMENT: `3.102*10^-2``mm`
CASE 2:
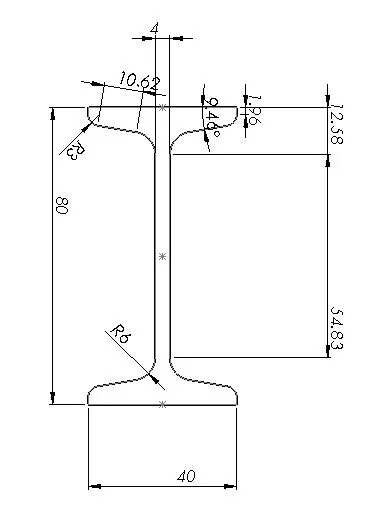
ALL DIMENSIONS ARE IN MM
BASIC PARAMETERS:
1) Load = 1500N.
2) Extrude Length = 400mm.
3) Material applied: Alloy Steel.
PROCEDURE:
1) Using above dimensions, we have created an I Section bar of length = 80mm, breadth = 40mm and height = 400mm which is created by extruding to a distance of 400mm.
2) A bar is created with 400mm dimension. Material of the bar is selected from the material property menu.
3) We have selected Alloy Steel as the material for the bar.
4) Selected material is applied to the bar. We then move on the simulation option in solidworks.
5) A new study is opened in Solidworks Simulation and the bar is imported to the Simulation section.
6) A new dialogue box appears, we click on static analysis to perform the required simulation.
7) We then provide the necessary fixtures by fixing one end of the bar and making it behave like a Cantilever.
8) Using the Force option, we are providing a load of 1500 N on the top surface of the bar which is 40mm.
9) We use the mesh option to create the required mesh for the bar. We have set it to standard mesh and provided outer mesh = 6mm , inner mesh = 1mm.
10) Once the mesh is done, we click on the Run Simulation option to get required results.
11) On doing so, we obtain the results for Stess, Strain and Displacement acting on the bar.
OUTPUTS OBTAINED:
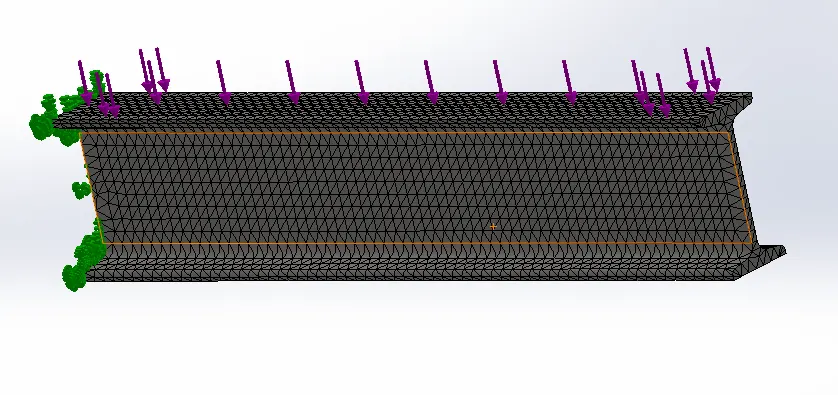
MODEL OF I SECTION BAR WITH MESH
1) Using the dimensions provided in the image, we have sketched the 2D drawing of I Section Bar.
2) Similarly we have used the Fixutres and mesh options to perform necessary calculations.
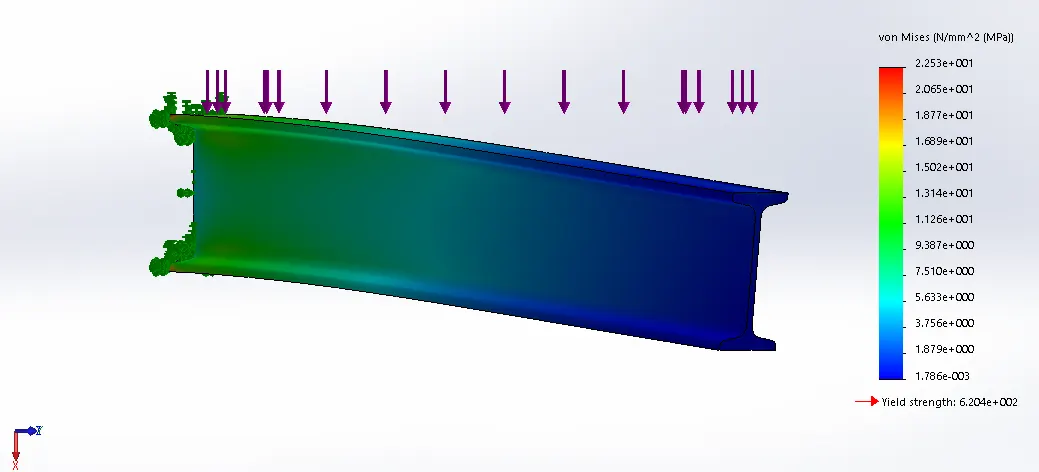
STRESS PLOT FOR I SECTION BAR
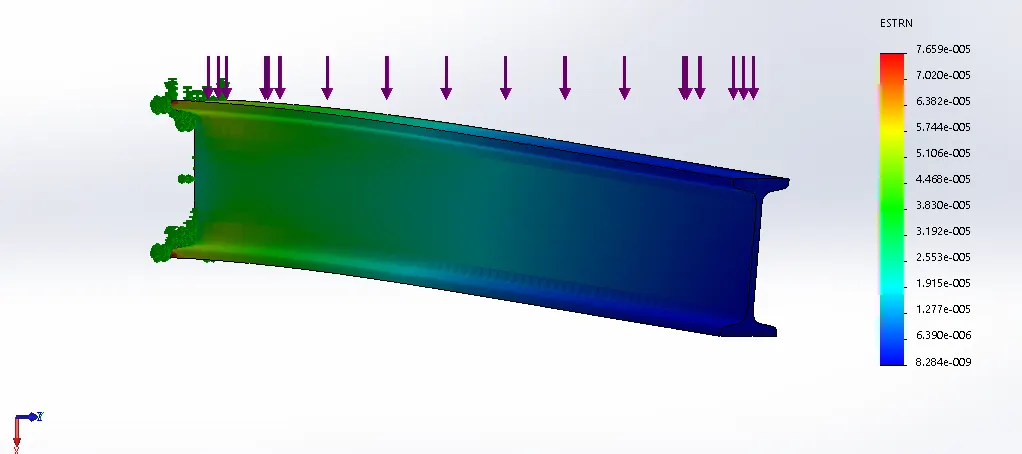
STRAIN PLOT FOR I SECTION BAR
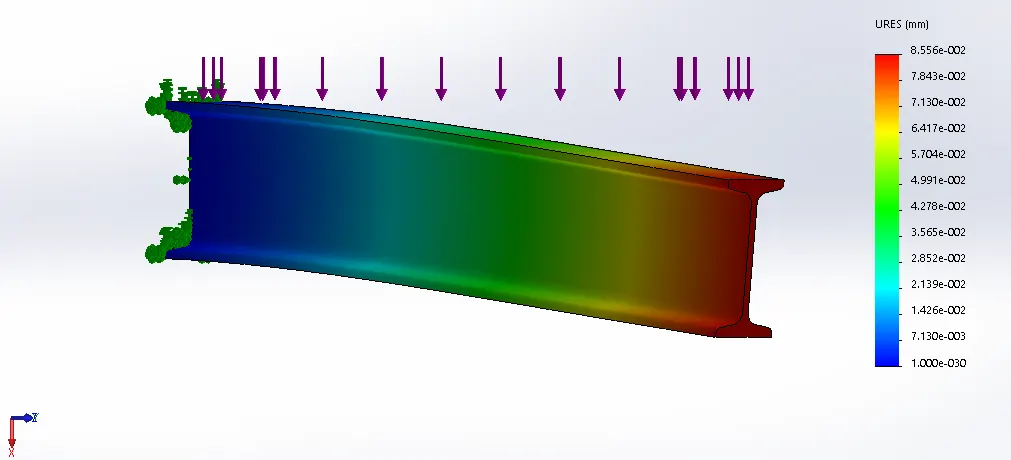
DISPLACEMENT FOR I SECTION BAR
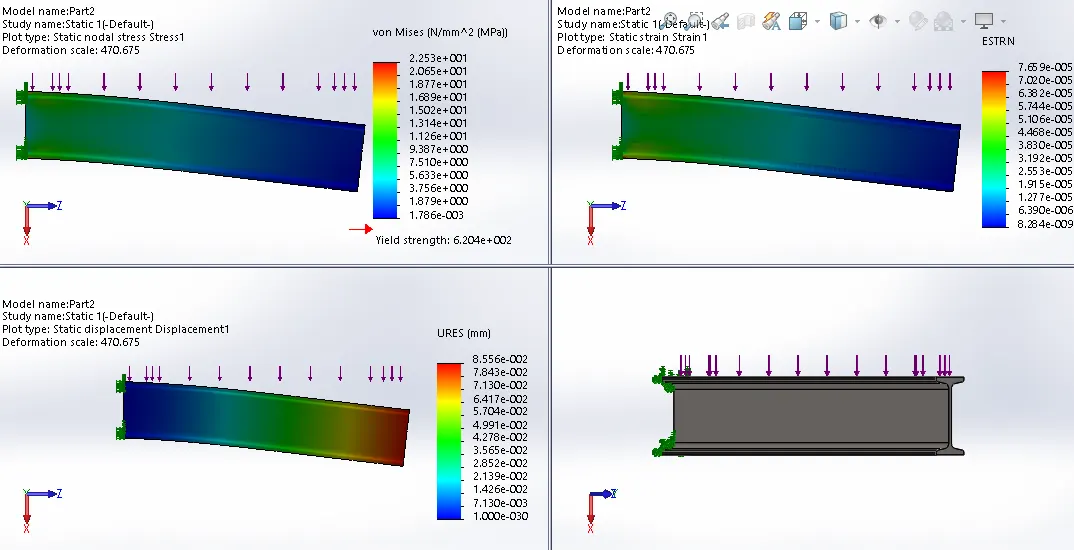
COMPARISON STRESS,STRAIN AND DISPLACEMENT FOR I SECTION BAR
From the results we got above, we can conclude the following:
1) MAXIMUM STRESS: `22.53 frac{N}{mm^2}`
2) MAXIMUM STRAIN: `7.659*10^-5`
3) MAXIMUM DISPLACEMENT: `8.566*10^-2mm`
CASE 3:
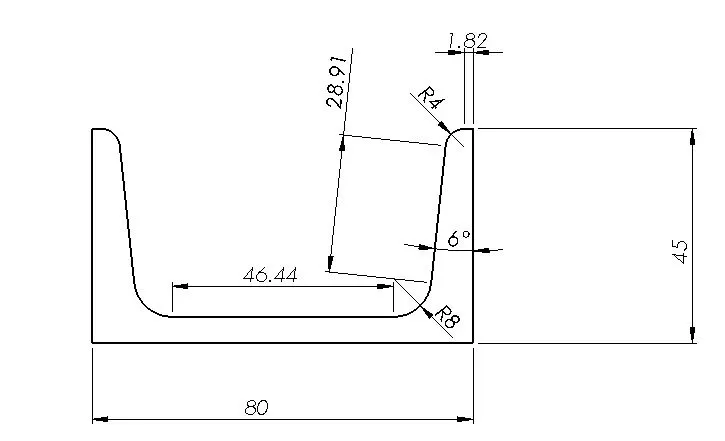
ALL DIMENSIONS ARE IN MM
BASIC PARAMETERS:
1) Load = 1500N.
2) Extrude Length = 400mm.
3) Material applied: Alloy Steel.
PROCEDURE:
1) Using above dimensions, we have created an C Section bar of length = 80mm, breadth = 45mm and height = 400mm which is created by extruding to a distance of 400mm.
2) A C Section bar is created with 400mm dimension. Material of the bar is selected from the material property menu.
3) We have selected Alloy Steel as the material for the bar.
4) Selected material is applied to the bar. We then move on the simulation option in solidworks.
5) A new study is opened in Solidworks Simulation and the bar is imported to the Simulation section.
6) A new dialogue box appears, we click on static analysis to perform the required simulation.
7) We then provide the necessary fixtures by fixing one end of the bar and making it behave like a Cantilever.
8) Using the Force option, we are providing a load of 1500 N on the top surface of the bar which is 45mm.
9) We use the mesh option to create the required mesh for the bar. We have set it to standard mesh and provided outer mesh = 6mm , inner mesh = 1mm.
10) Once the mesh is done, we click on the Run Simulation option to get required results.
11) On doing so, we obtain the results for Stess, Strain and Displacement acting on the bar.
OUTPUTS OBTAINED:
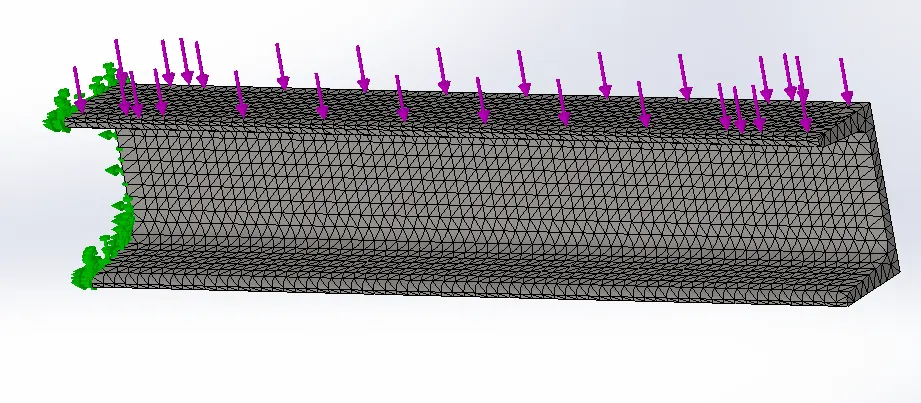
MODEL OF C SECTION BAR WITH MESH
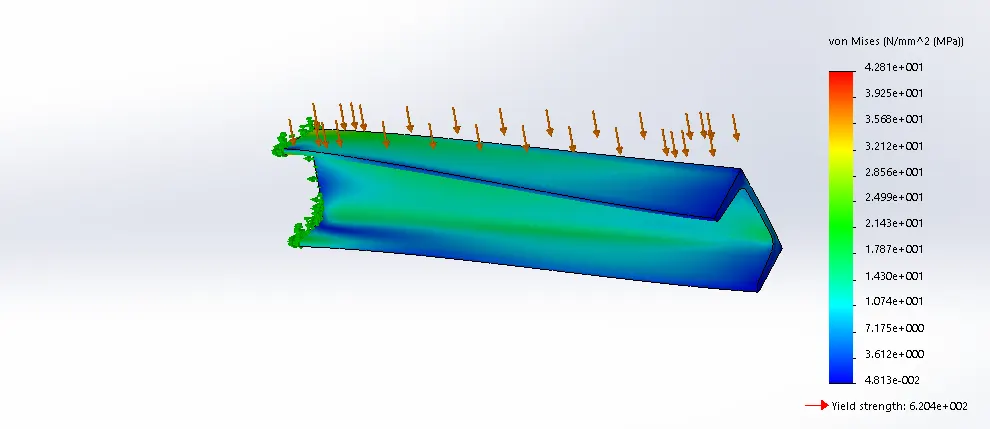
STRESS PLOT FOR C SECTION BAR
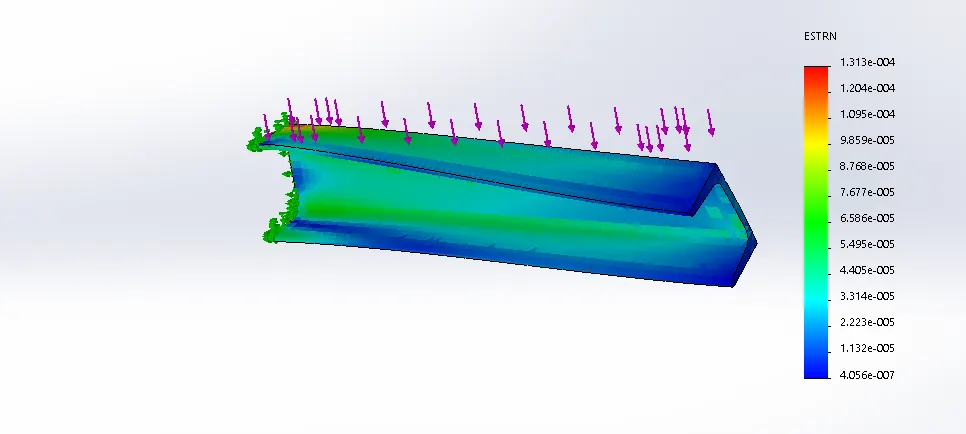
STRAIN PLOT FOR C SECTION BAR
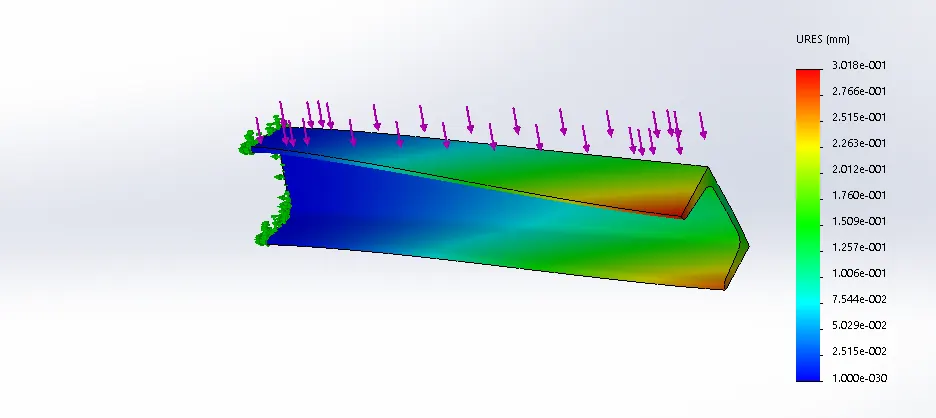
DISPLACEMENT PLOT FOR C SECTION BAR
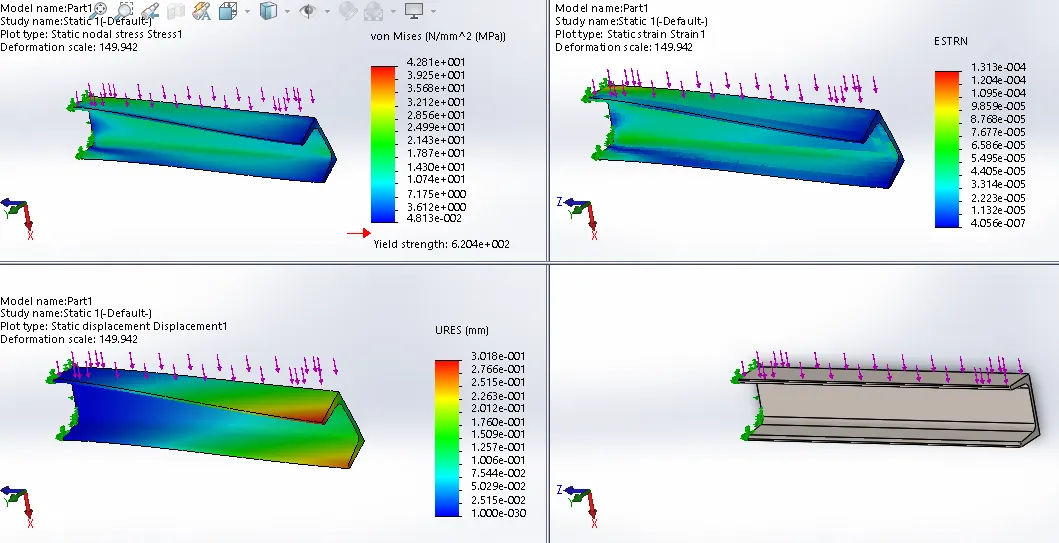
COMPARISSON OF STRESS,STRAIN AND DISPLACEMENT FOR C SECTION BAR
From the results gathered above, we can conclude that:
1) MAXIMUM STRESS: `42.81 frac{N}{mm^2}`
2) MAXIMUM STRAIN: `1.313*10^-4`
3) MAXIMUM DISPLACEMENT: `0.3018 mm`
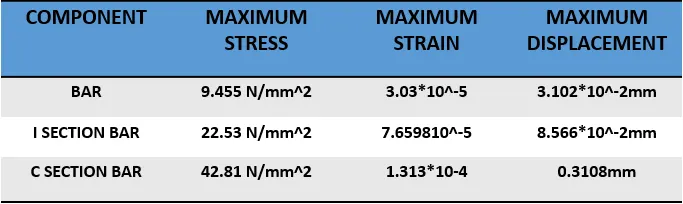
TABLE FOR RESULT COMPARISON:
CONCLUSIONS:
From the above table, we can conclude the following:
1) Maximum Stress is found in C Section Bar which is about 42.81 N/mm^2.
2) Maximum Strain is found in C Section Bar which is about 1.313*10^-4.
3) Maximum Displacement is found in C Section Bar which is about 0.3108mm.
RESULT:
From the above table it is found out that the C Section Bar has the highest stress,strain and Displacement among the three types of Bars.