Combustion simulation
Aim: To perform a combustion simulation on given combustor model and to observe the variation of mass fraction of different species in the simulation.
Objective:
Part 1
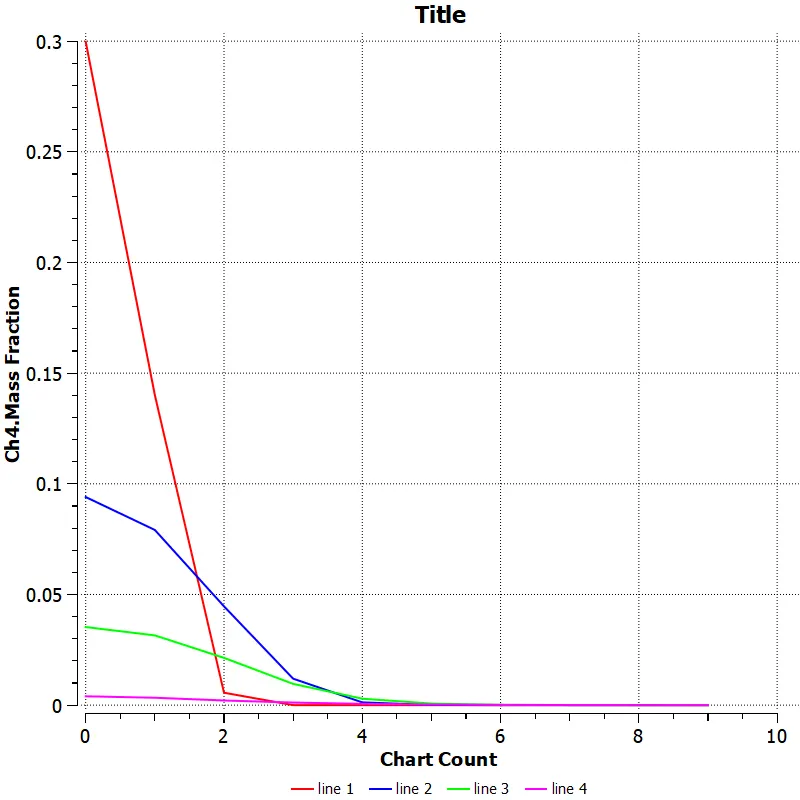
1) Perform a combustion simulation and plot the variation of mass fraction of different species in the simulation using line probe at different location.
2) Setup NOx and soot model to observe NOx emissions and soot formation.
Part 2
1) Add water content in the fuel from 5% to 30% by mole.
2) Provide necessary plots and contours from the CFD results.
Introduction:
The combustion is defined as a chemical reaction in which a hydrocarbon fuel reacts with an oxidant to form products, accompanied with the release of energy in the form of heat. Being the integral part of various engineering applications like internal combustion engines, furnace, power station combustors, combustion exhibits itself as a wide domain during the design, analysis and performance characterics stages of the above mentioned applications. In order to solve the complex equations from chemical kinetics and to yield information about the reaction mechanism proper physical modeling has to be done. In this project, the combustion process is simulated with the help of CFD software ANSYS fuent. When the combustion is incomplete, various pollutants are formed, some pollutants are carbon dioxide, carbon monoxide, lead, nitric oxide. In this project, the formation of pollutants from NOx emission which mainly consists of No, No2, N2o and soot formation which is a mass of impure carbon particles is simulated and the variation of mass fraction of pollutants from NOx emission and soot formation with the addition of water into the fuel in studied.
Geometric model of the given combustion model:
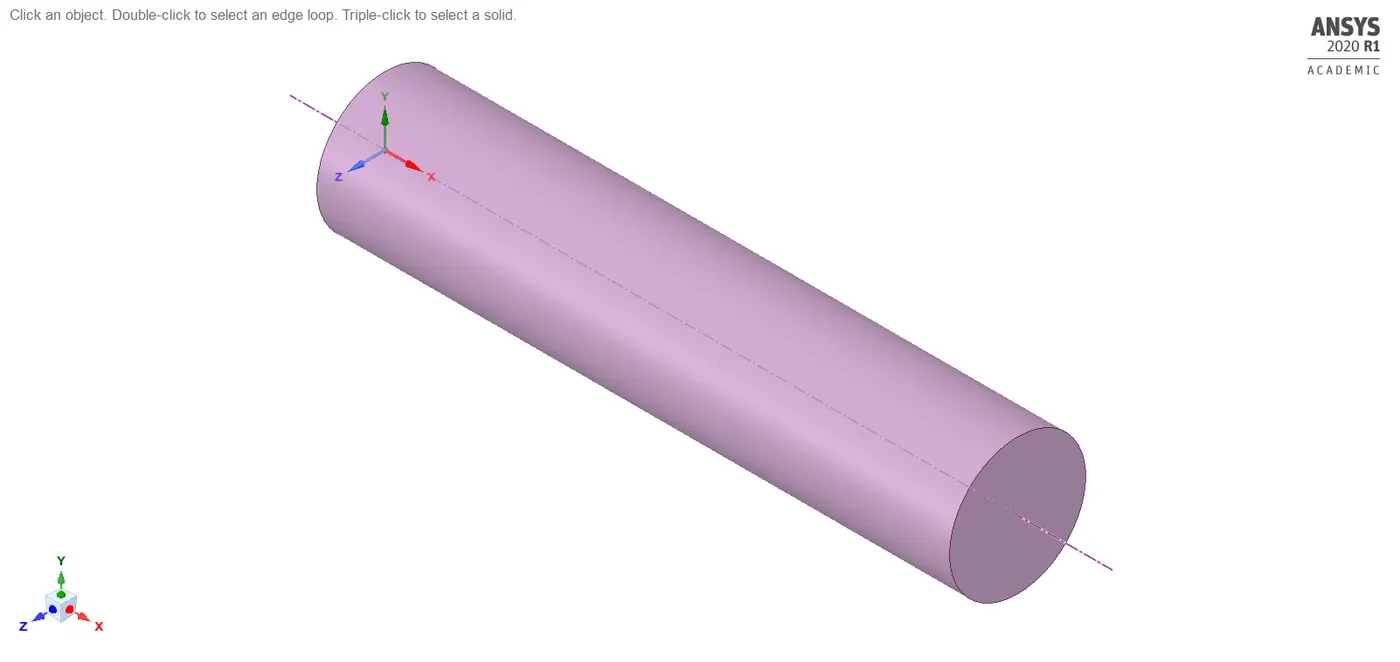
Isometric view of the given combustor model.
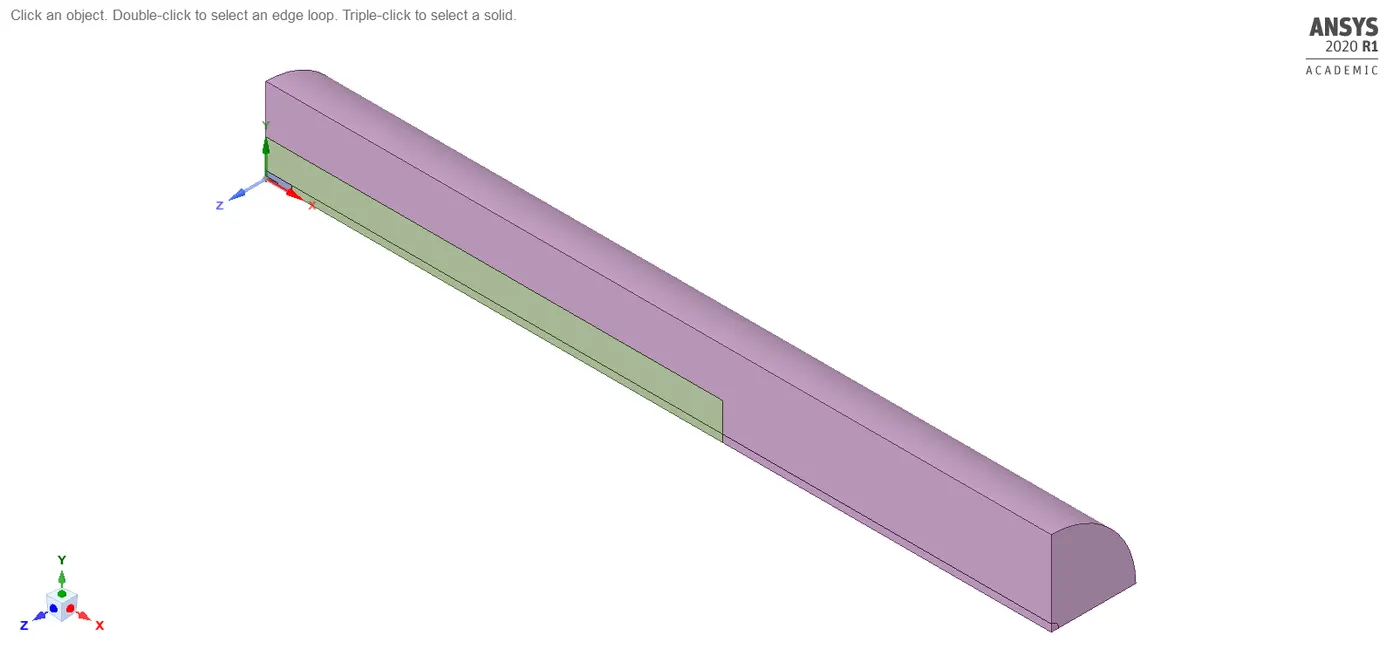
Splitting the body using slpit body command in spaceclaim.
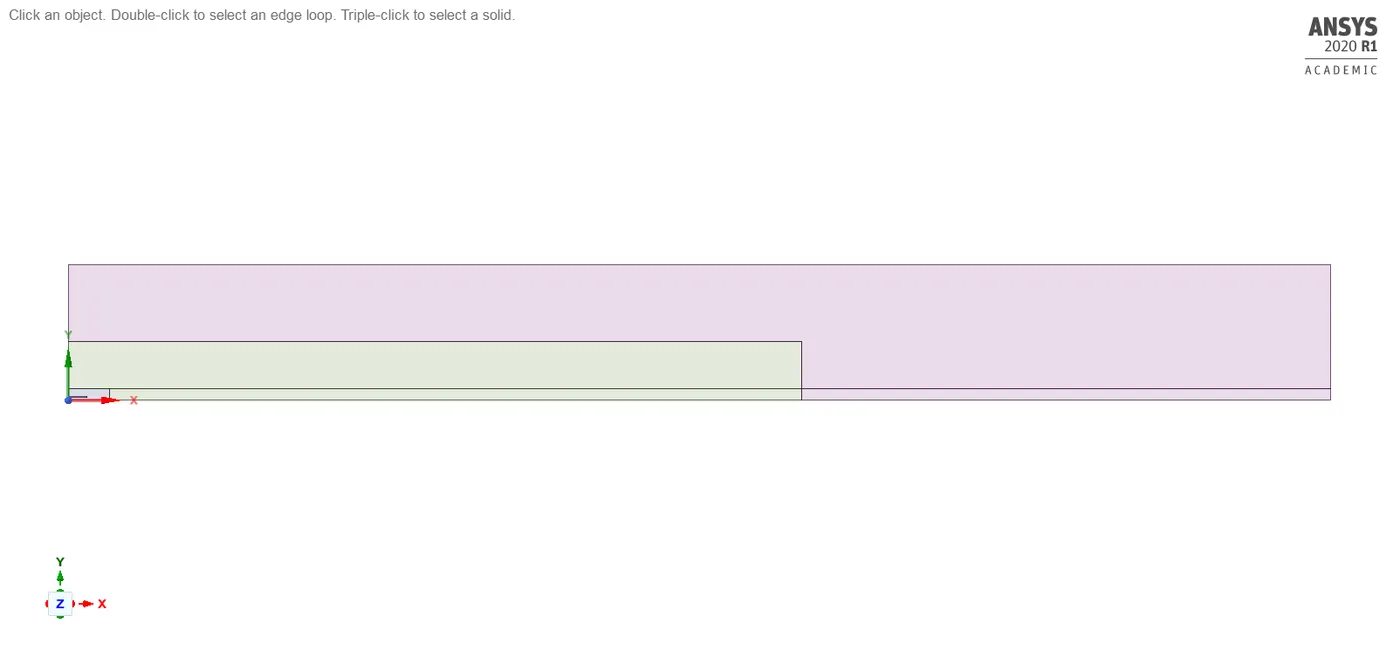
Converting the 3D model to 2D model by cpoying the surfaces and pasting it in the new design.
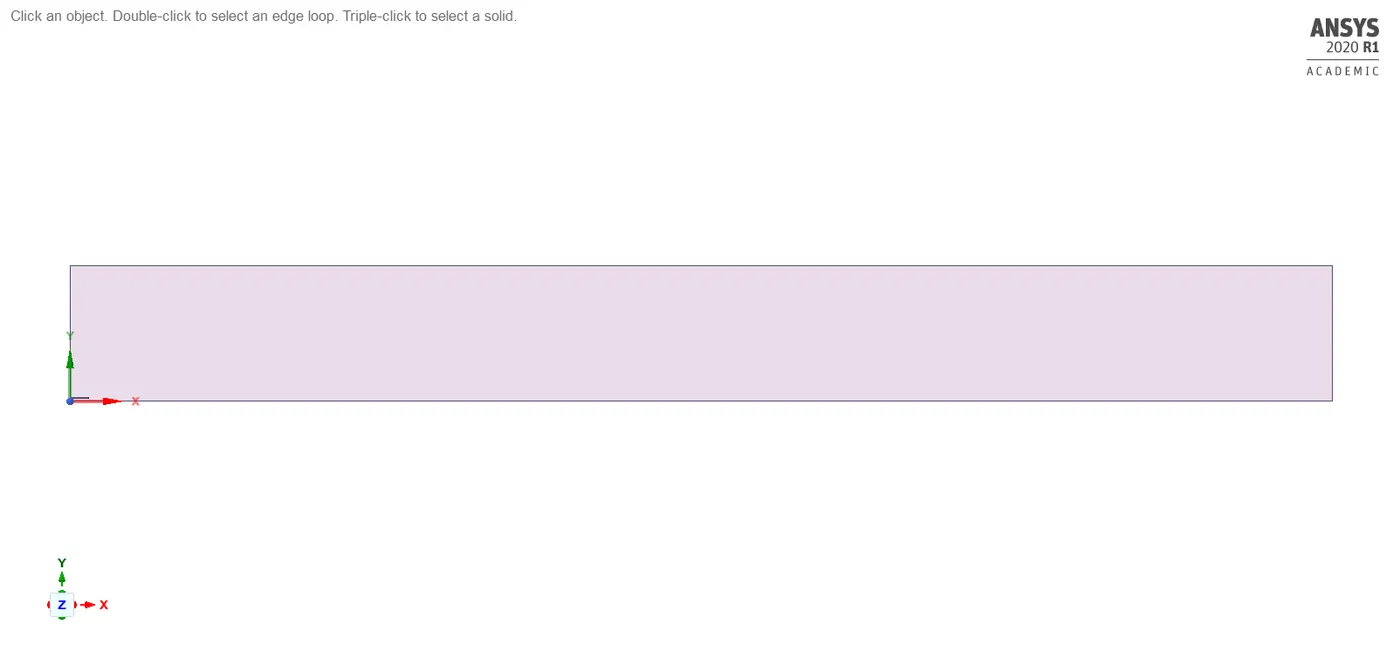
Combining all the faces using combine command in spaceclaim.
Mesh generated
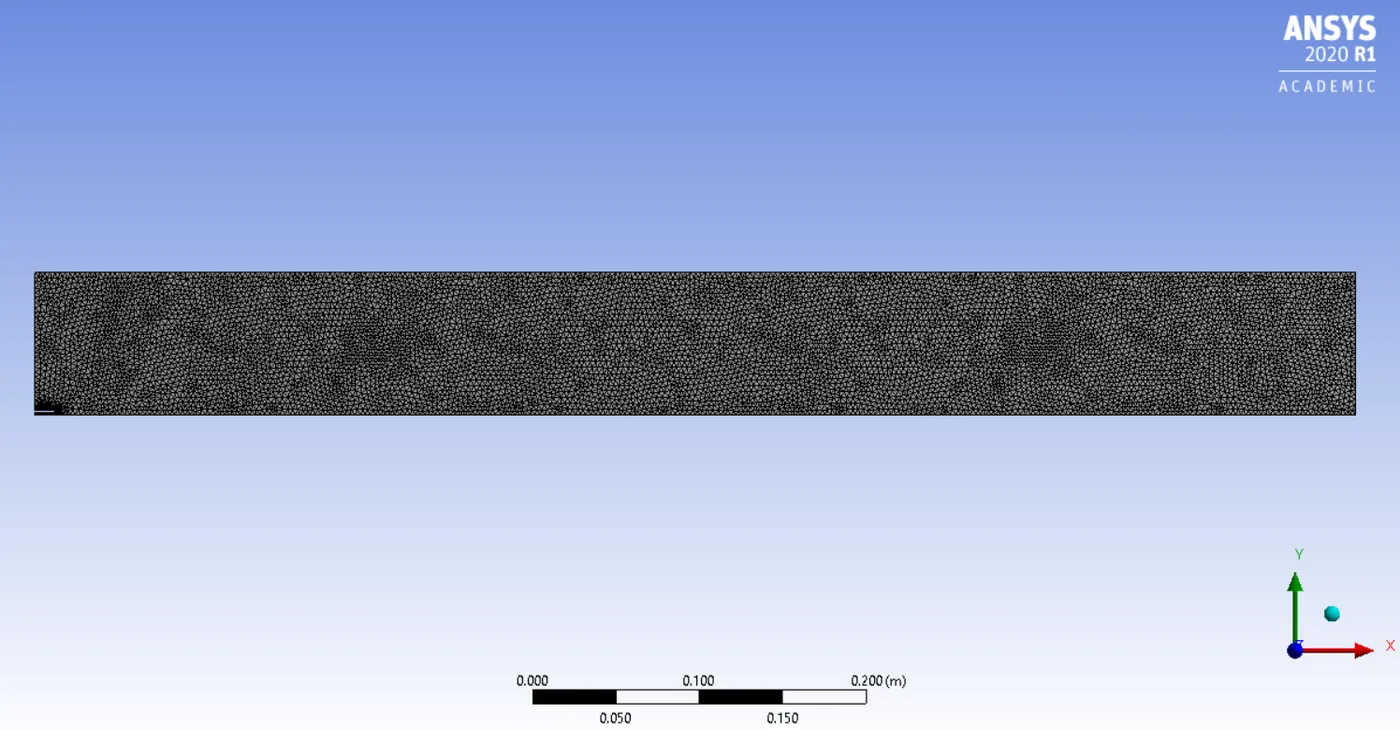
Mesh information
Number of Nodes: 16770
Number of Elements: 16123
Tetrahedra: 0
Wedges: 16123
Pyramids: 0
Hexahedra: 0
Polyhedra: 0
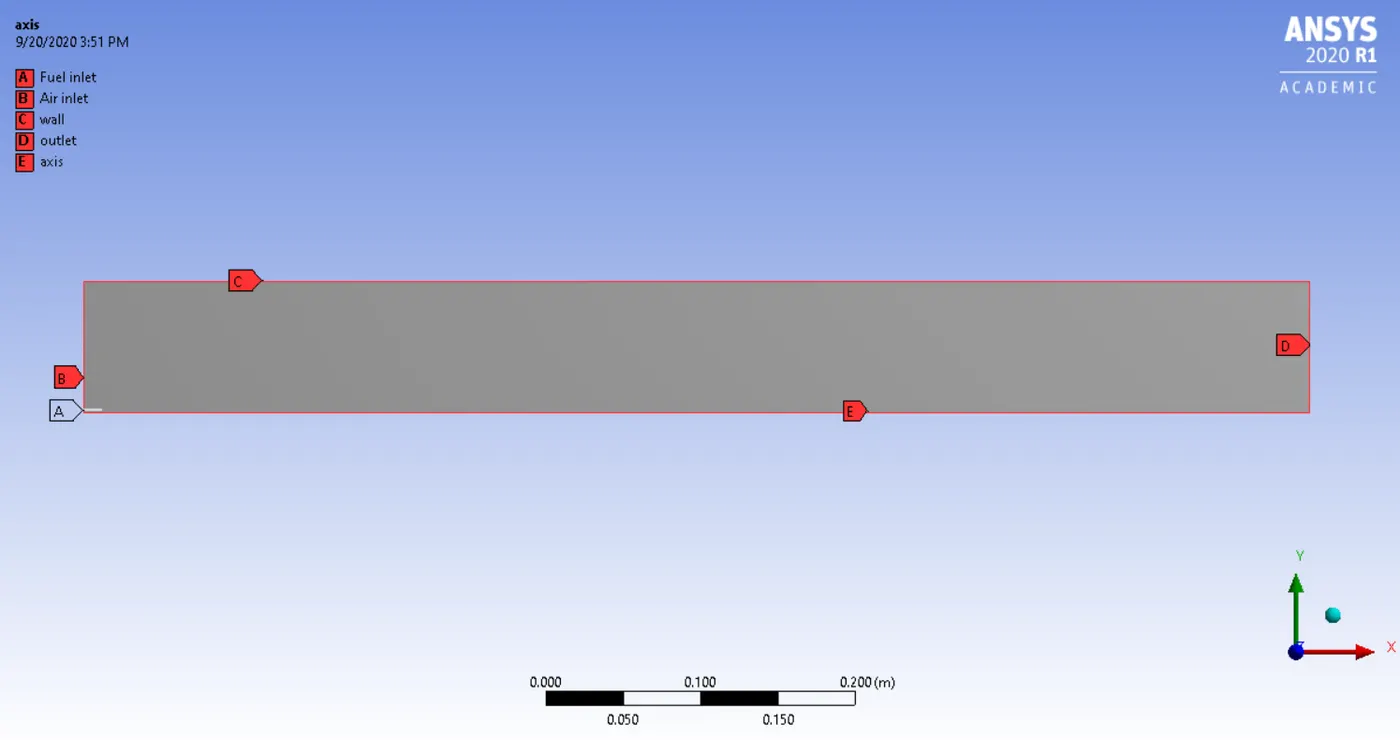
Boundary names
Case setup:
Solver type = Pressure based
Solver time = steady state
Viscous model = k-epsilon
Energy equations = enabled
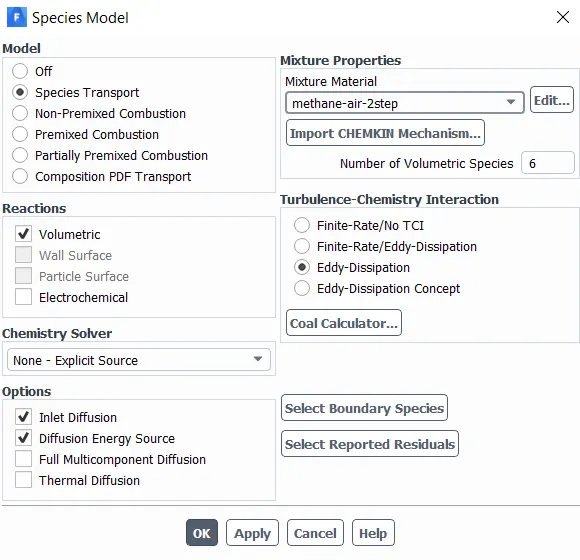
Species model
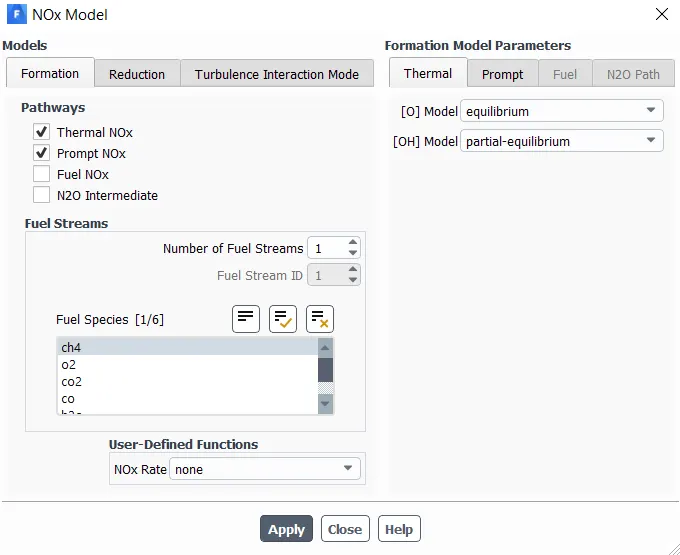
Nox model
Soot model
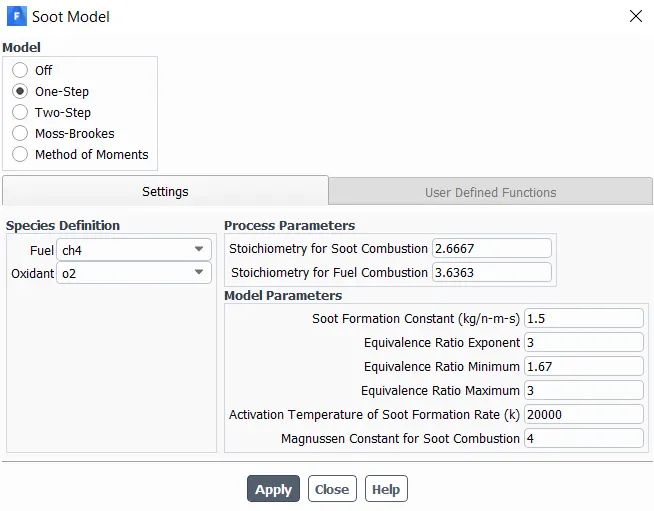
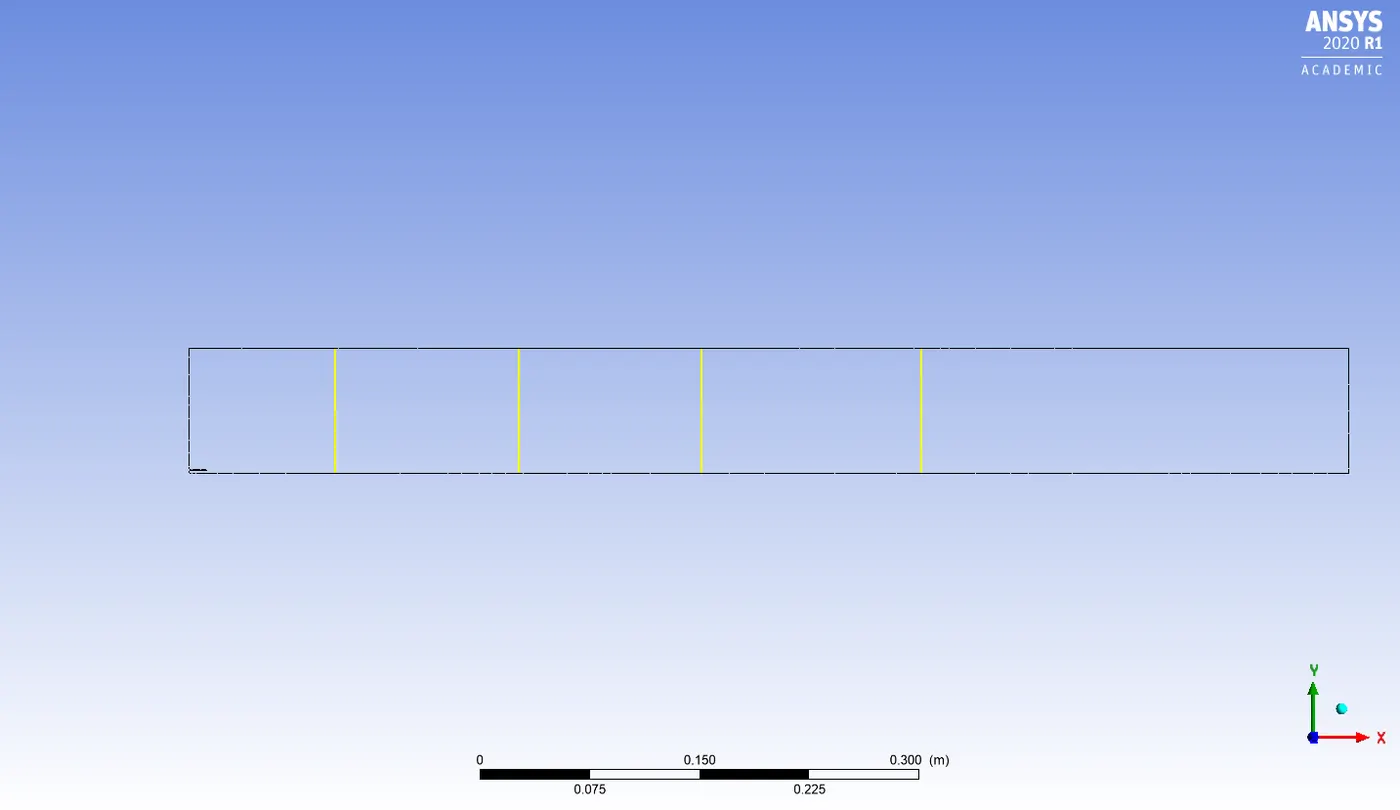
The geometry and the mesh generated and the case setup remains same for part 1 and part 2 except for the mass fraction of species in air-inlet and fuel-inlet. The academic version of ANSYS has certain limitaions hence, the given combustor model is imported to spaceclaim and is converted to 2-D geometry as illustrated in the above figures.
The mesh is generated with 16123 triangular elements as they are quick and easy to create and captures more details.
The steady state pressure based solver is used as the solver.
The k-epsilon model is selected for turbulence modeling, as the overall reaction rate is controlled by turbulent mixing.
The species transport equations is enebaled which helps in predicting the local mass fraction of each species in the simulation. The volumetric reaction is turned on as the reaction takes place in gaseous phase. The inlet diffusion is enabled to calculate the diffusion coefficients at inlet. The eddy dissipation model is selected for calculating the net rate of production of the species in the simulation.
The NOx model is turned on which helps in predicting the formation of pollutant No in the process of combustion. The NOx formation takes place by the oxidation of atmospheric nitrogen present in the combustion air hence, thermal NOx is enabled. The promt NOx is enabled as the high-speed reactions at the flame front causes NOx formation.
The one-step Soot model is enabled as it helps in predicting the rate of soot formation based on simple empirical rate.
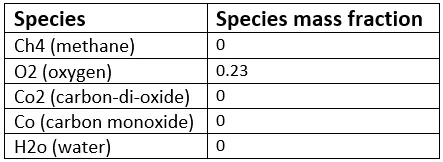
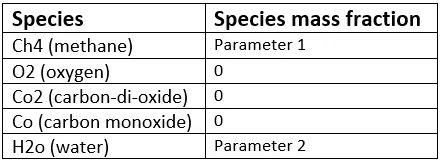
In part 1 of simulation, the mass fraction of H2o is 0 and Ch4 is 1 at fuel inlet and in part 2, the mass fraction of H20 is increased from 5% to 30% by mole. The results obtained from simulation is discussed below.
Part 1
Boundary conditions
Air inlet
Velocity = 0.5 m/s
Temperature = 300 K
Species
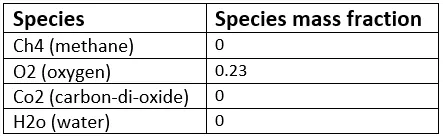
Fuel inlet
Velocity = 80 m/s
Temperature = 300 K
Species
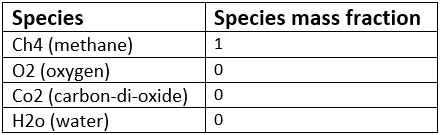
Top surface
Boundary type = wall
Axis
x-axis = axisymmetric
Results of part 1
Residual plot
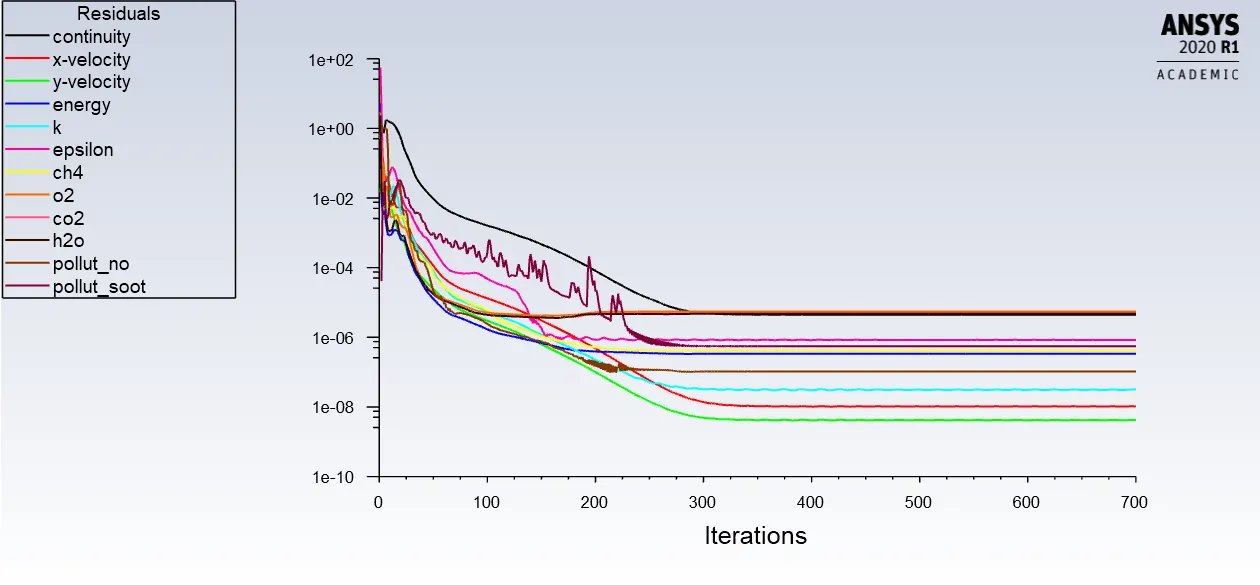
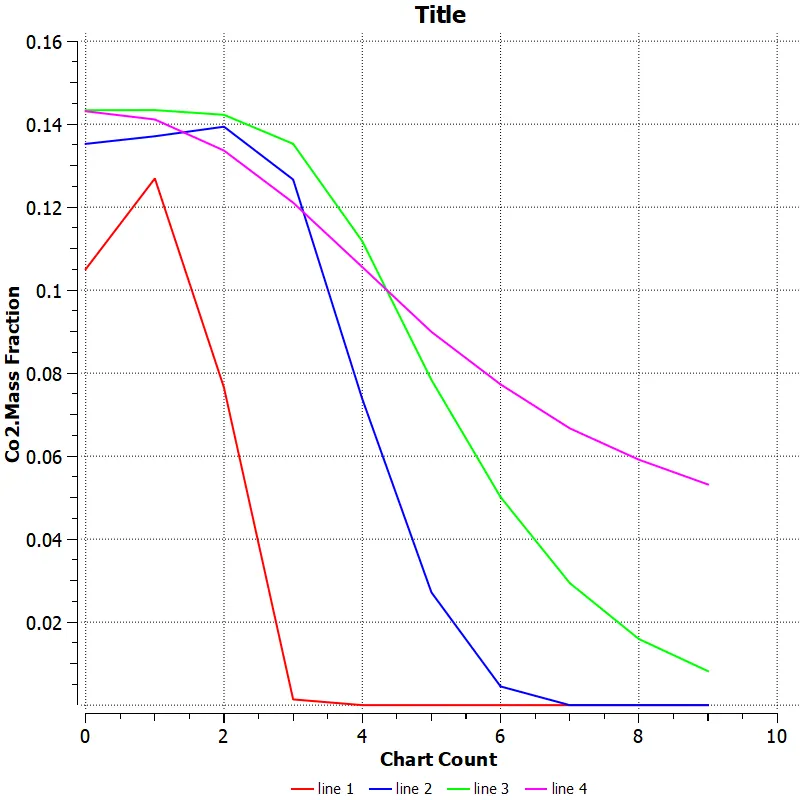
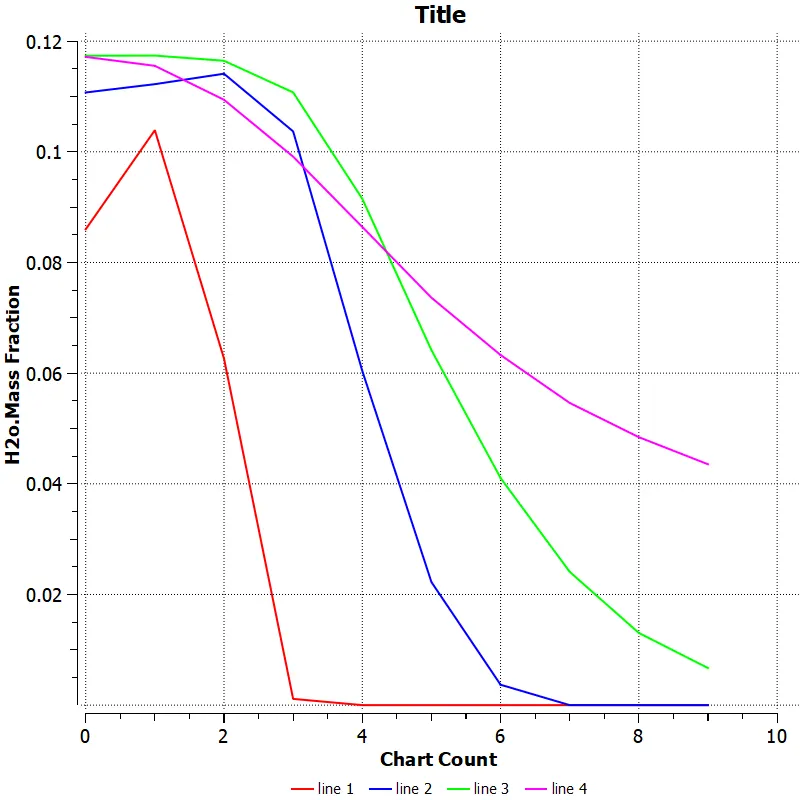
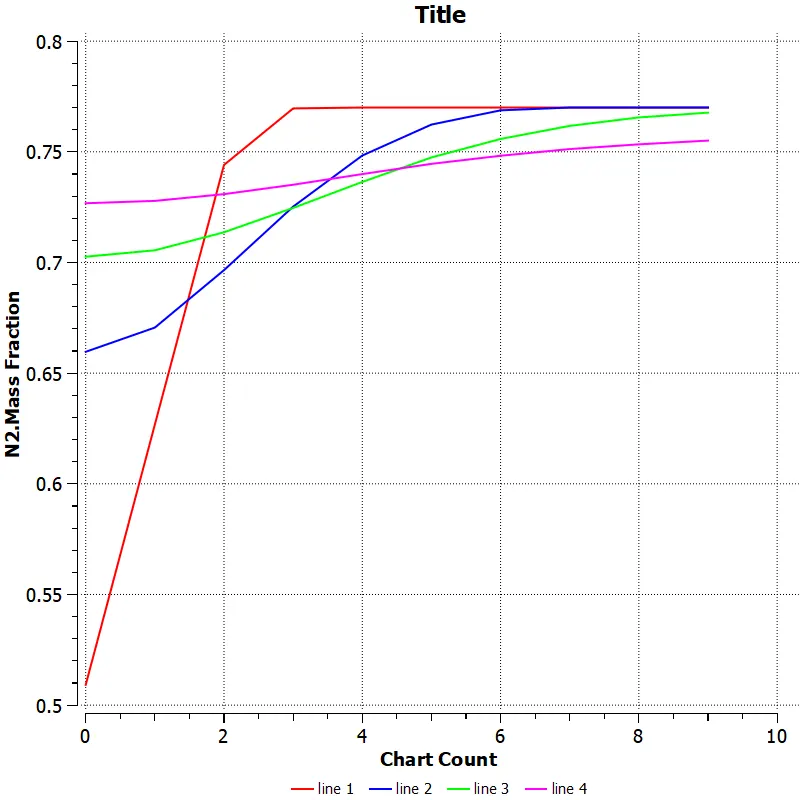
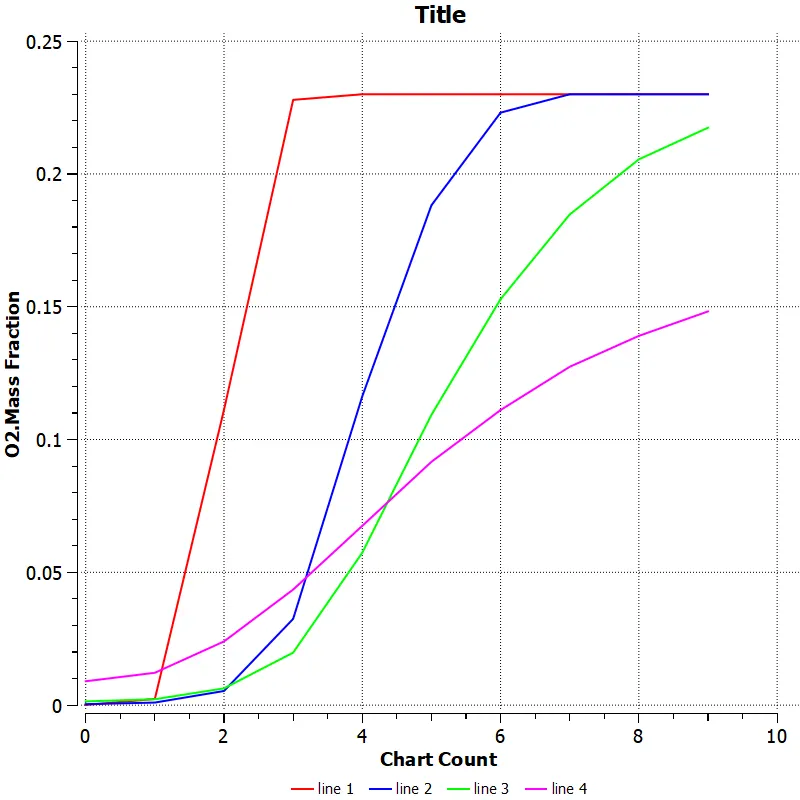
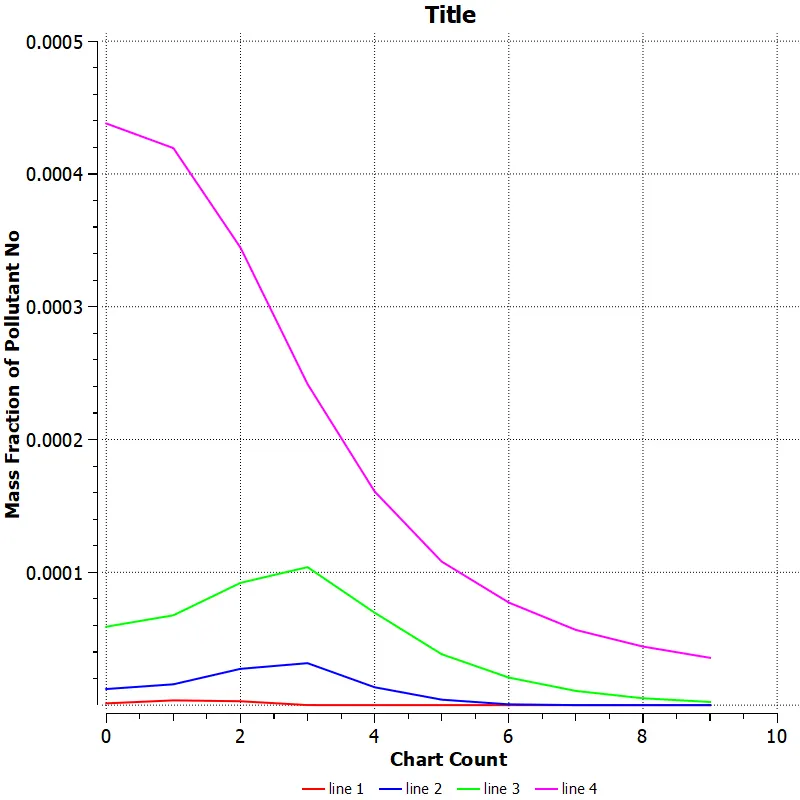
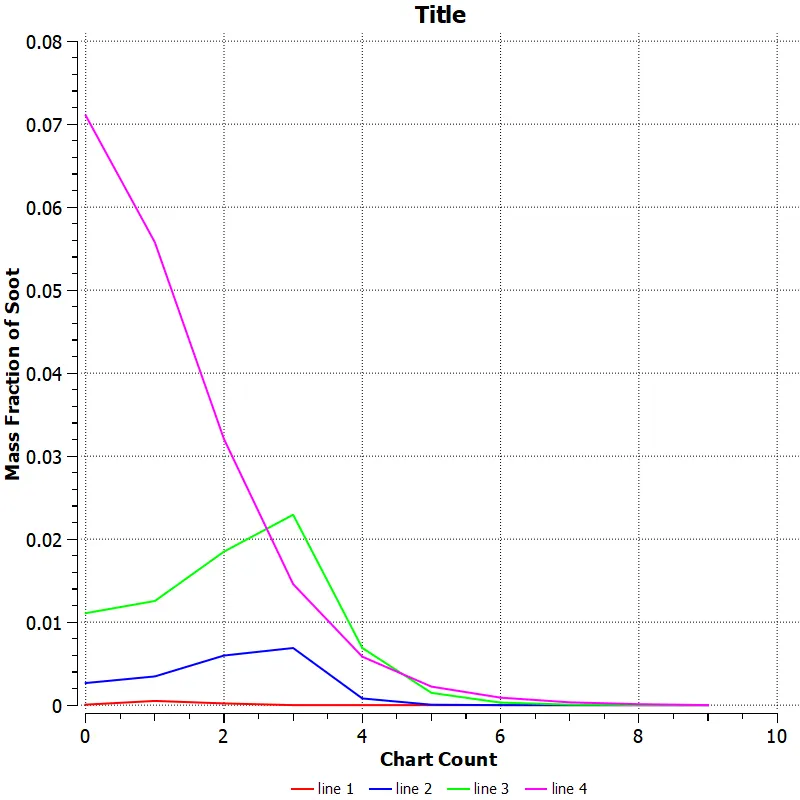
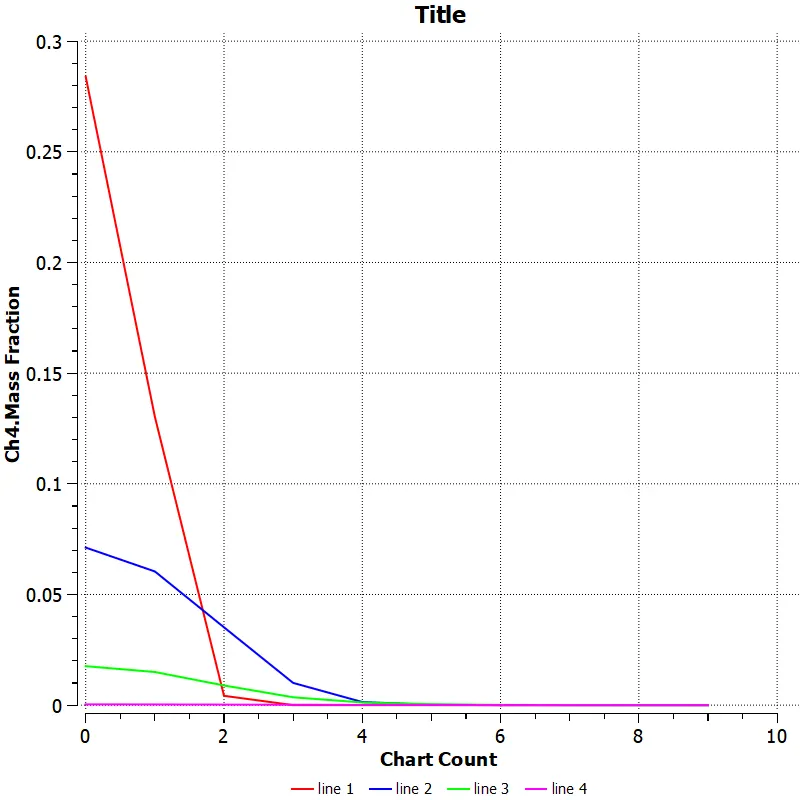
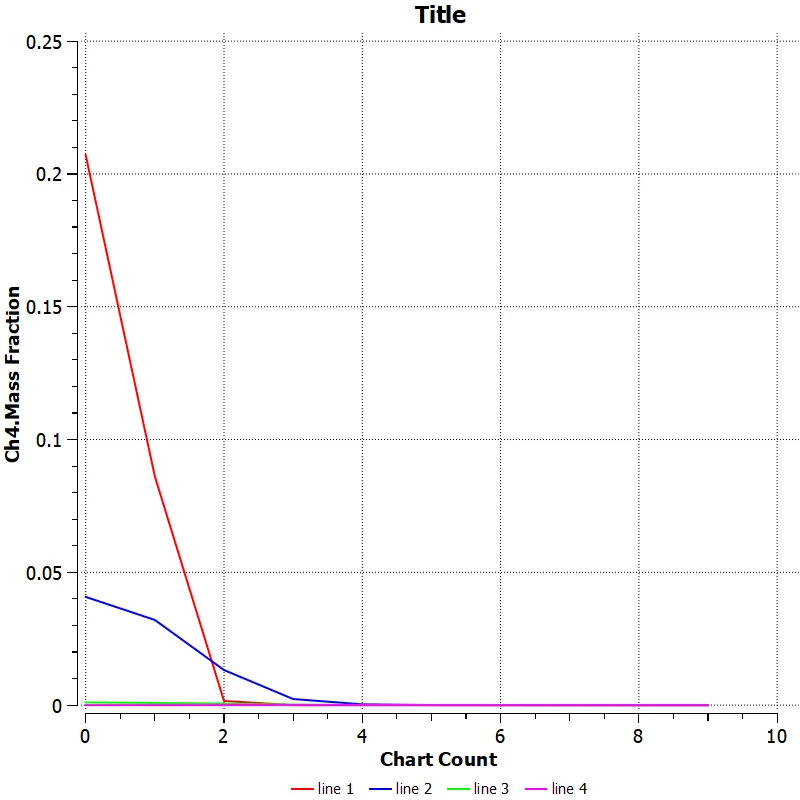
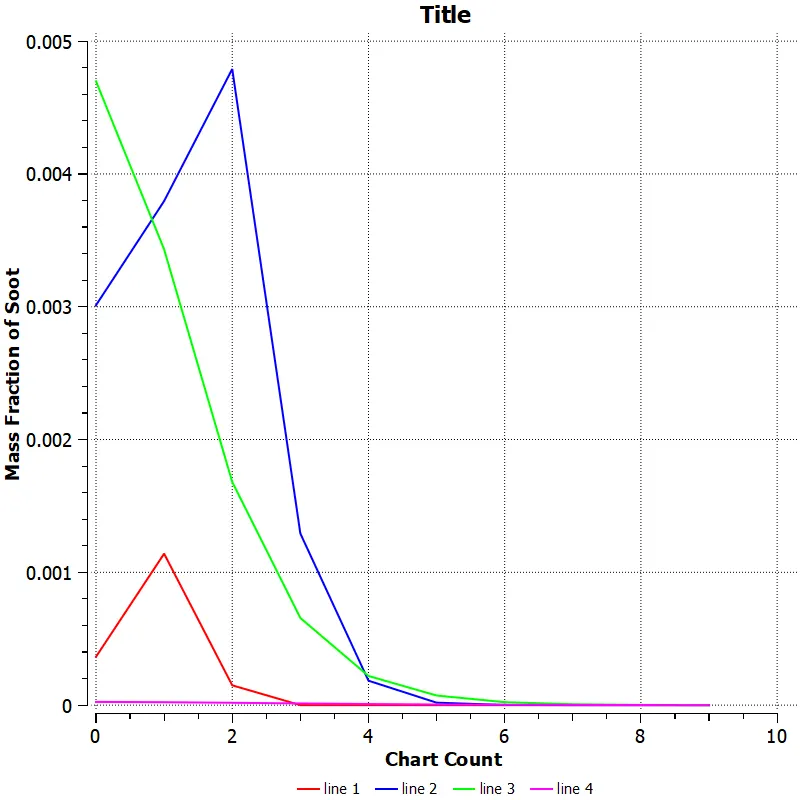
Line probes at different location of combustor
Temperature contour
Ch4 mass fraction
Co2 mass fraction
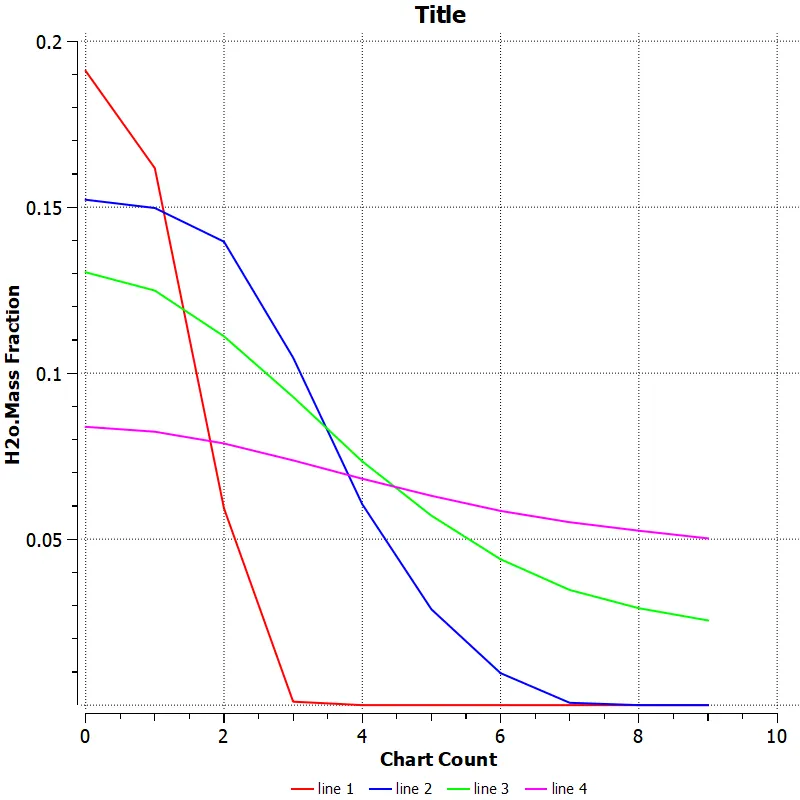
H2o mass fraction
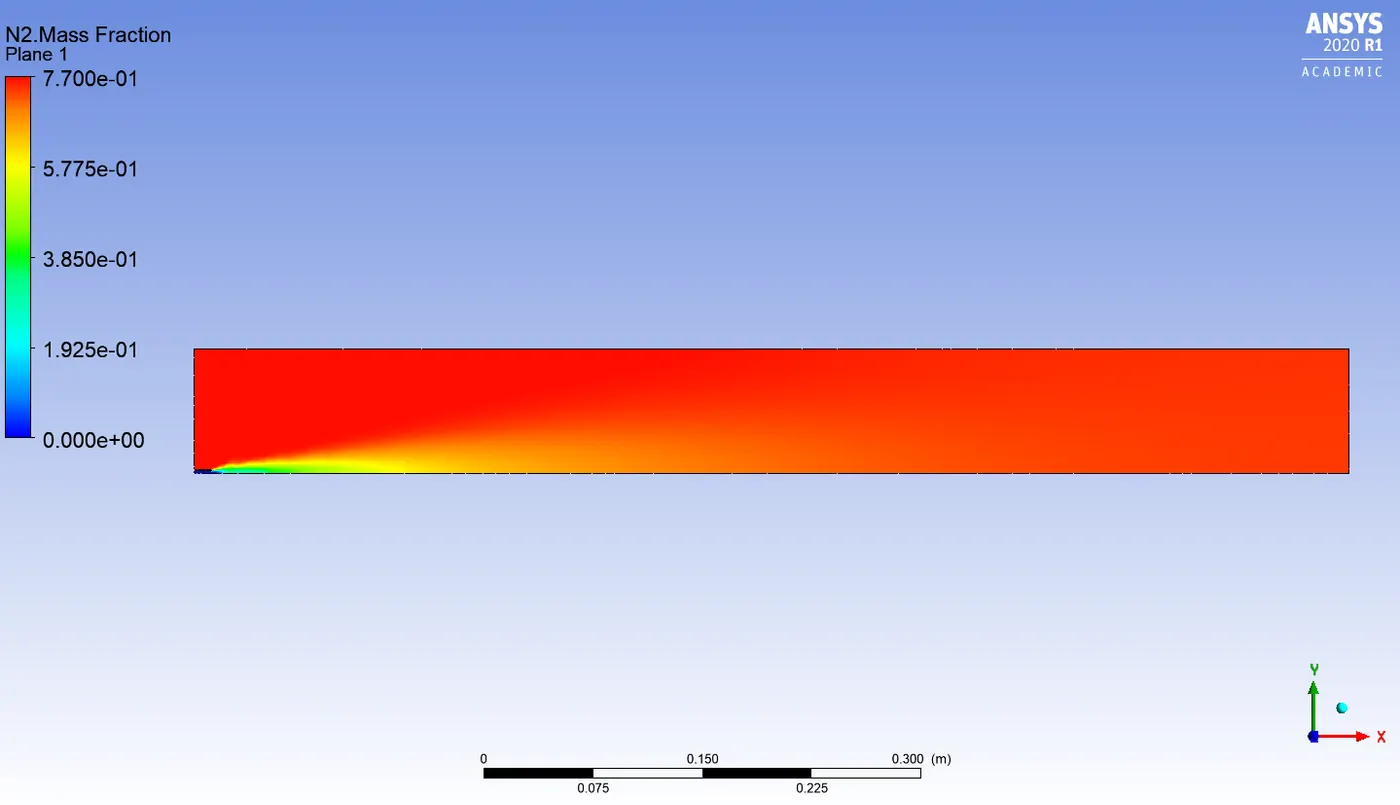
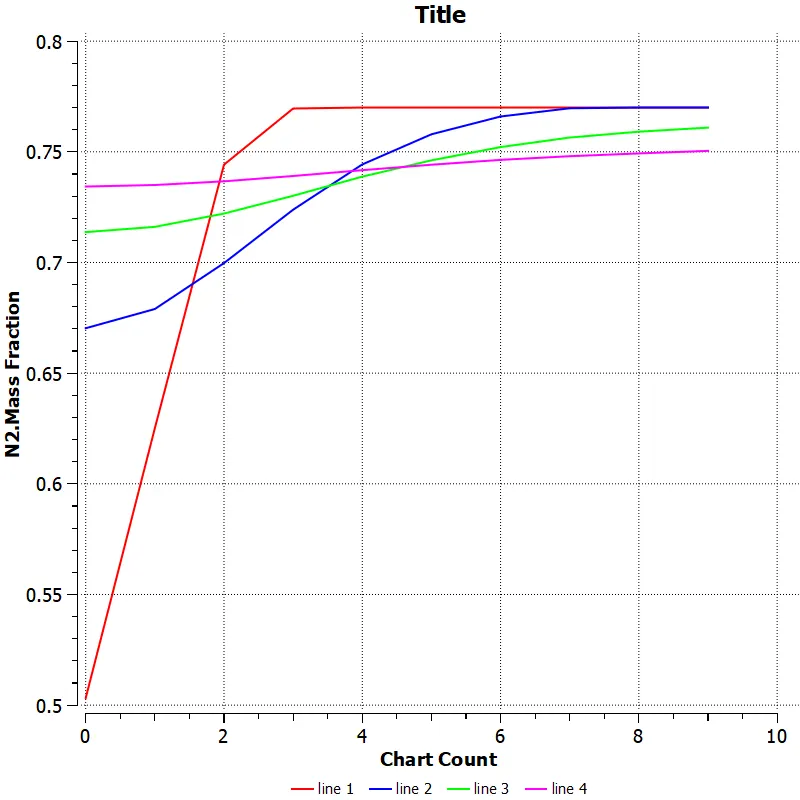
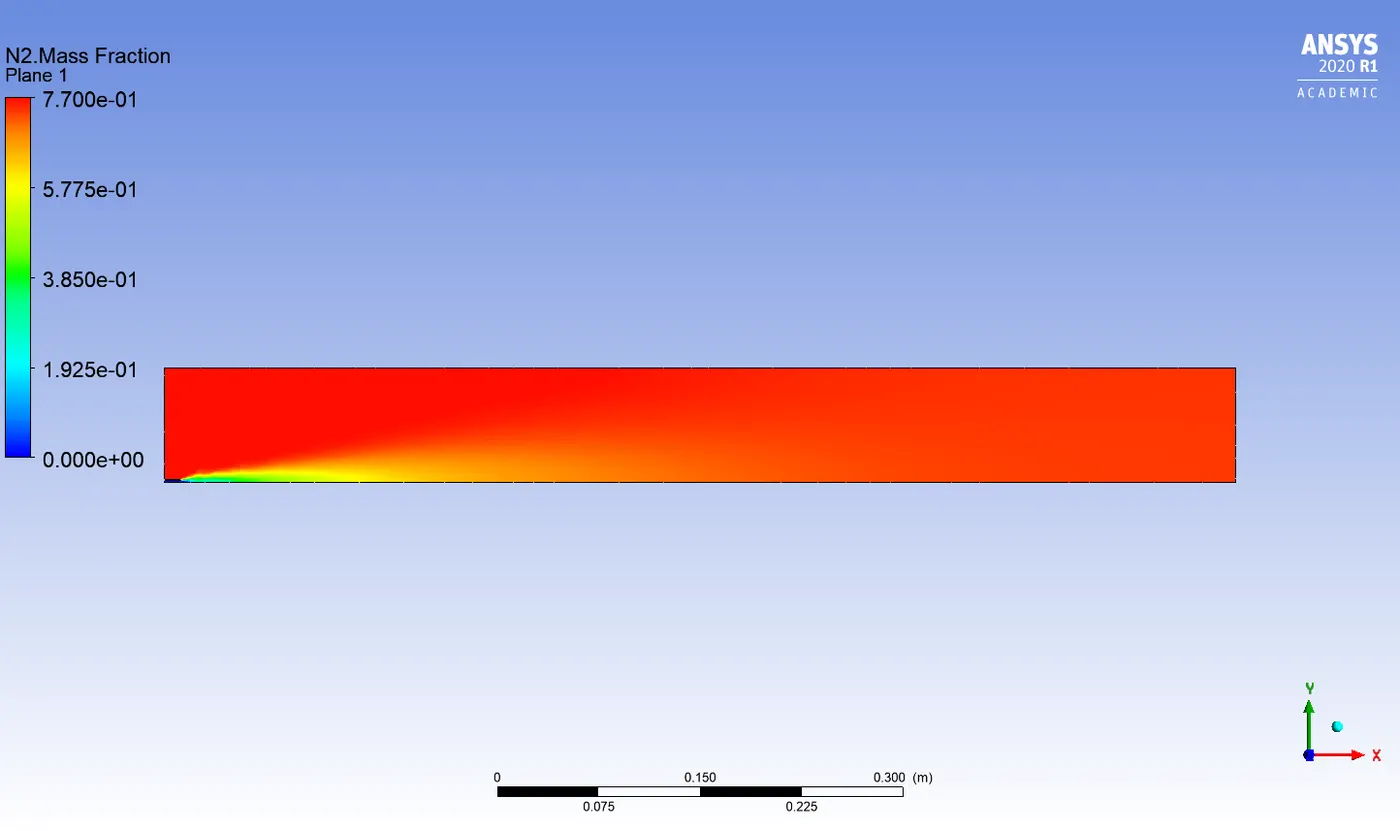
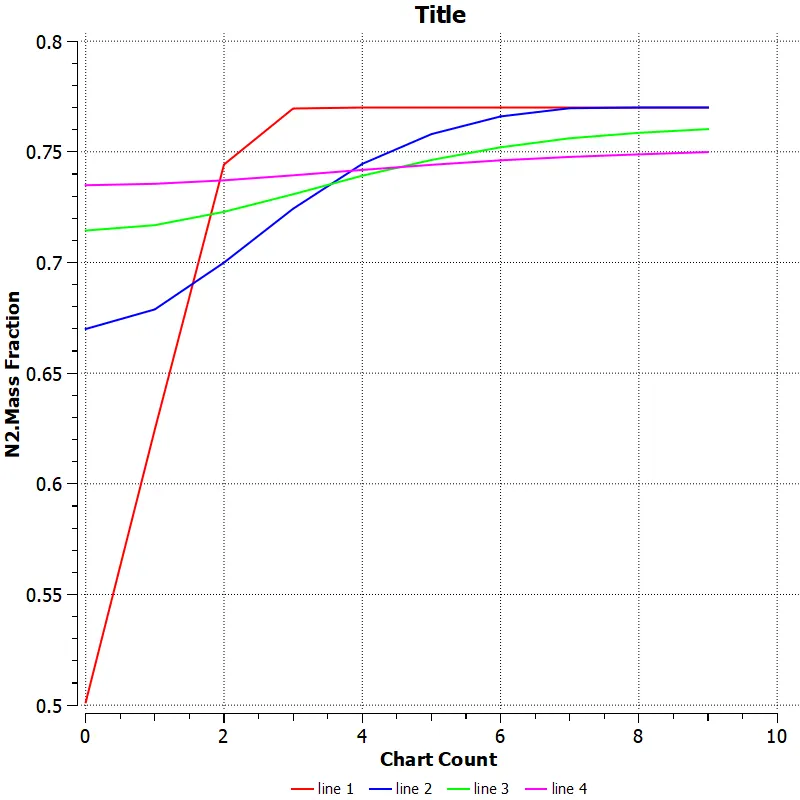
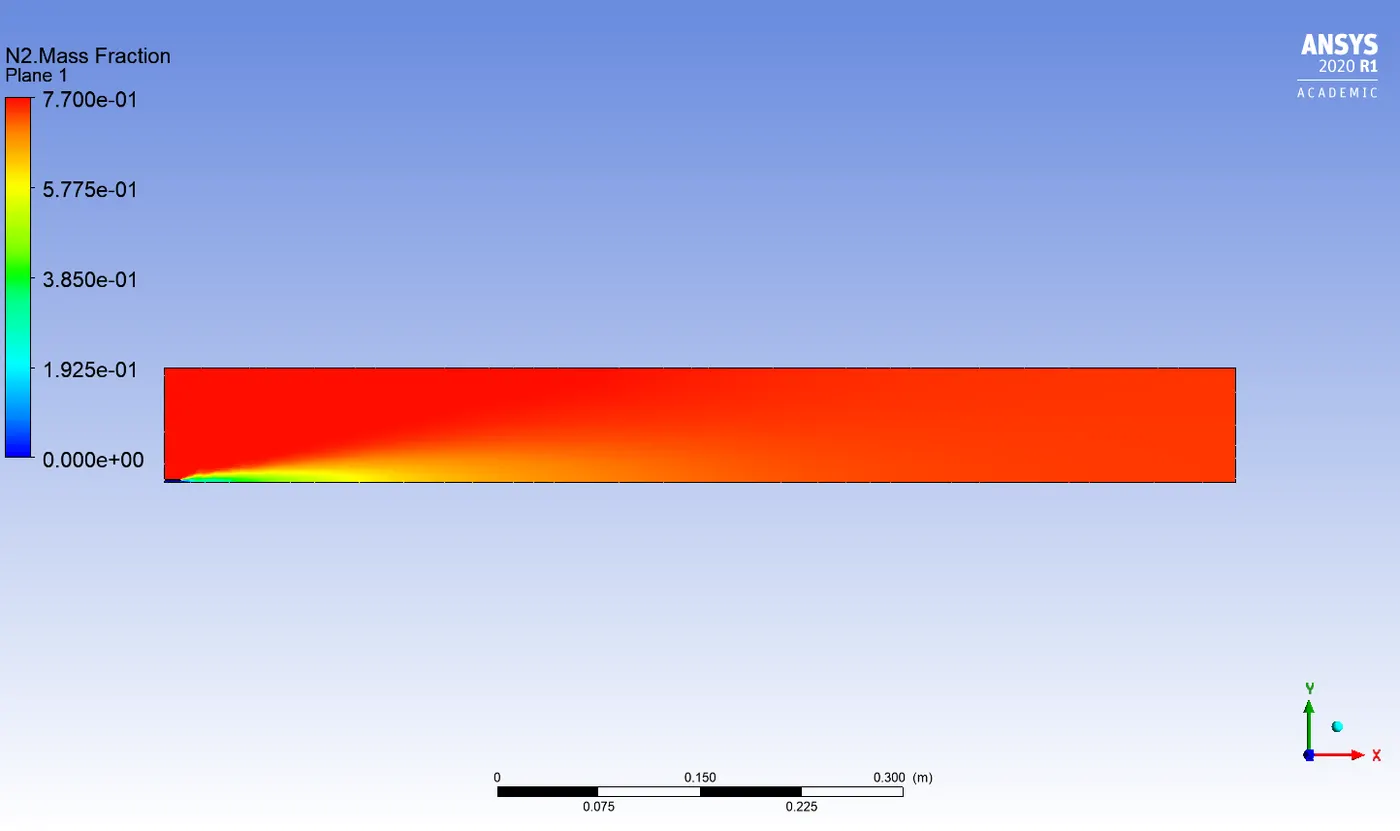
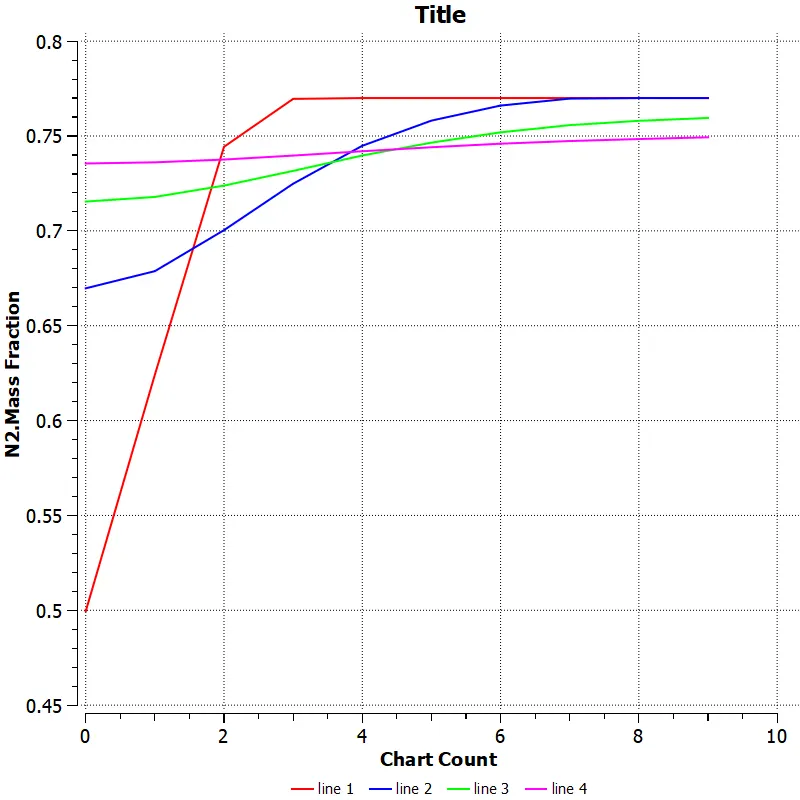
N2 mass fraction
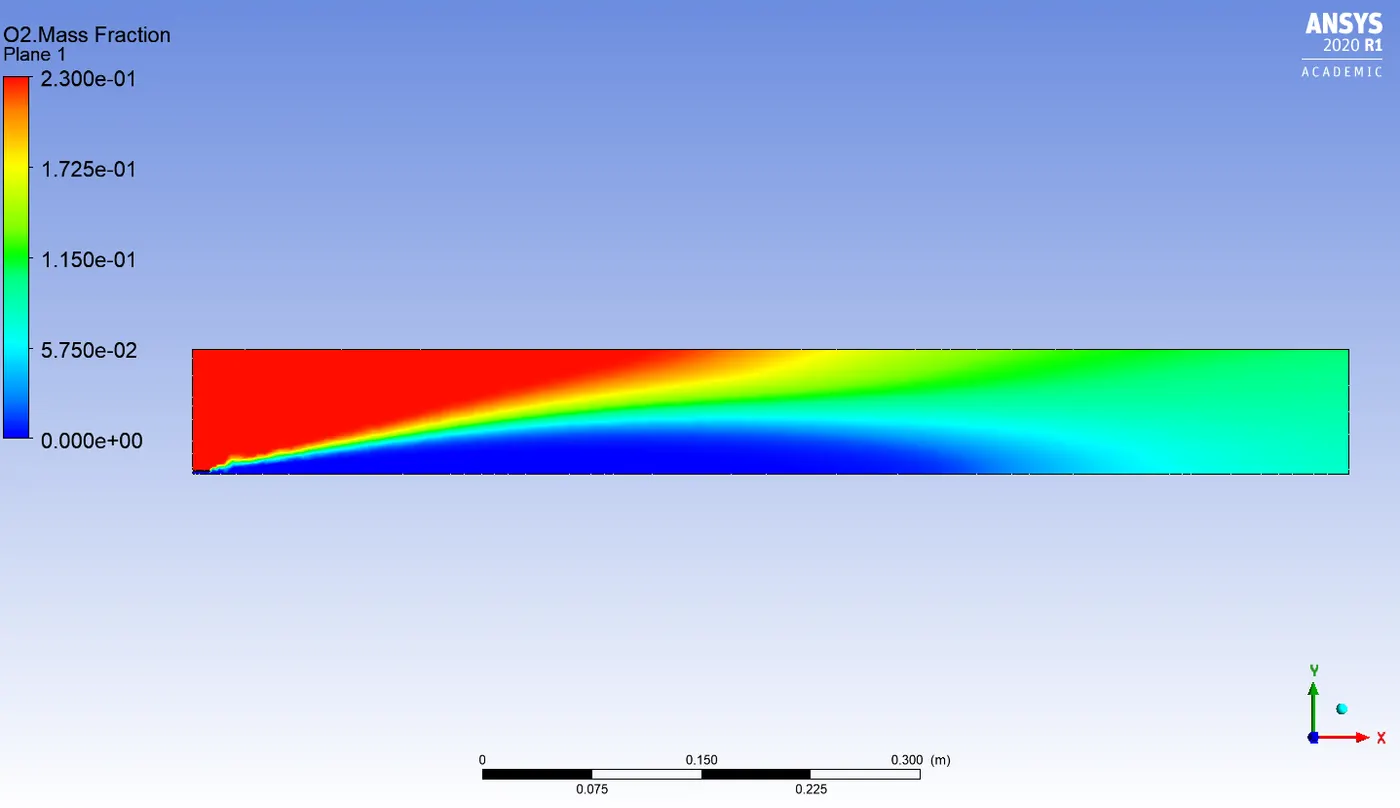
O2 mass fraction
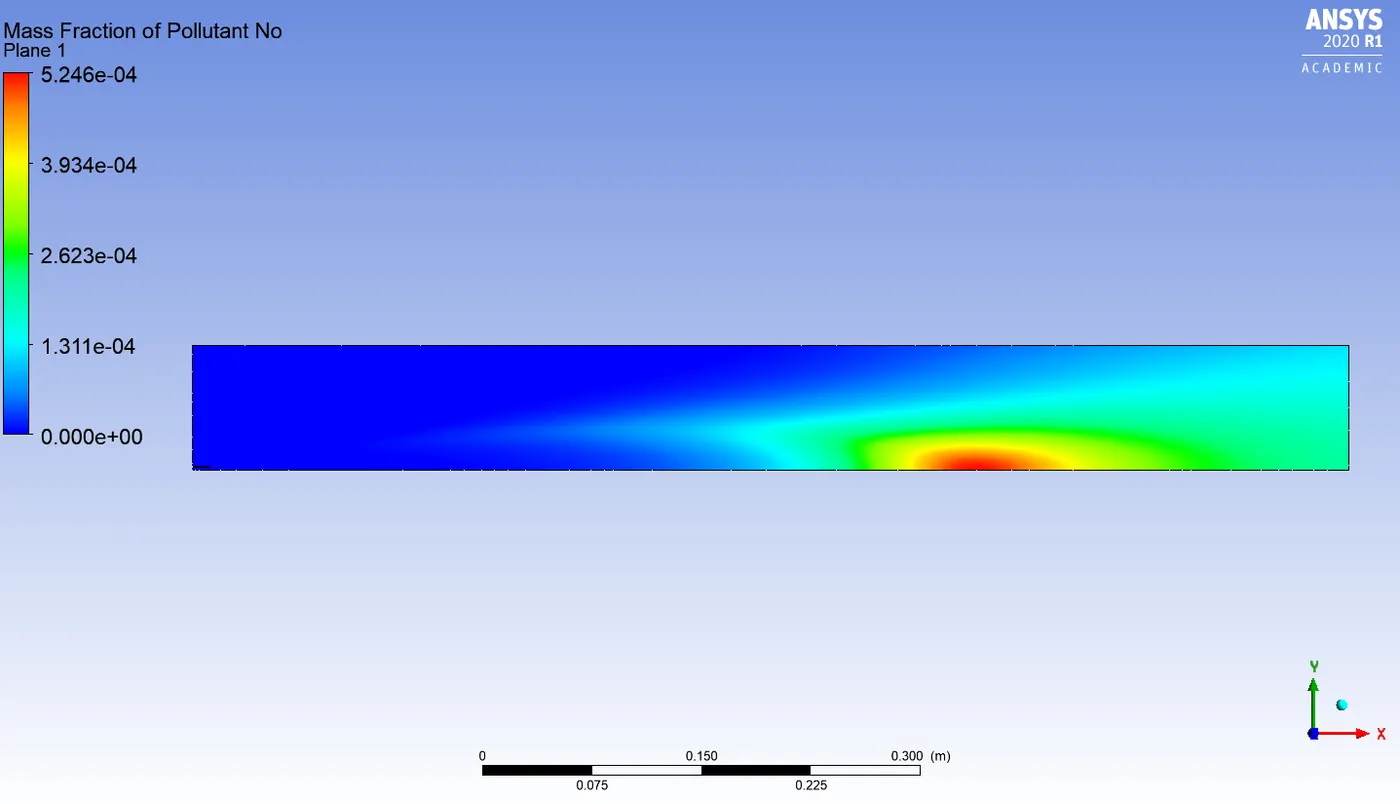
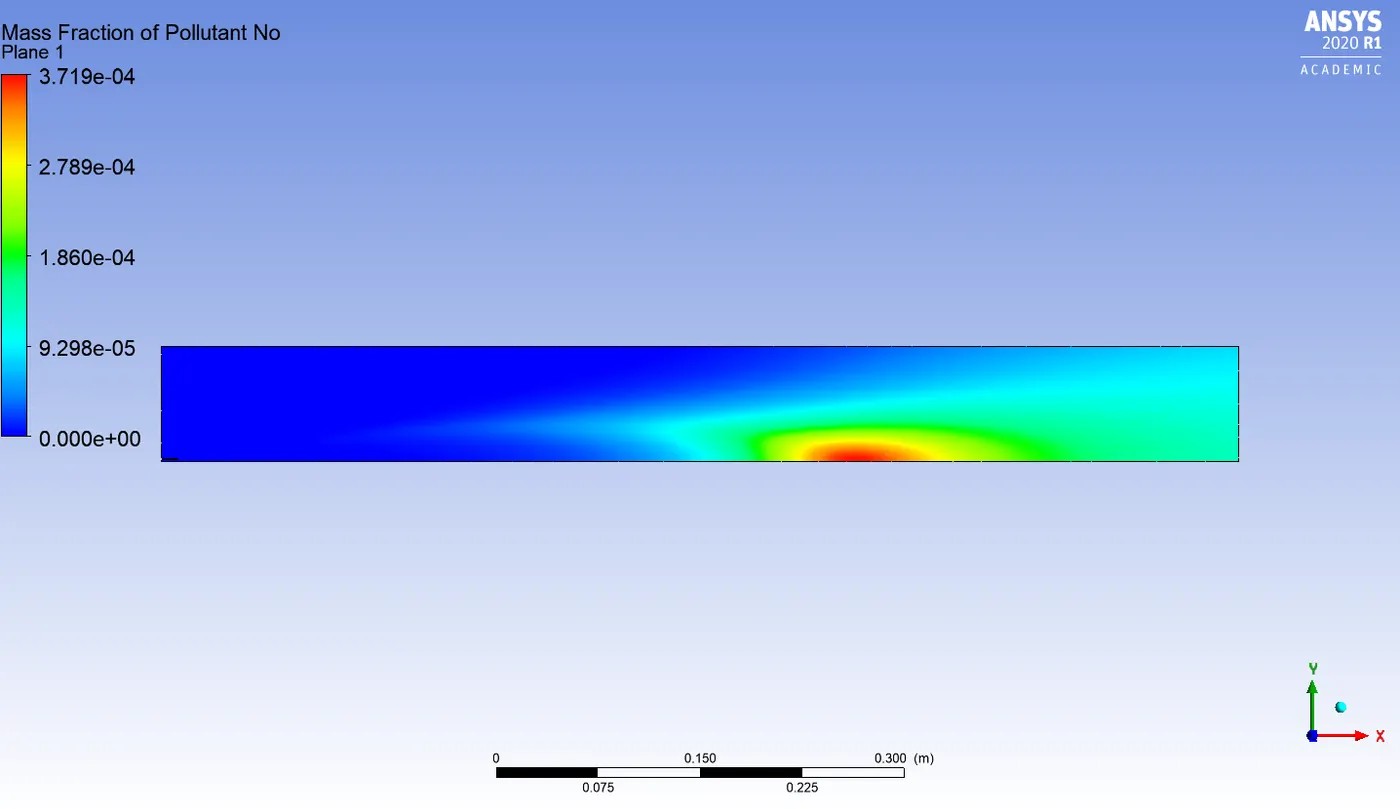
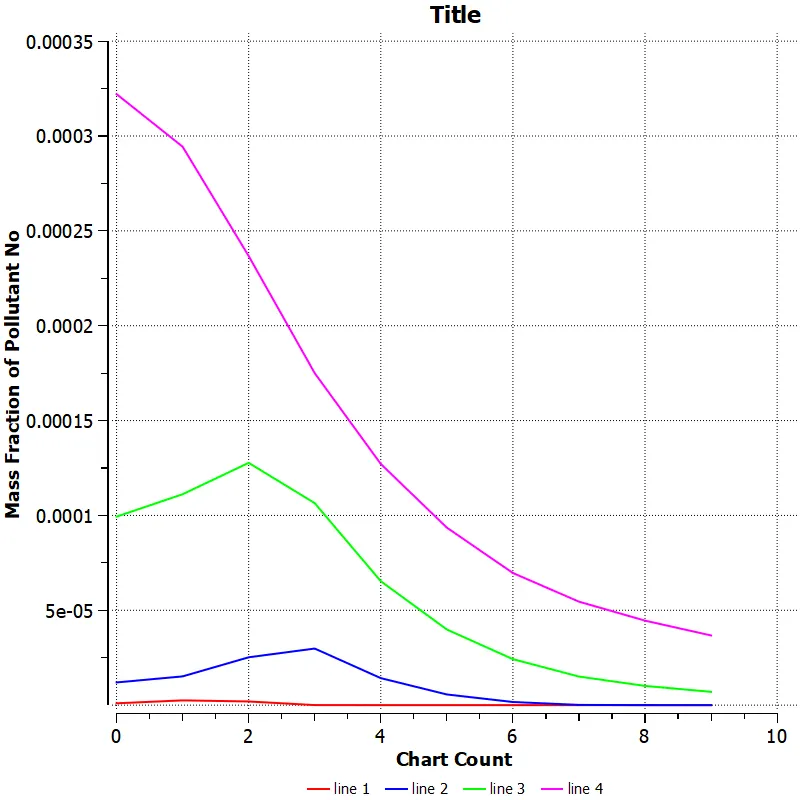
Pollutant NOx mass fraction
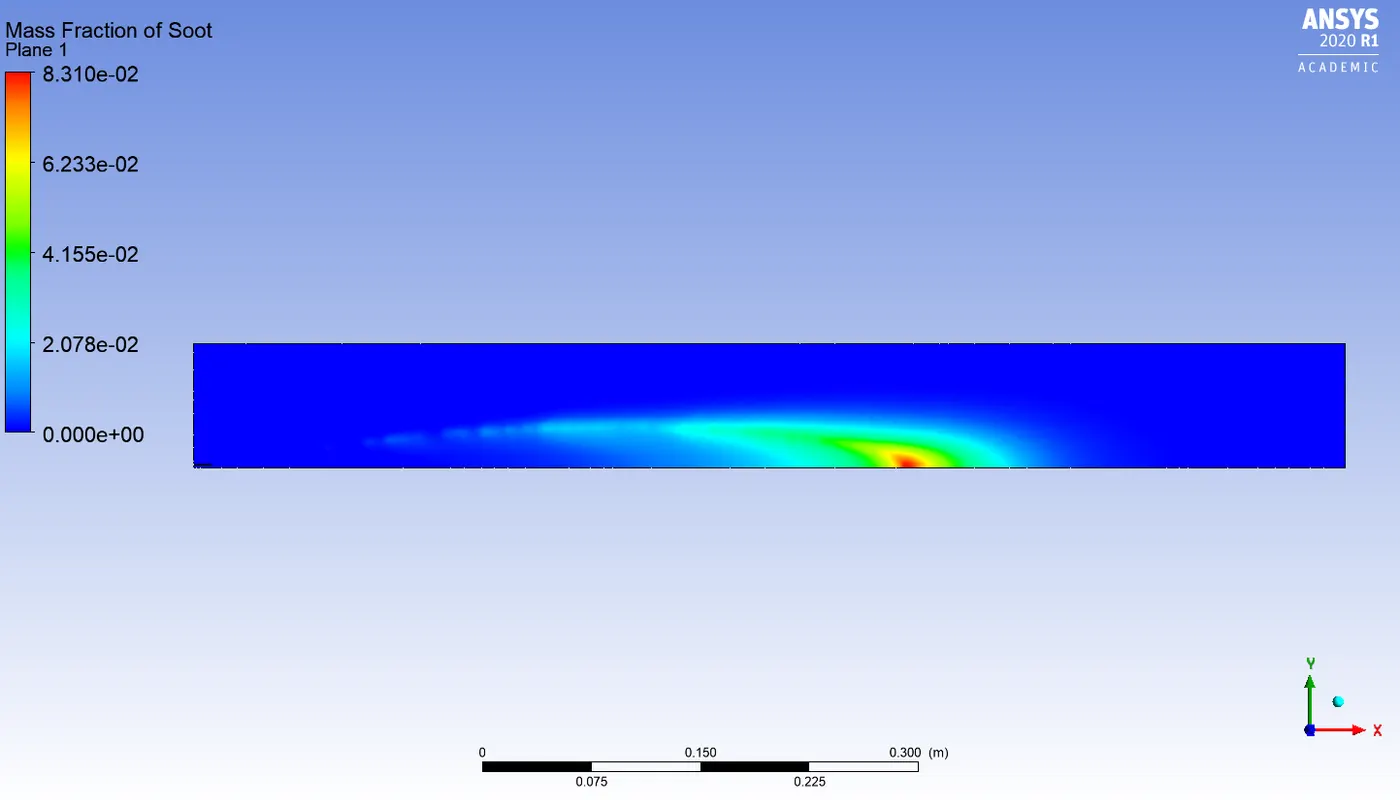
Pollutant soot mass fraction
Observations from part 1 simulation
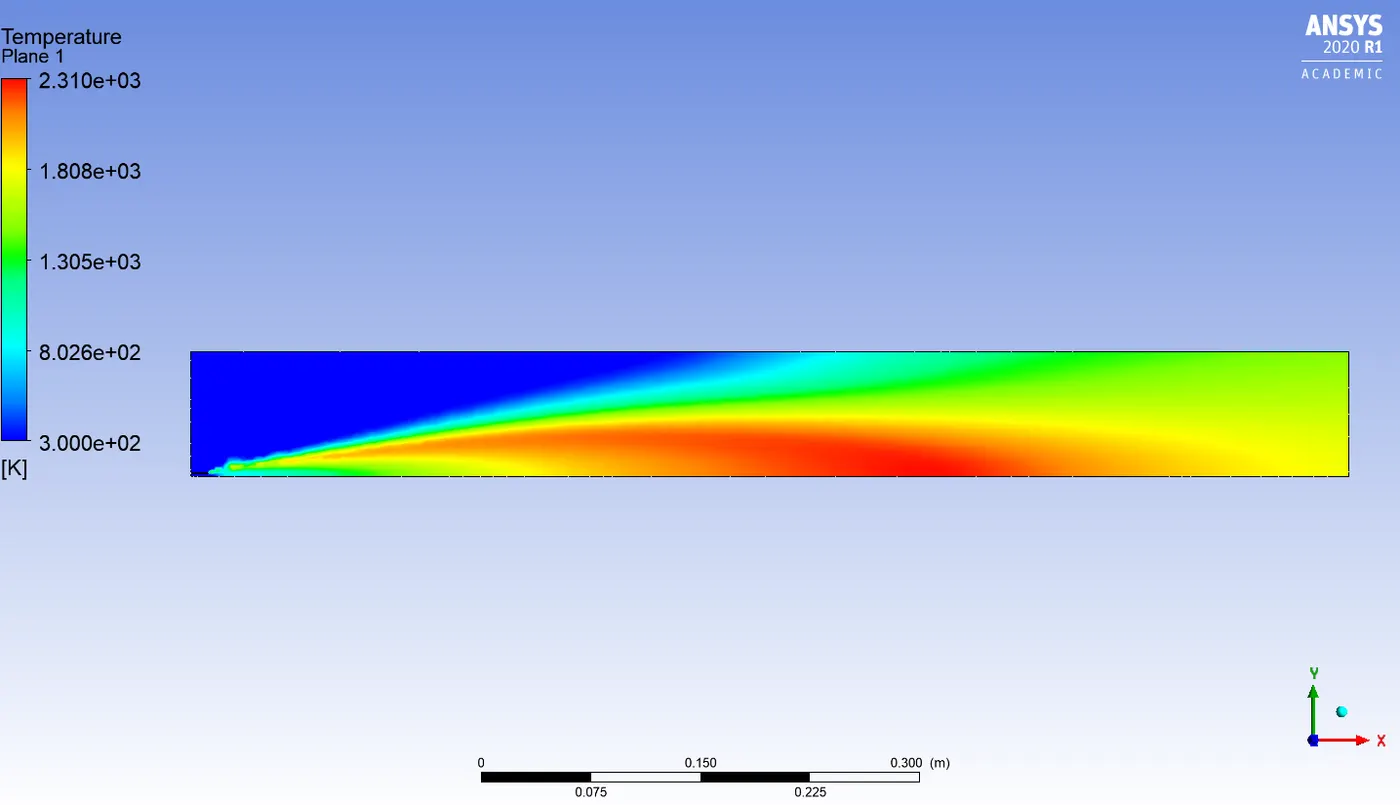
1. In the temperature contour, it can be seen that the highest temperature is observed ahead of the inlet of combustor where the mixing of fuel-air mixtures takes place.
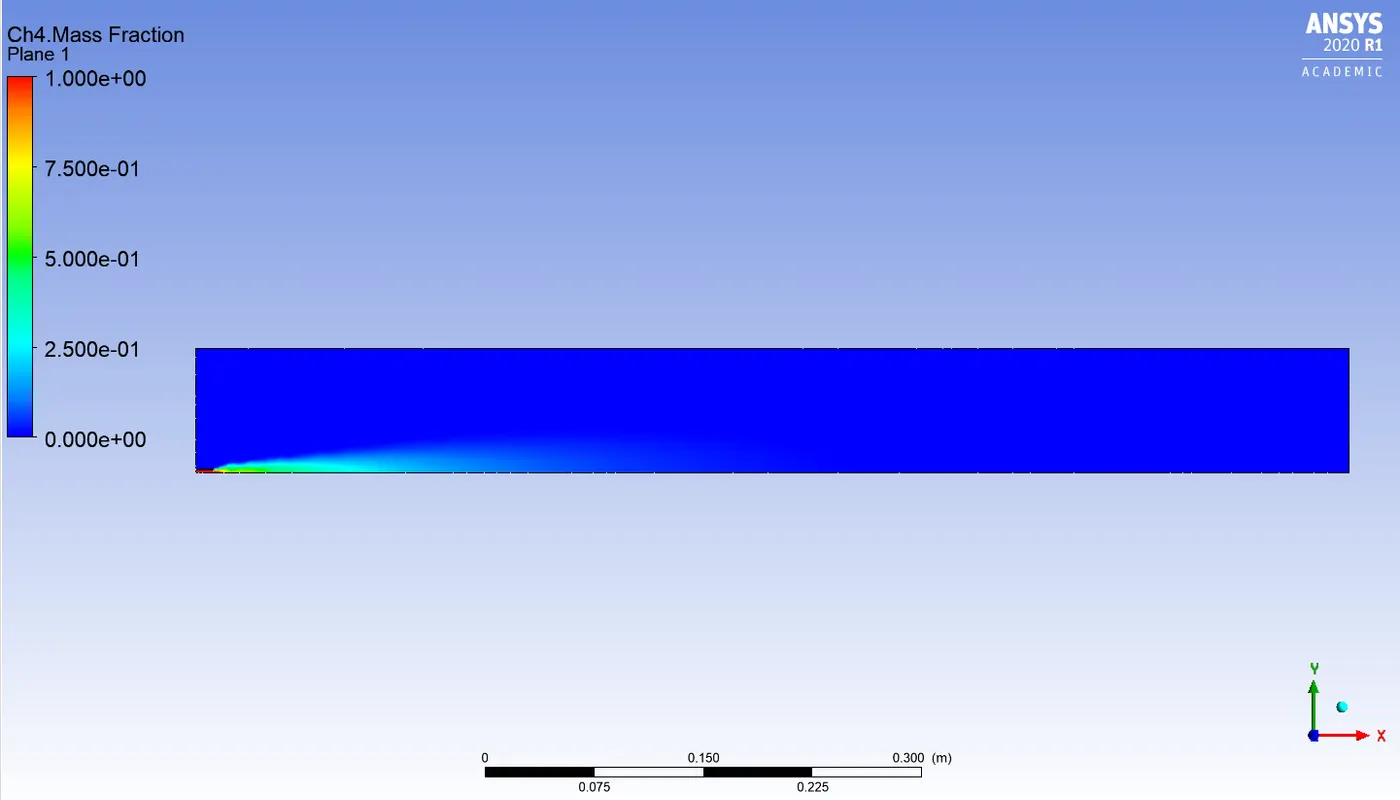
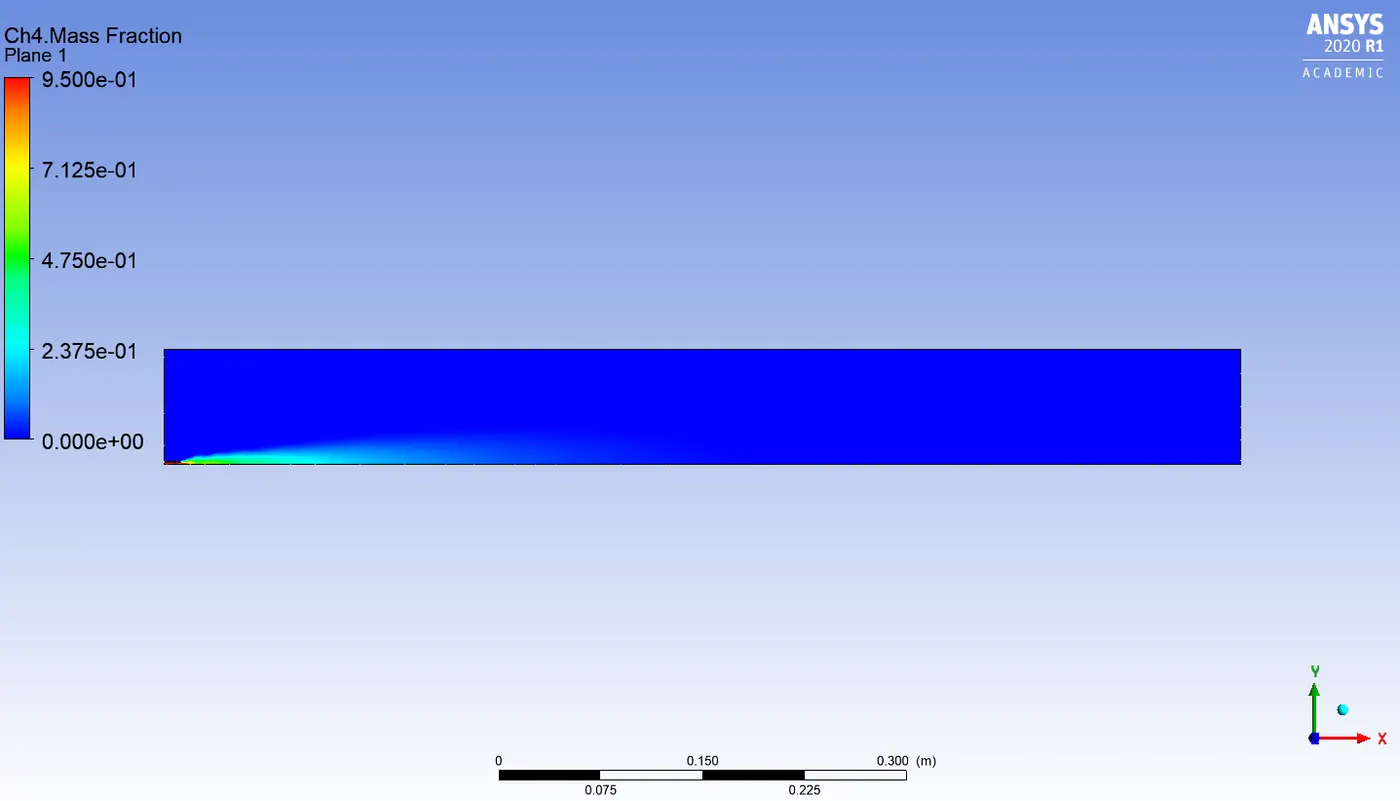
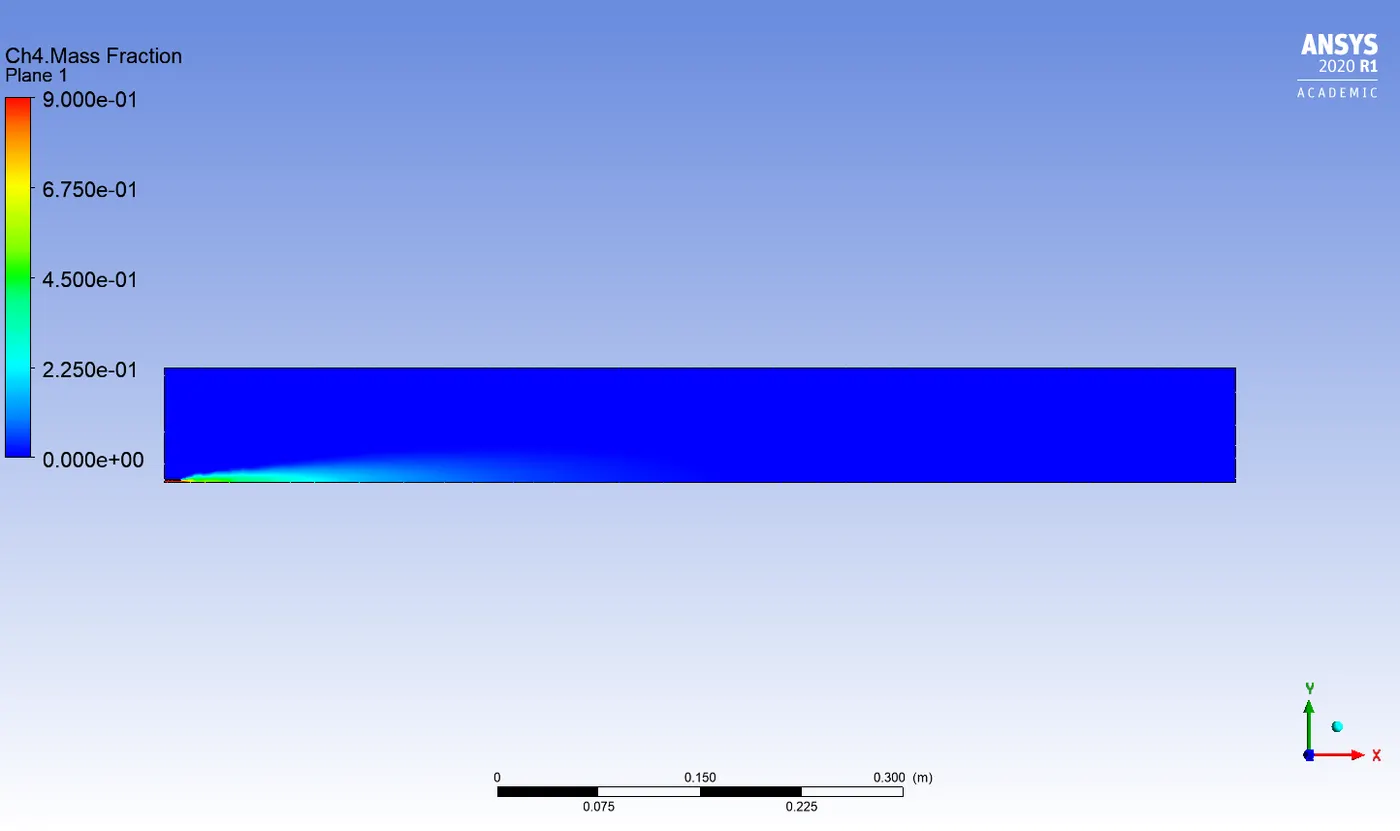
2. In the Ch4 mass fraction contour, the highest mass fraction of Ch4 is observed near the fuel inlet where the fuel is discharged and as combustion takes place Ch4 mass fraction decreases.
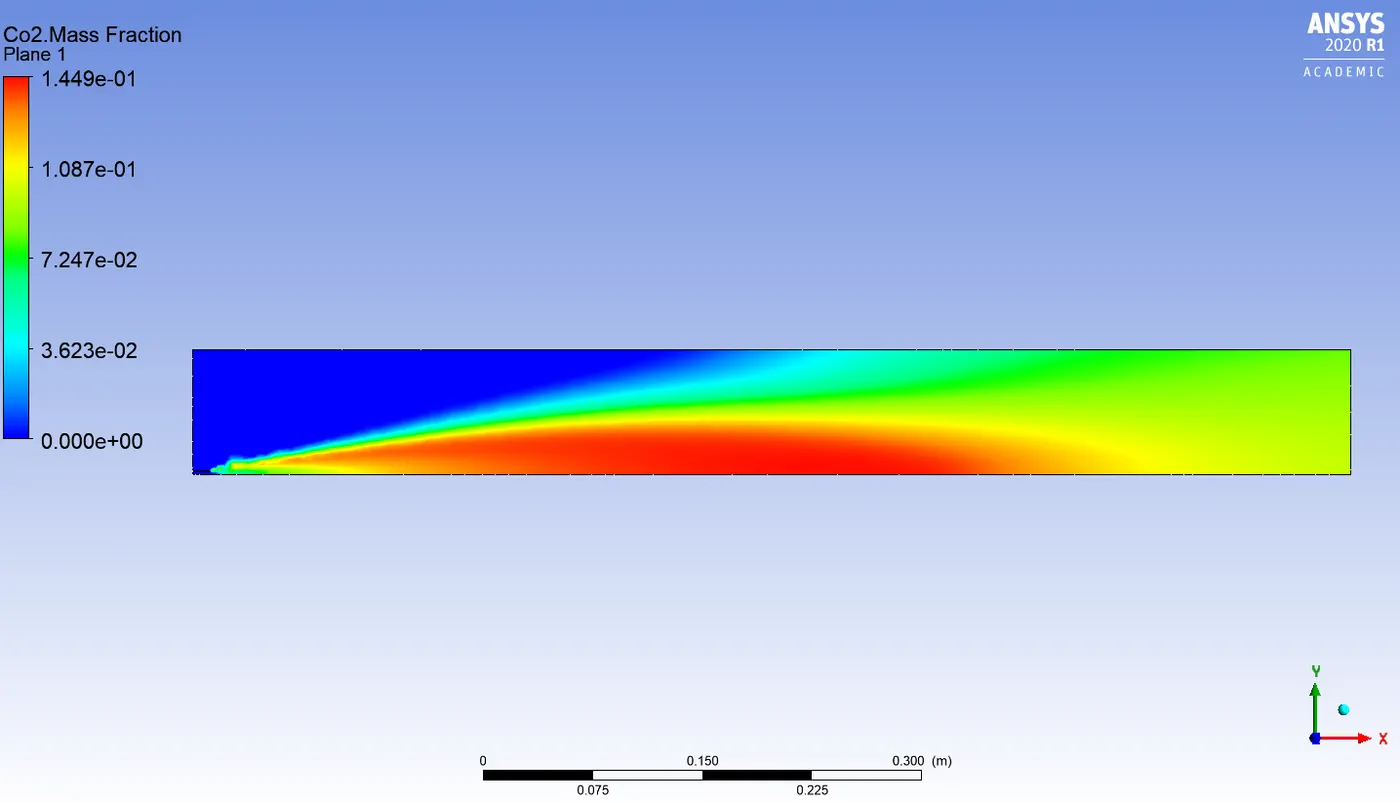
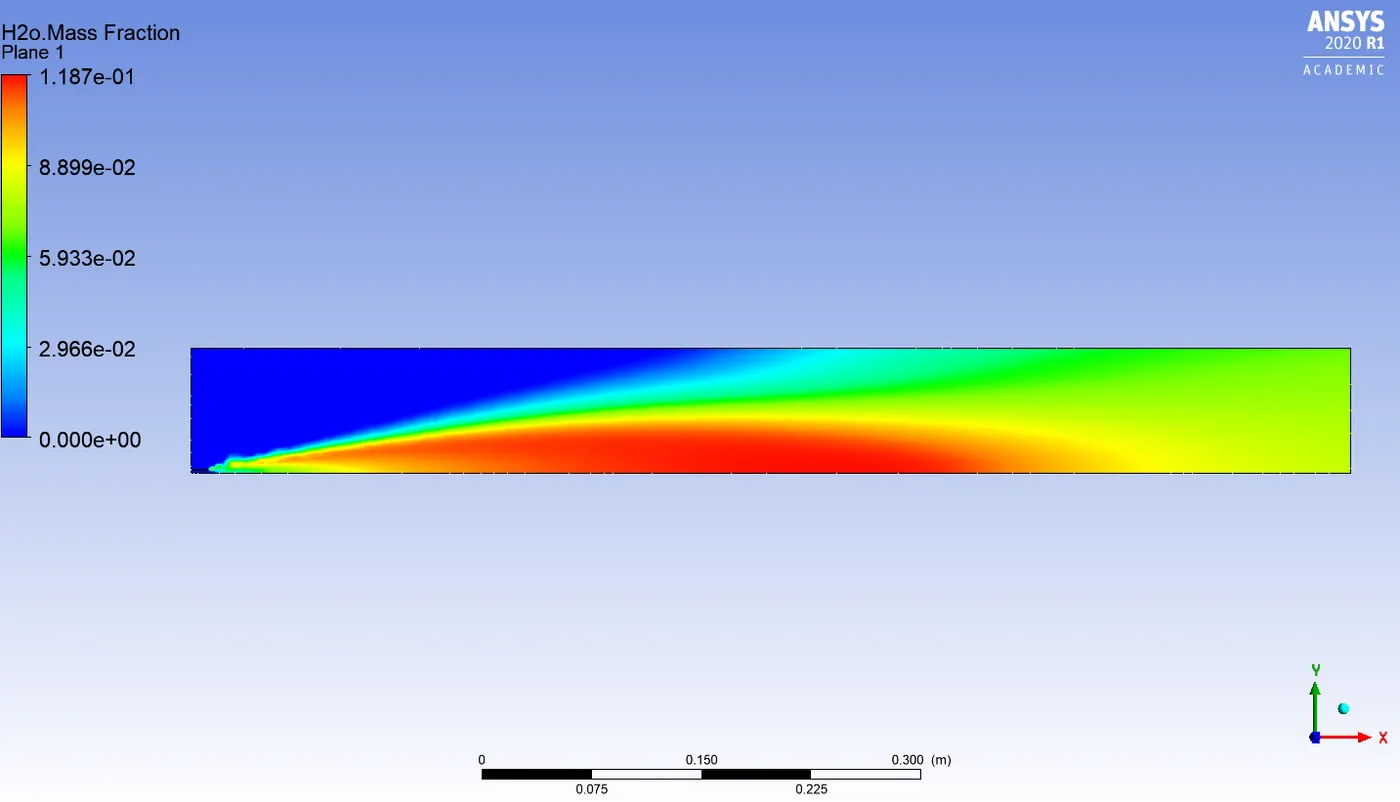
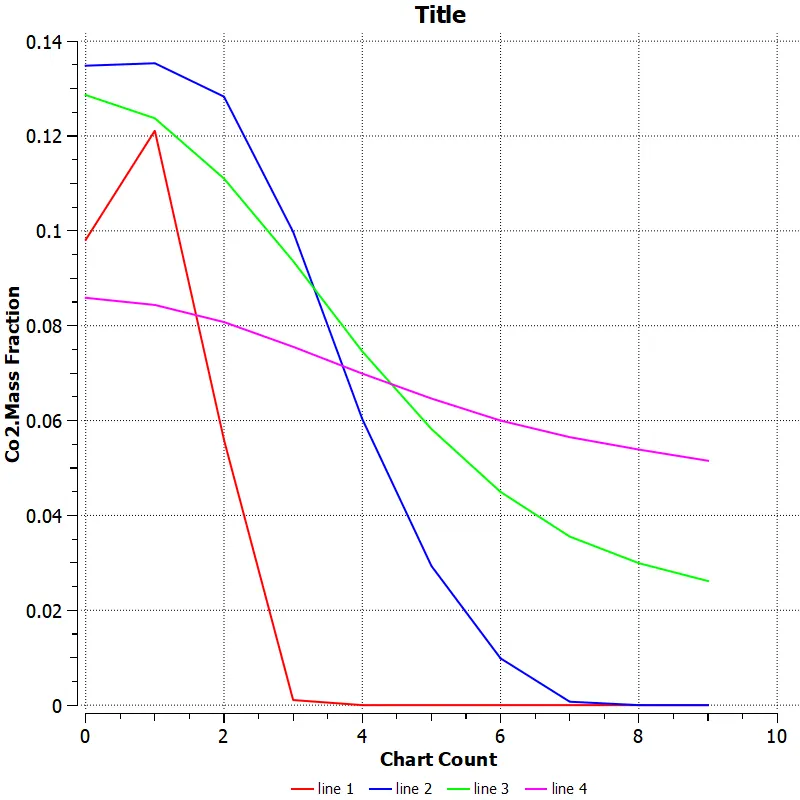
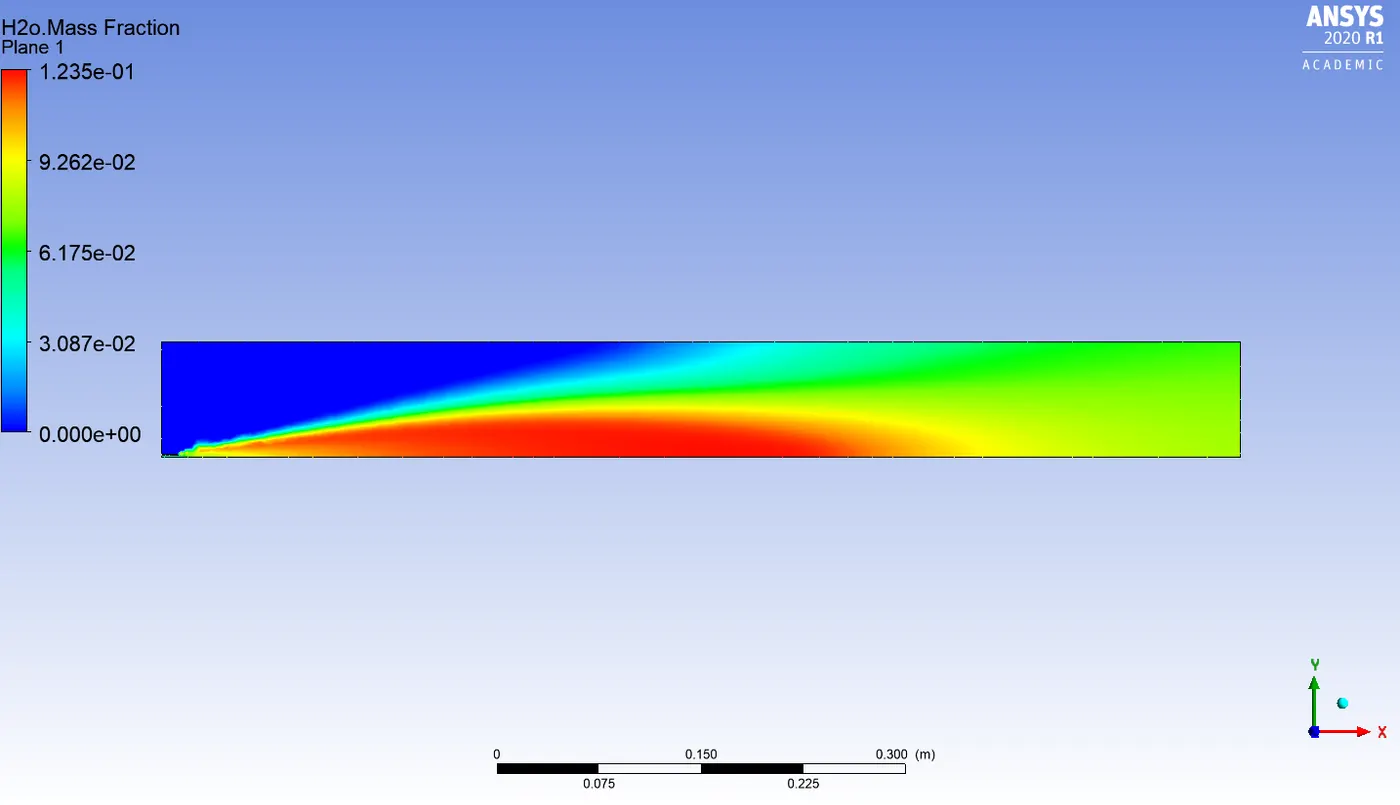
3. Highest mass fraction of Co2 and H2o is observed in the high temperature zone.
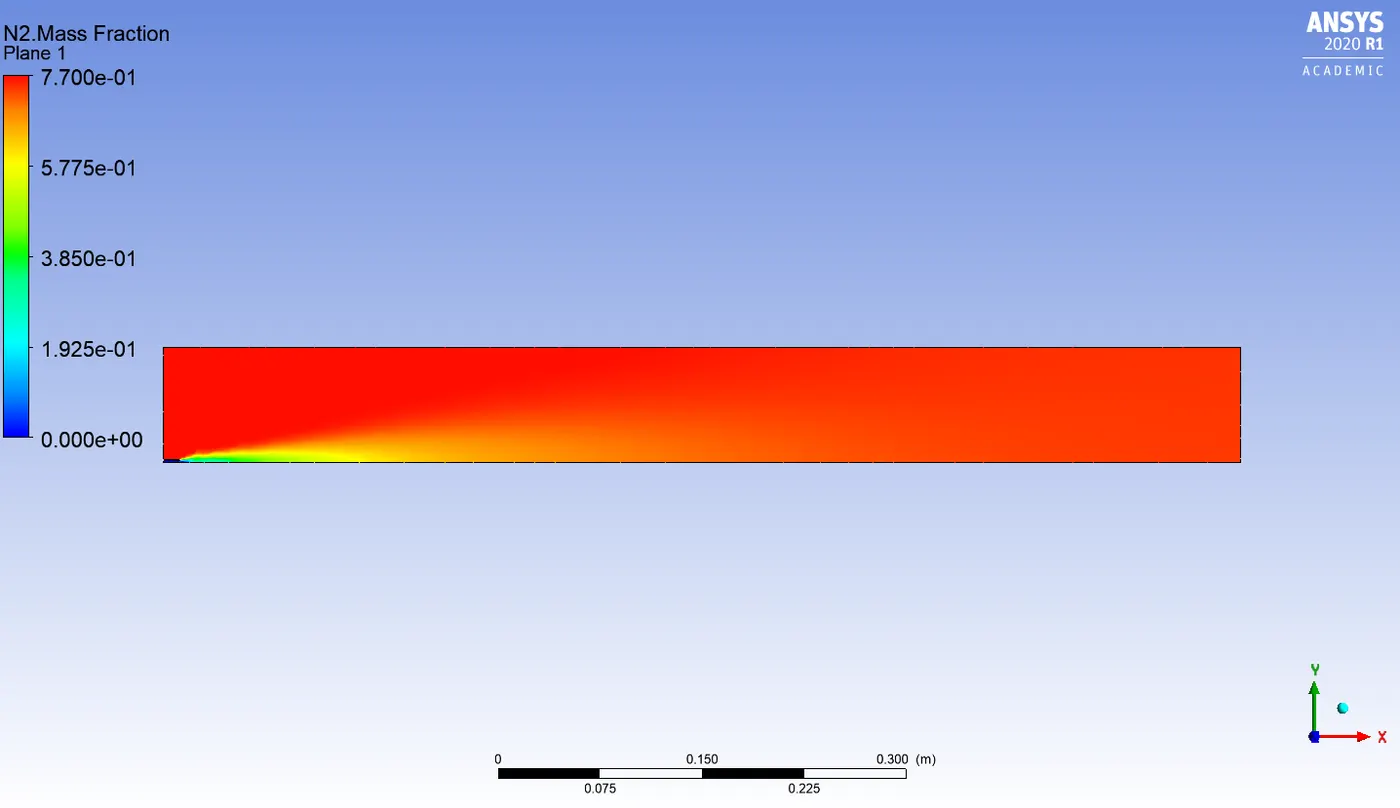
4. From the N2 mass fraction contour, it can be seen that the N2 is almost distributed uniformly across the combustor.
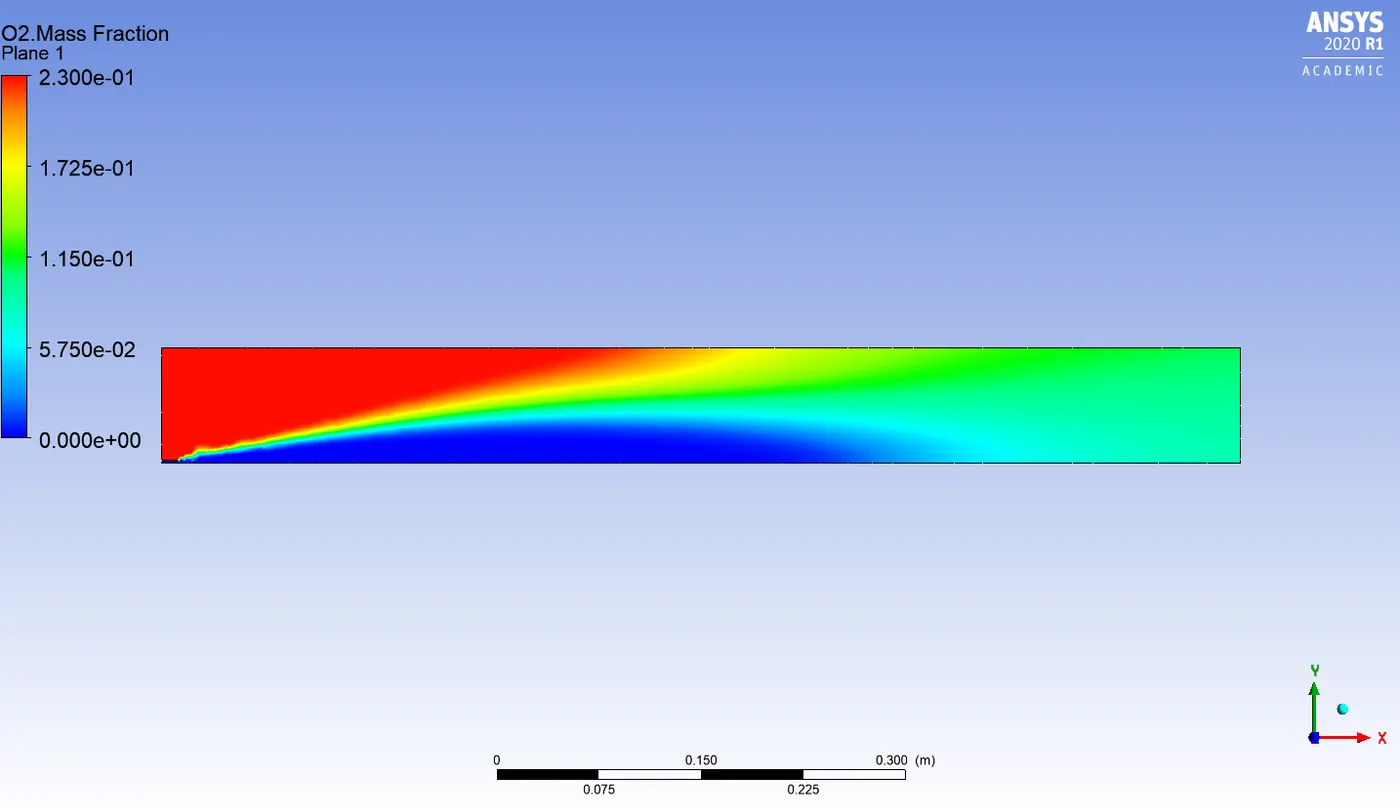
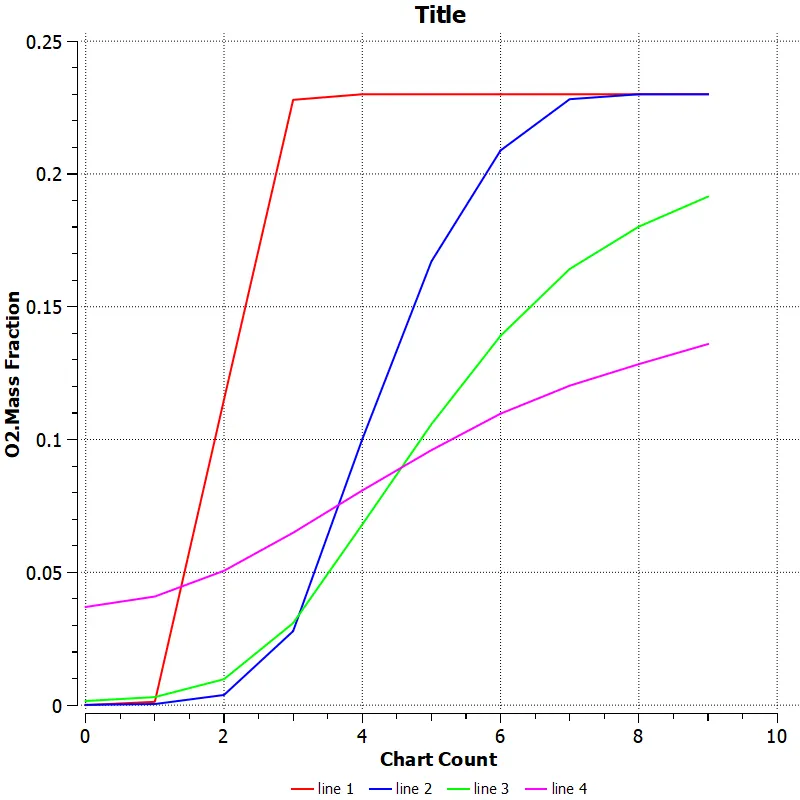
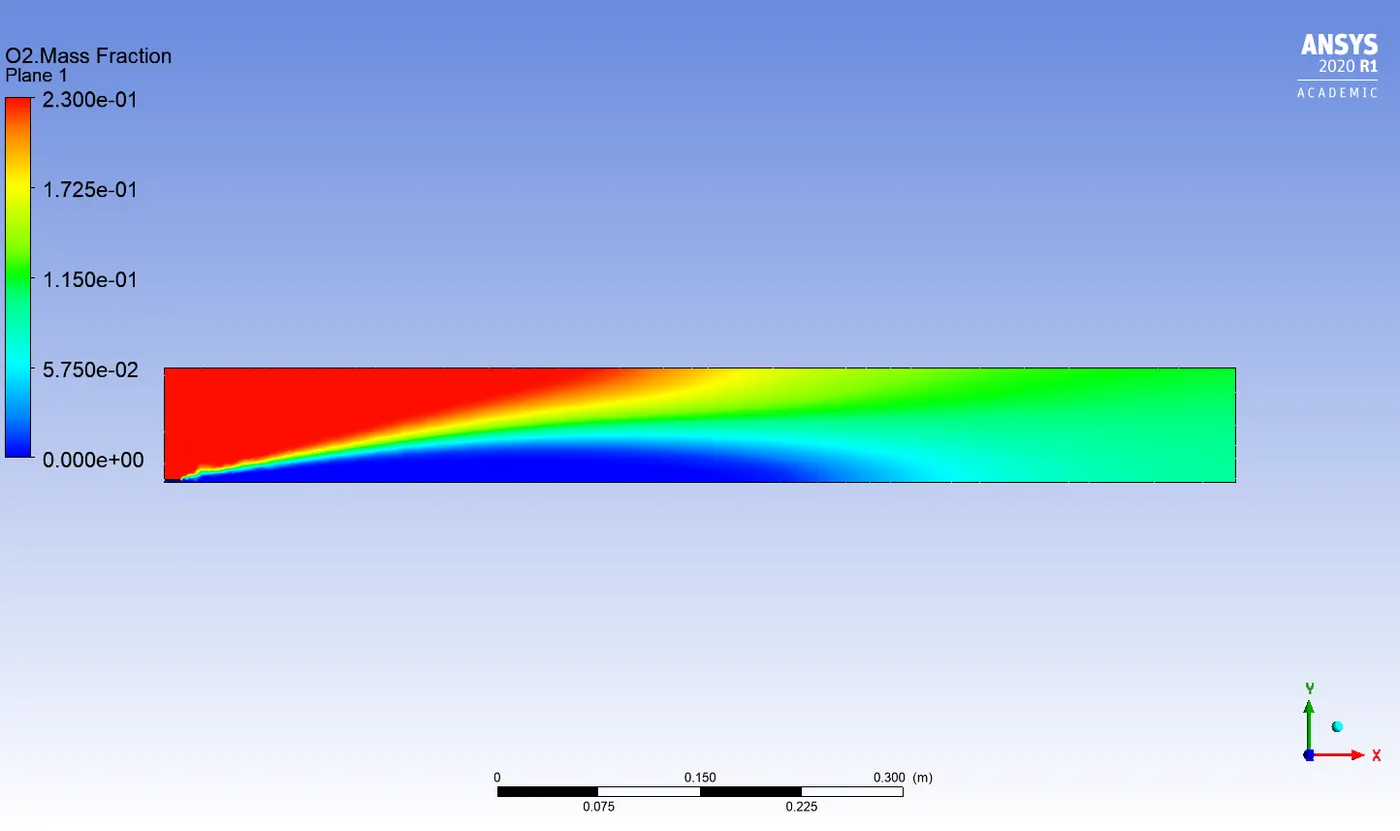
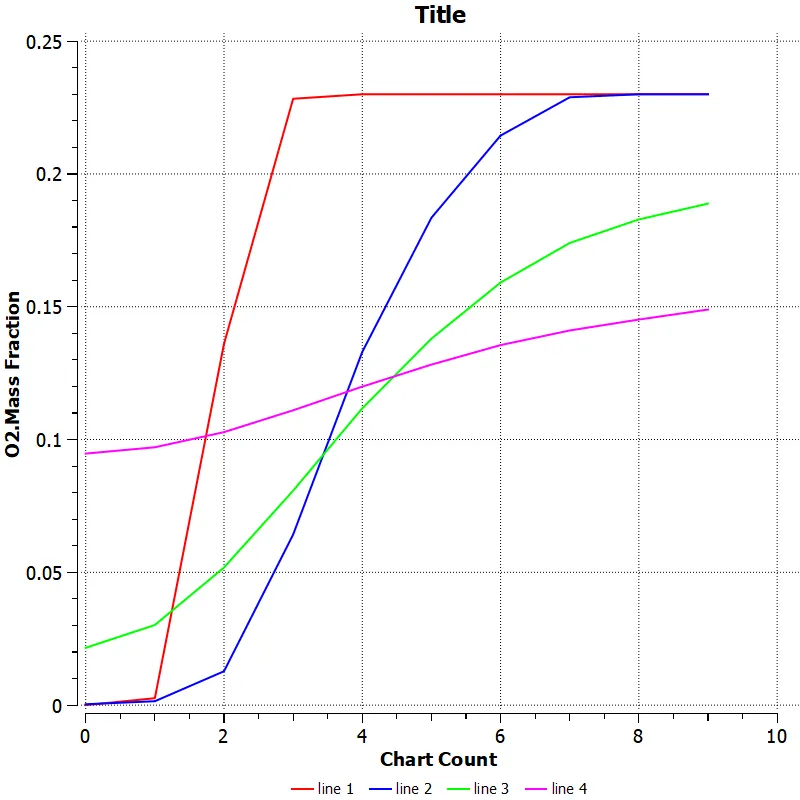
5. The oxygen mass fraction is highest near the air-inlet.
6. The pollutant like Nox and soot mass fraction is more near the outlet of the combustor.
Part 2
Boundary conditions
Air inlet
Velocity = 0.5 m/s
Temperature = 300 K
Species
Fuel inlet
Velocity = 80 m/s
Temperature = 300 K
Species
Top surface
Boundary type = wall
Axis
x-axis = axisymmetric
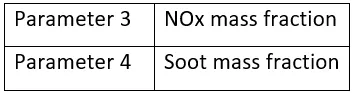
Output parameters
Results of part 2
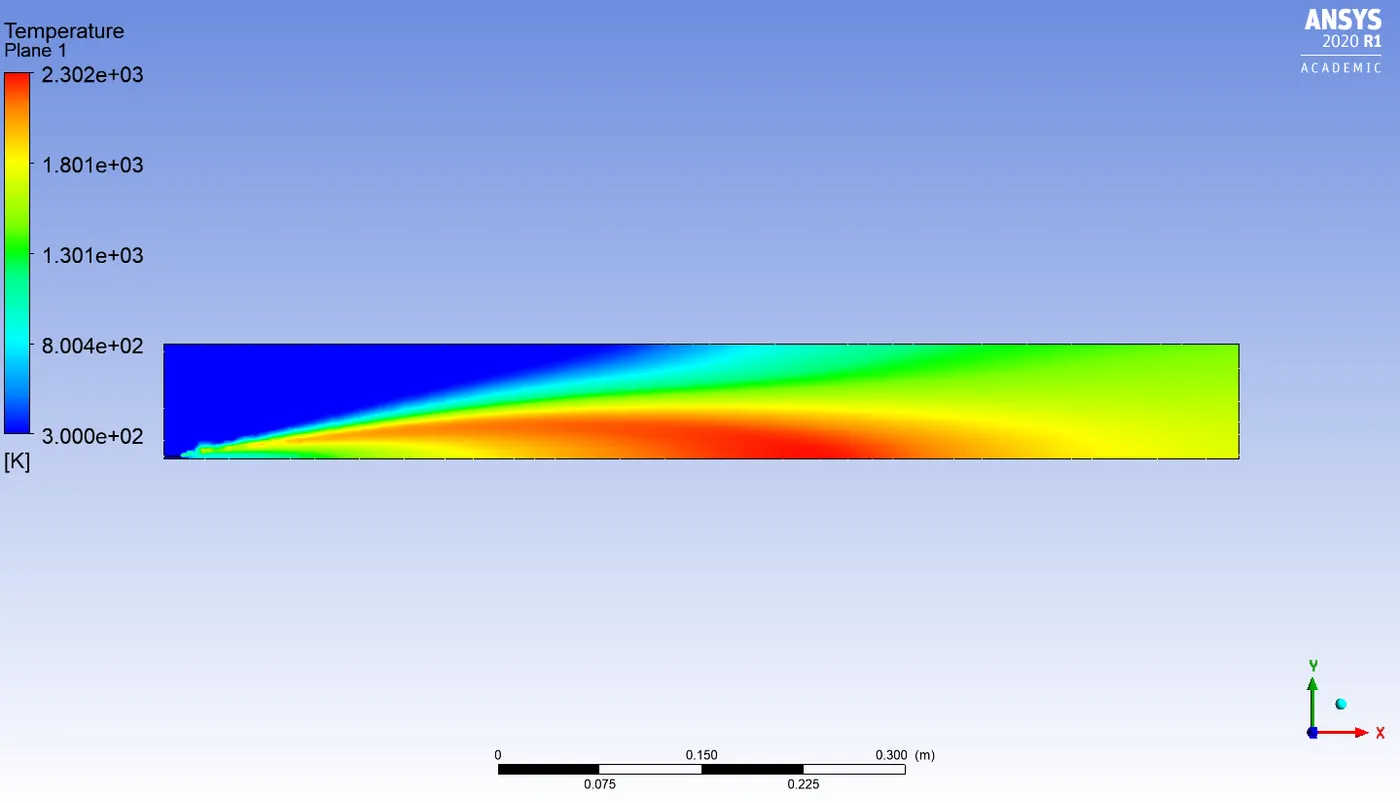
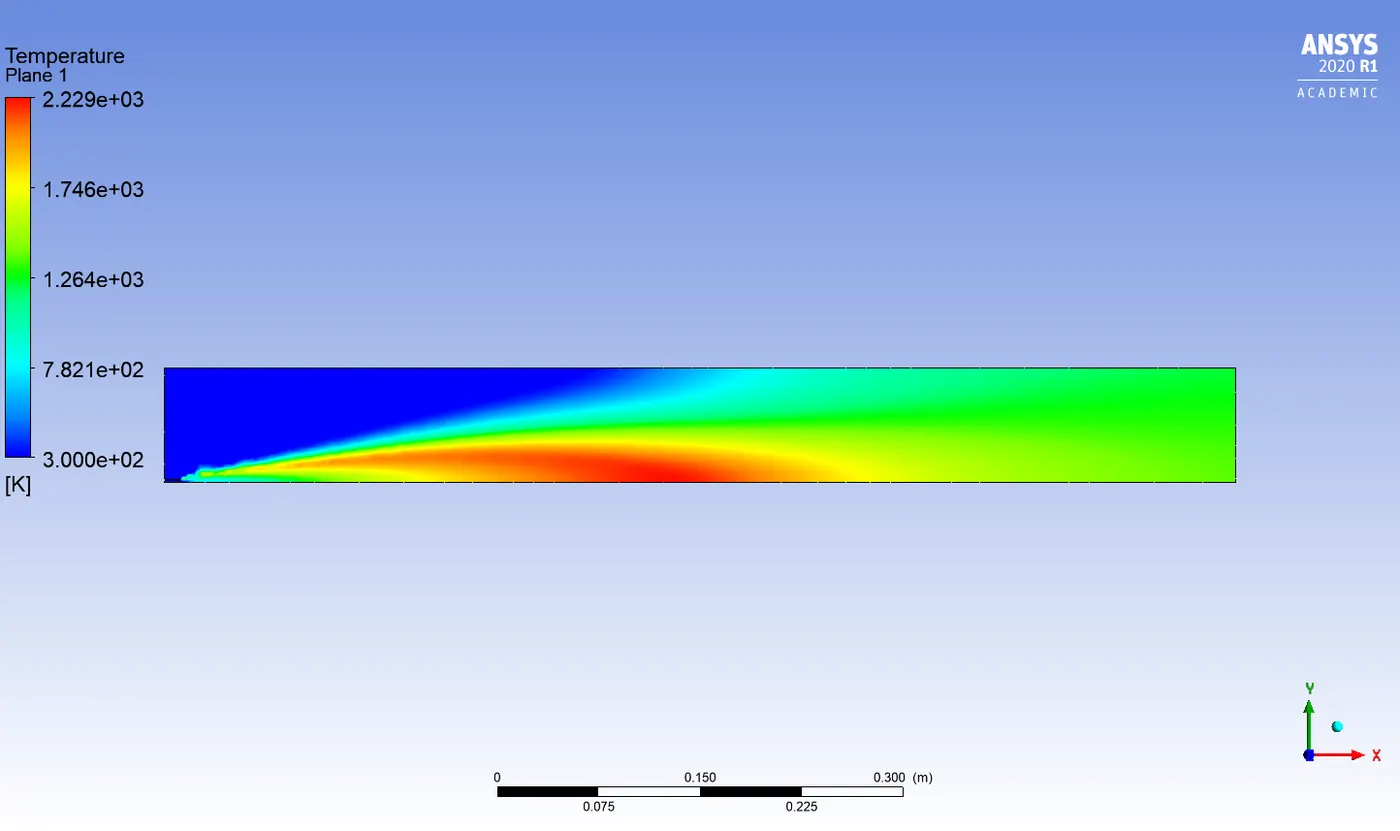
Temperature contour :
5% water content in fuel
10% water content in fuel
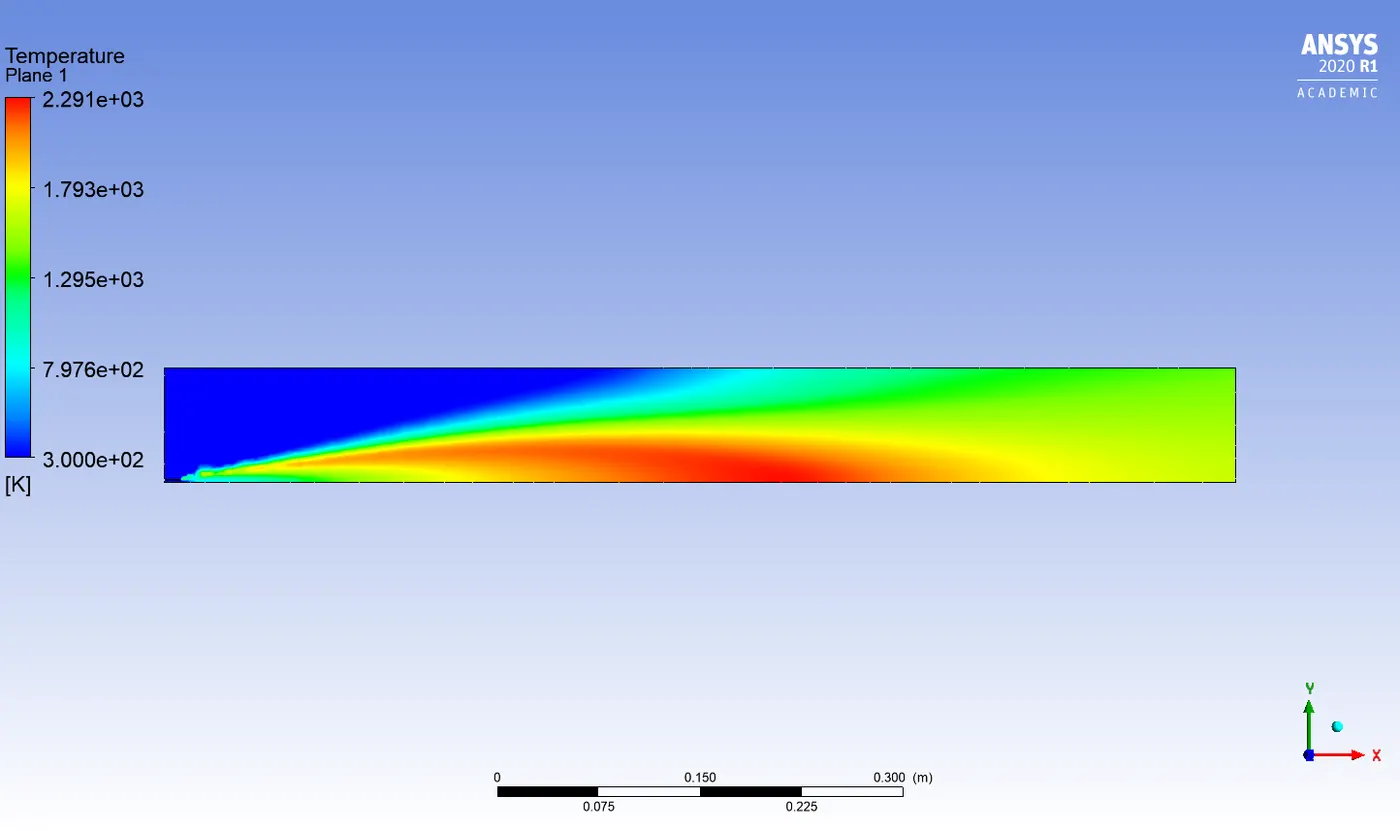
15% water content in fuel
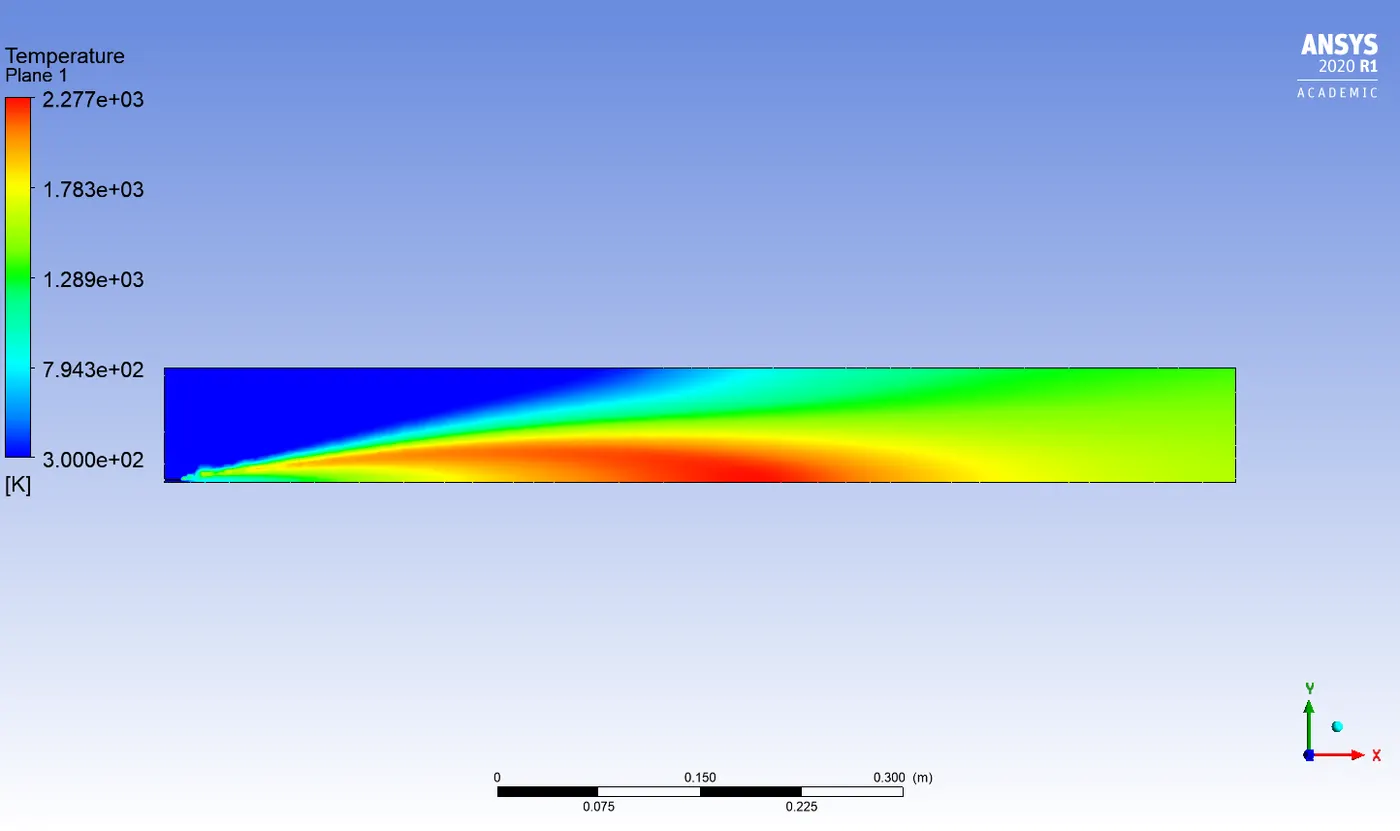
20% water content in fuel
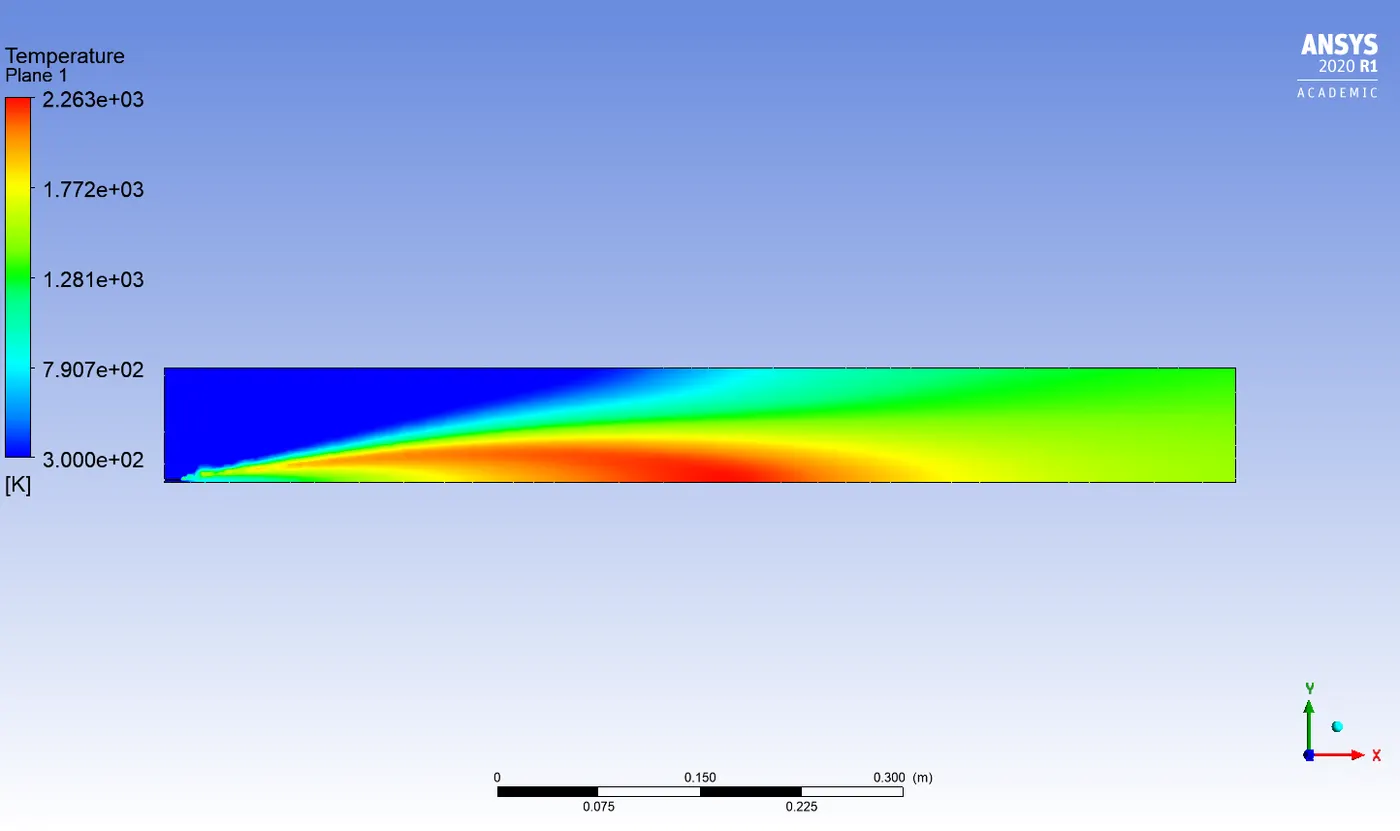
25% water content in fuel
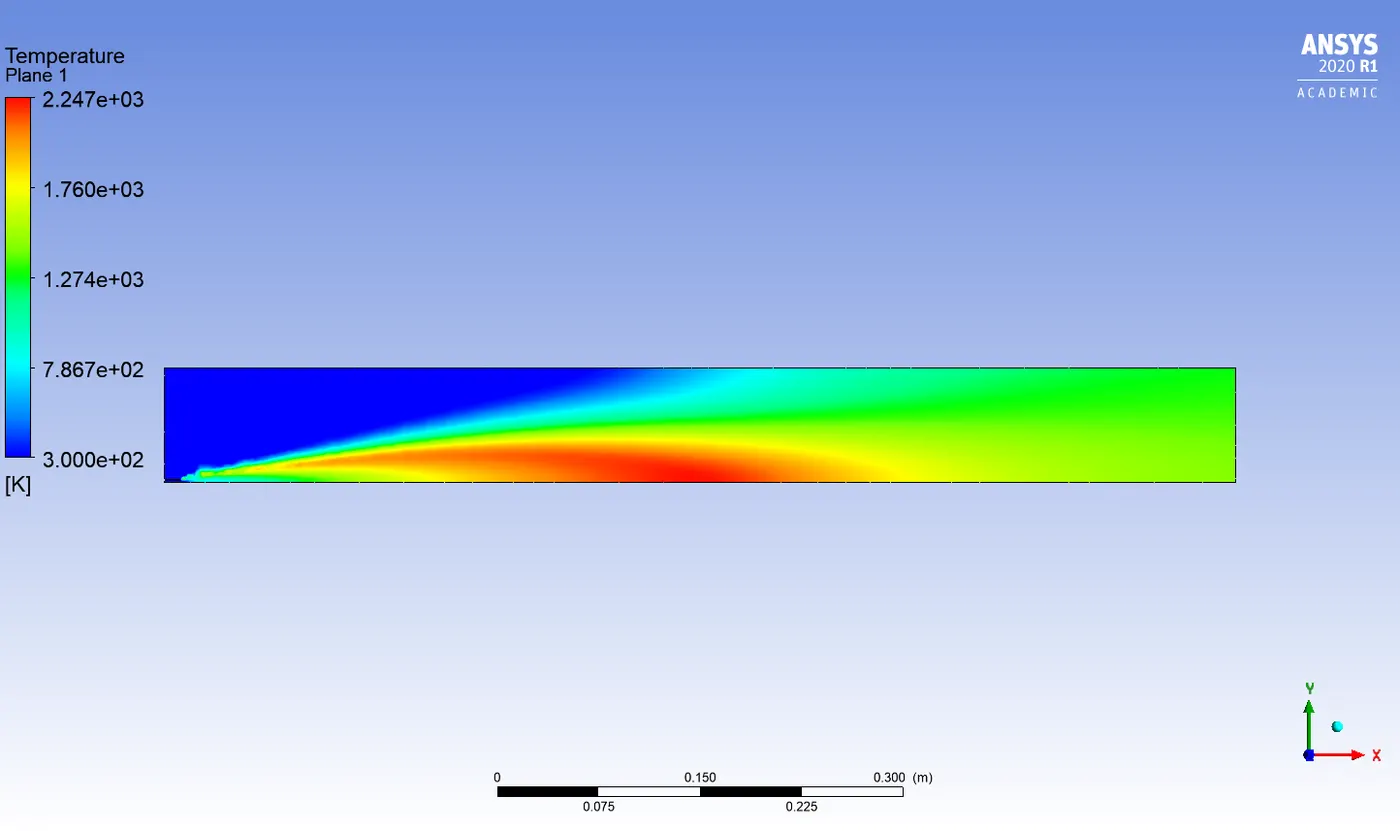
30% water content in fuel
Ch4 mass fraction :
5% water content in fuel
10% water content in fuel
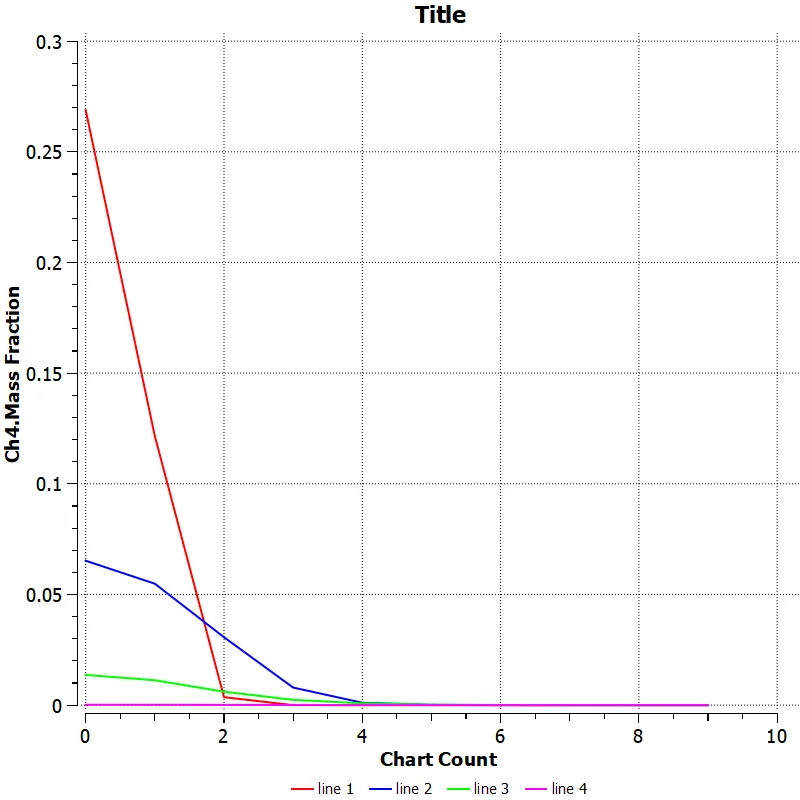
15% water content in fuel
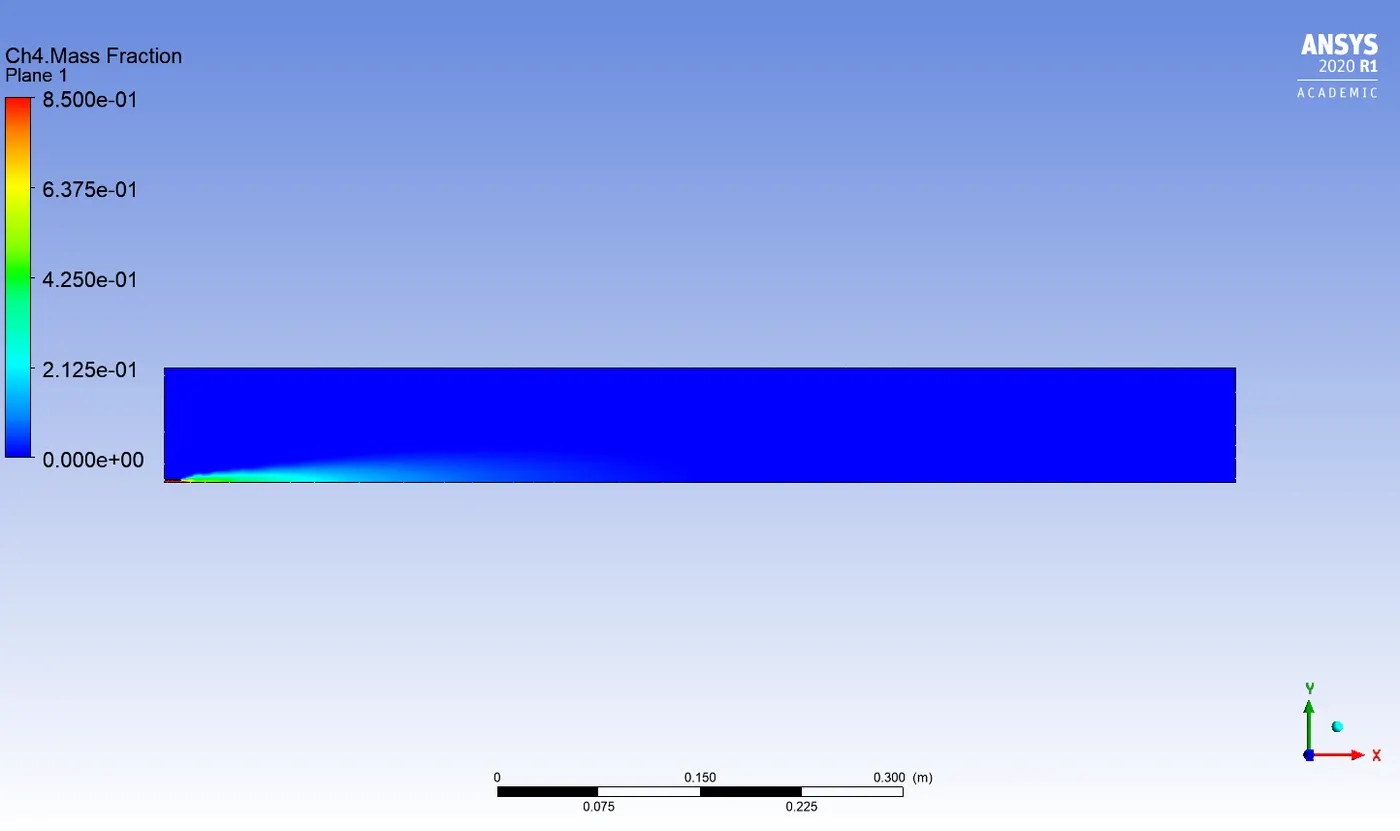
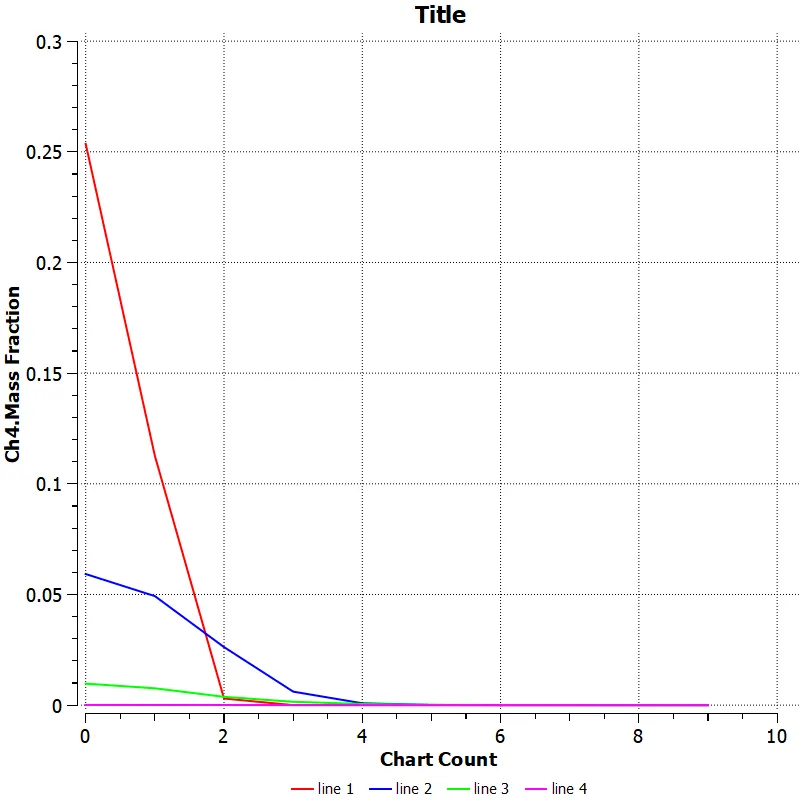
20% water content in fuel
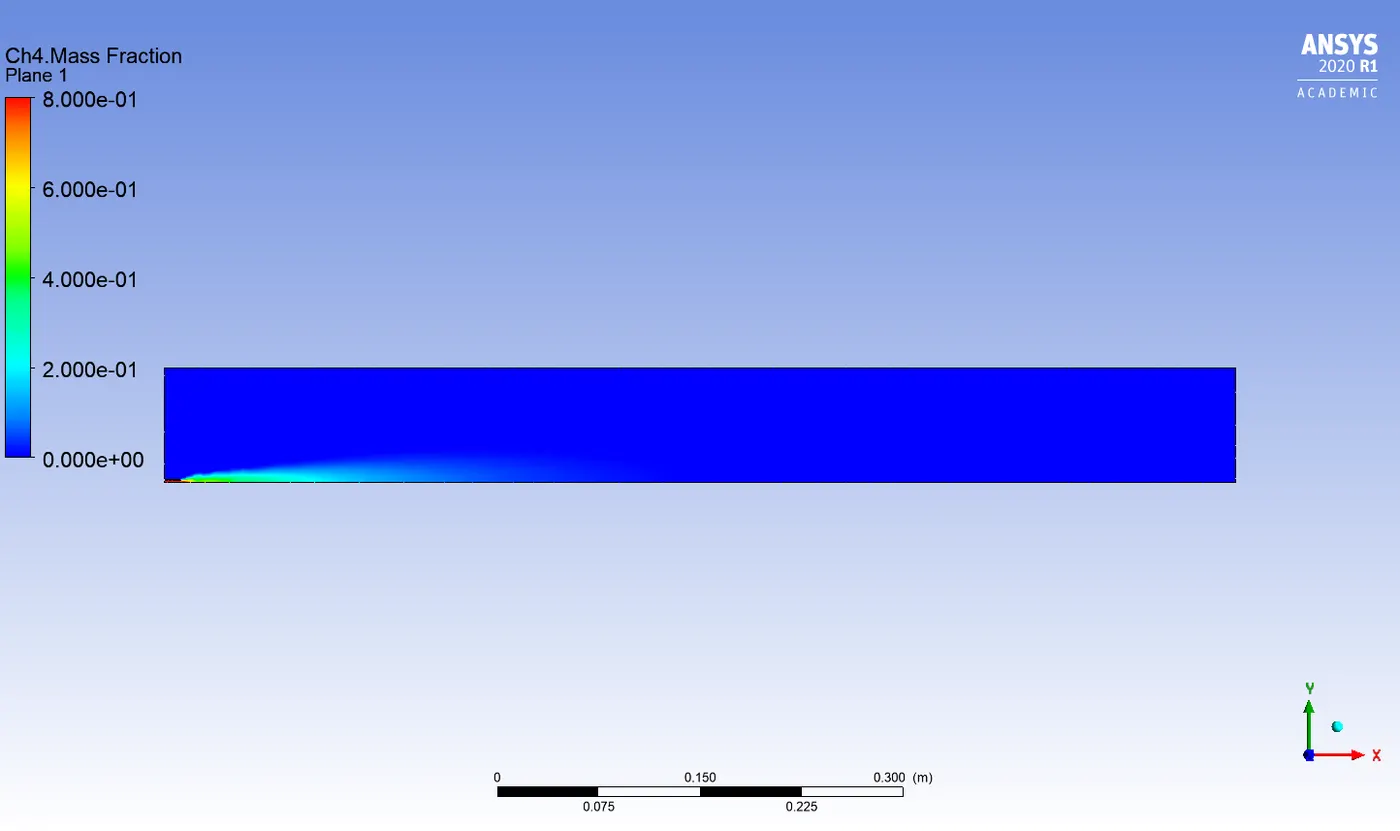
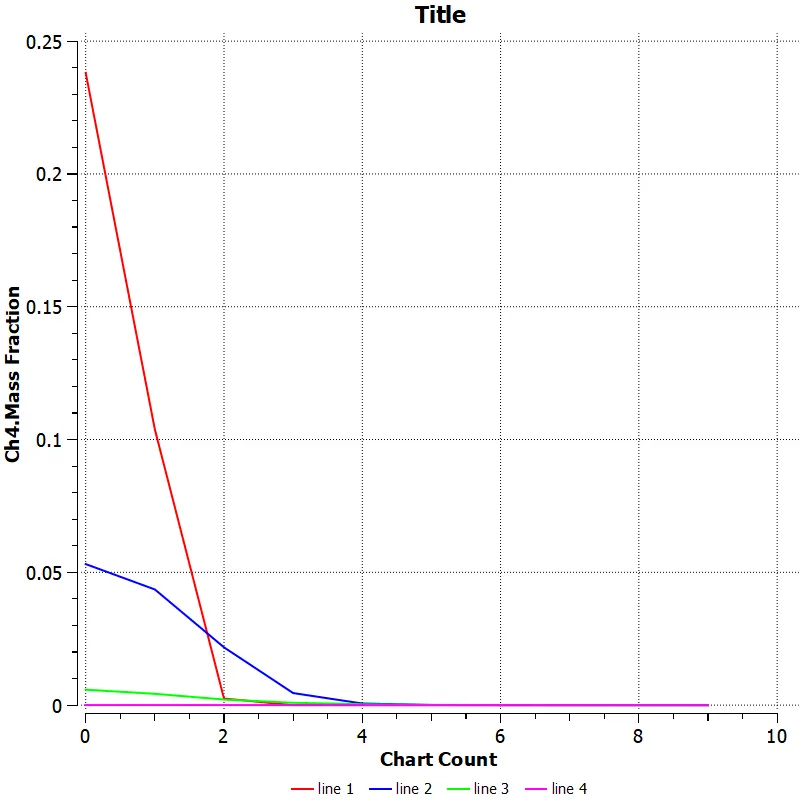
25% water content in fuel
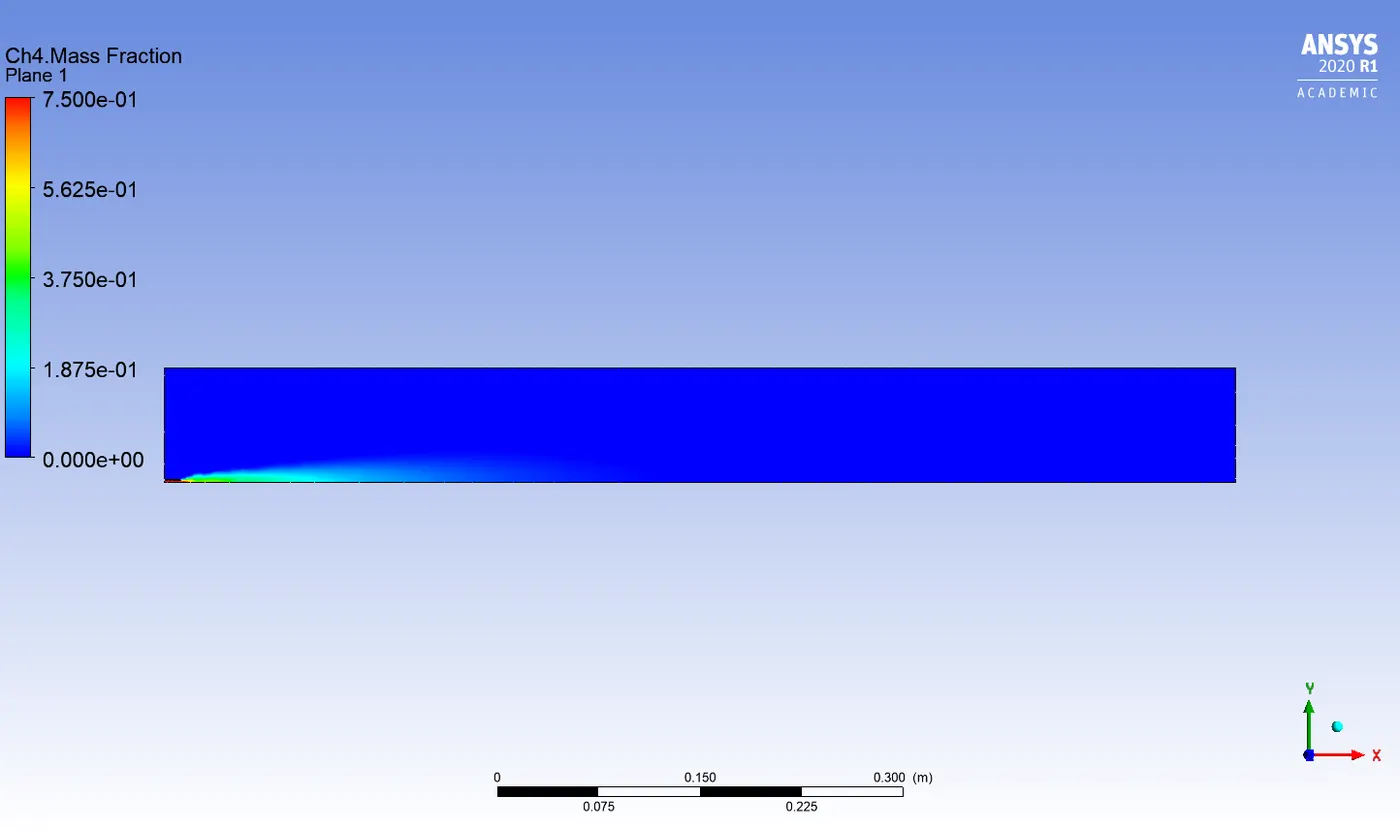
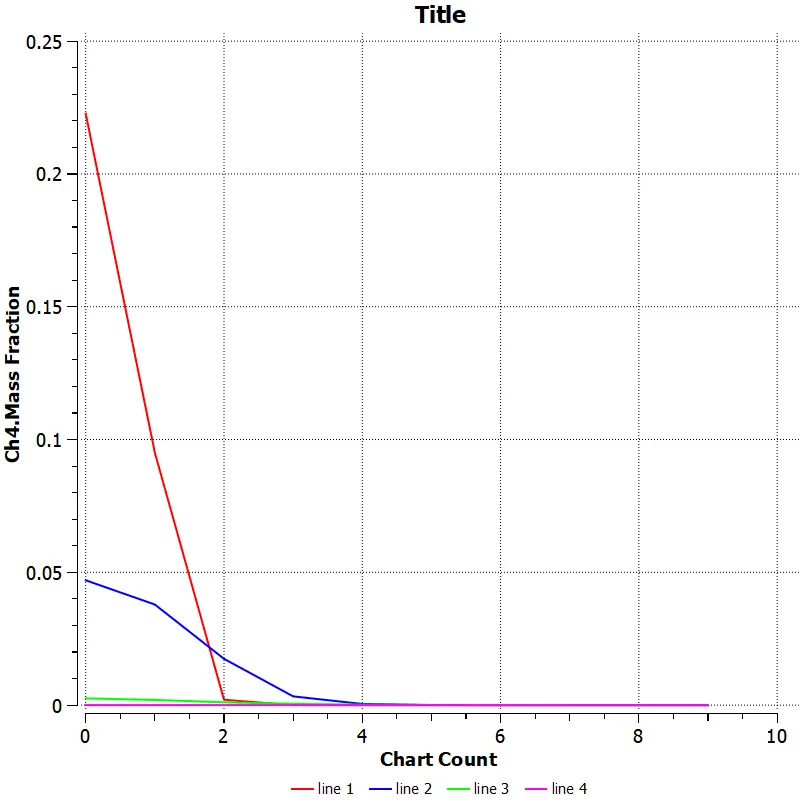
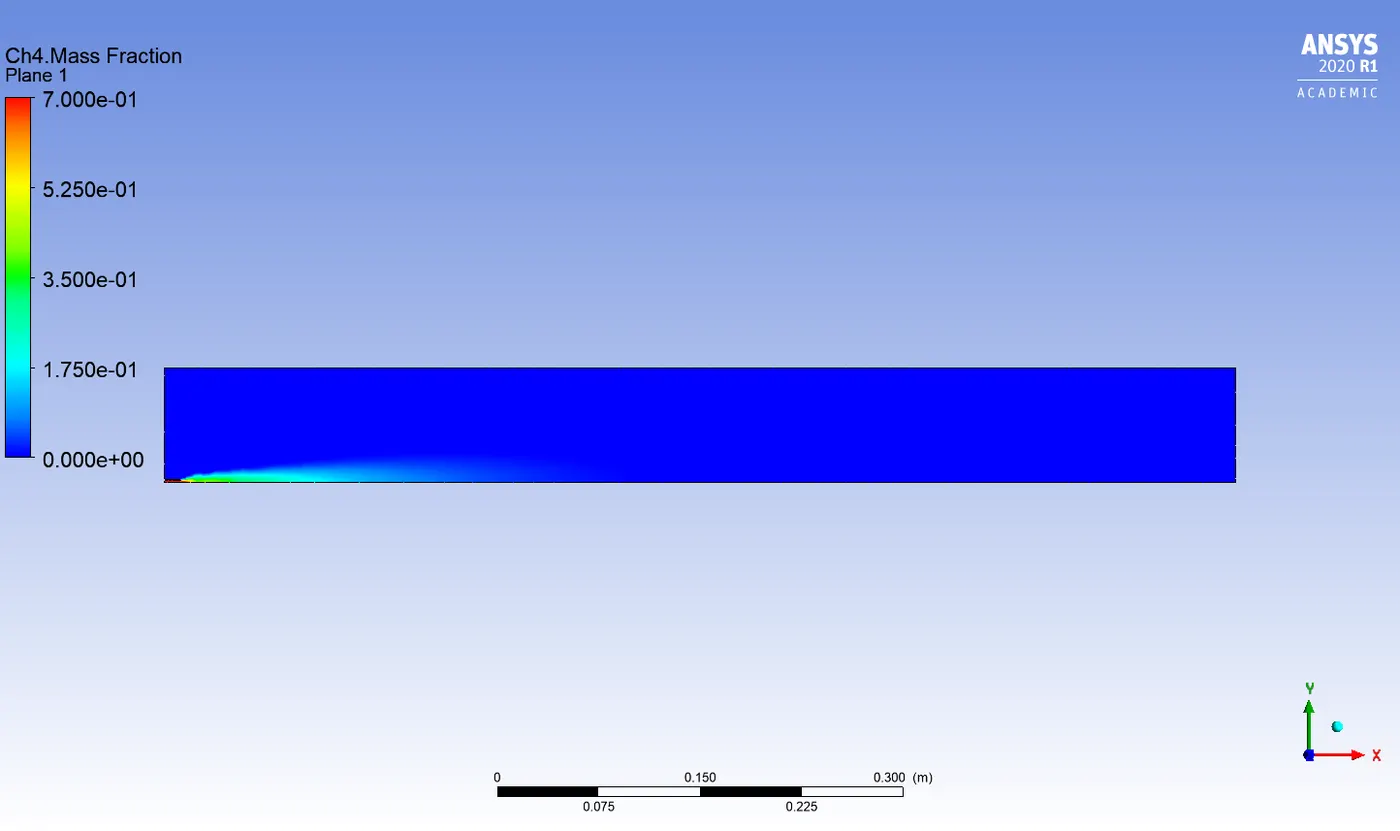
30% water content in fuel
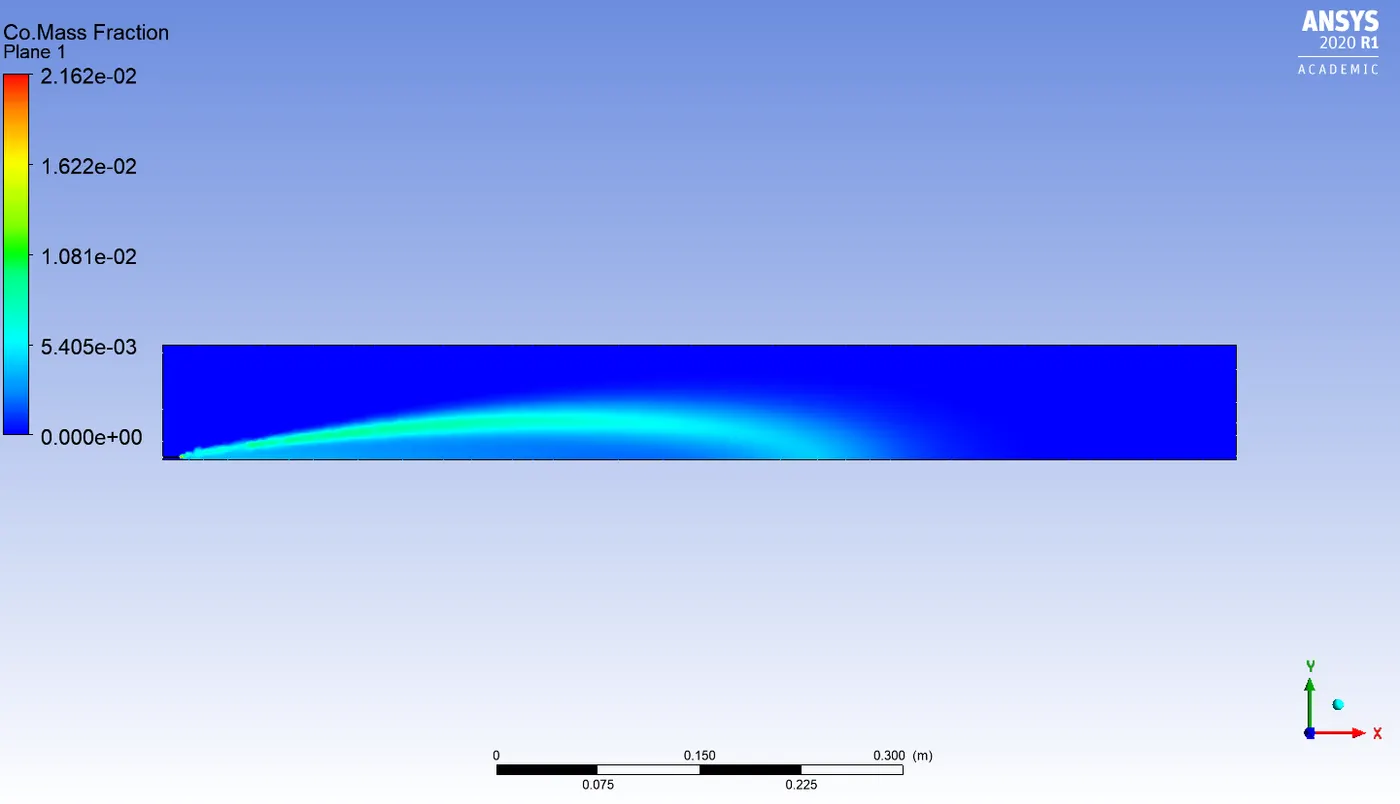
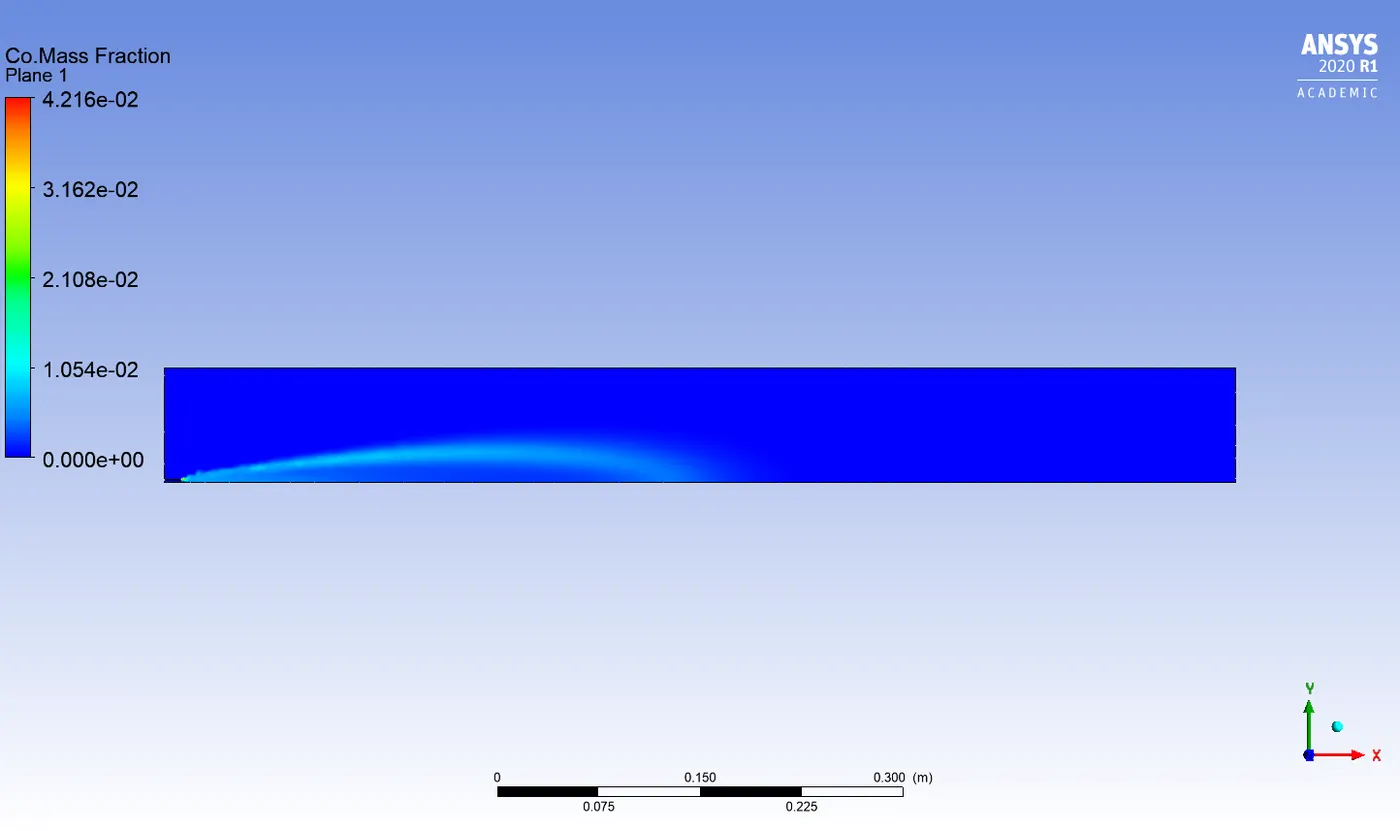
Co mass fraction :
5% water content in fuel
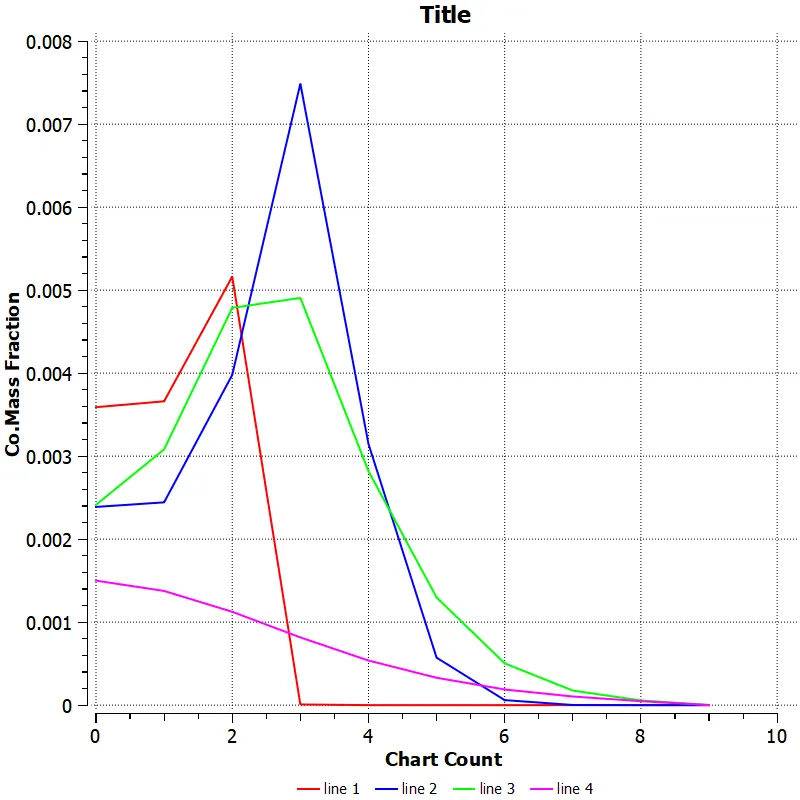
10% water content in fuel
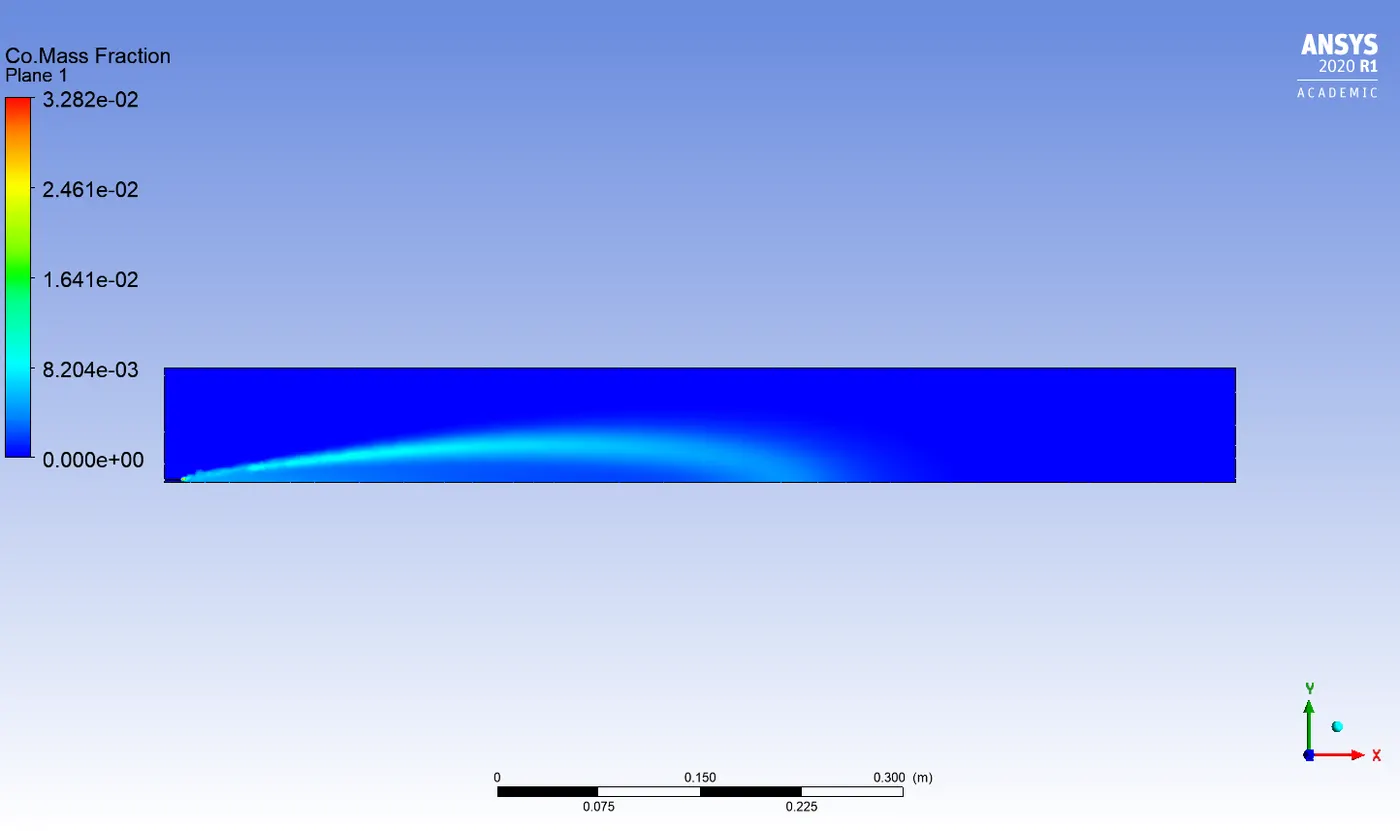
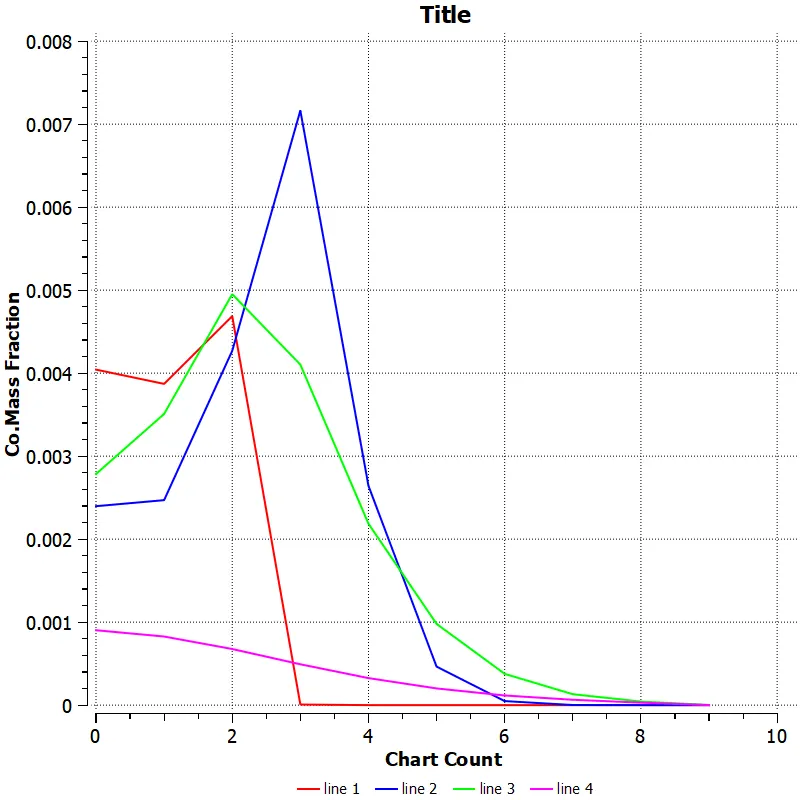
15% water content in fuel
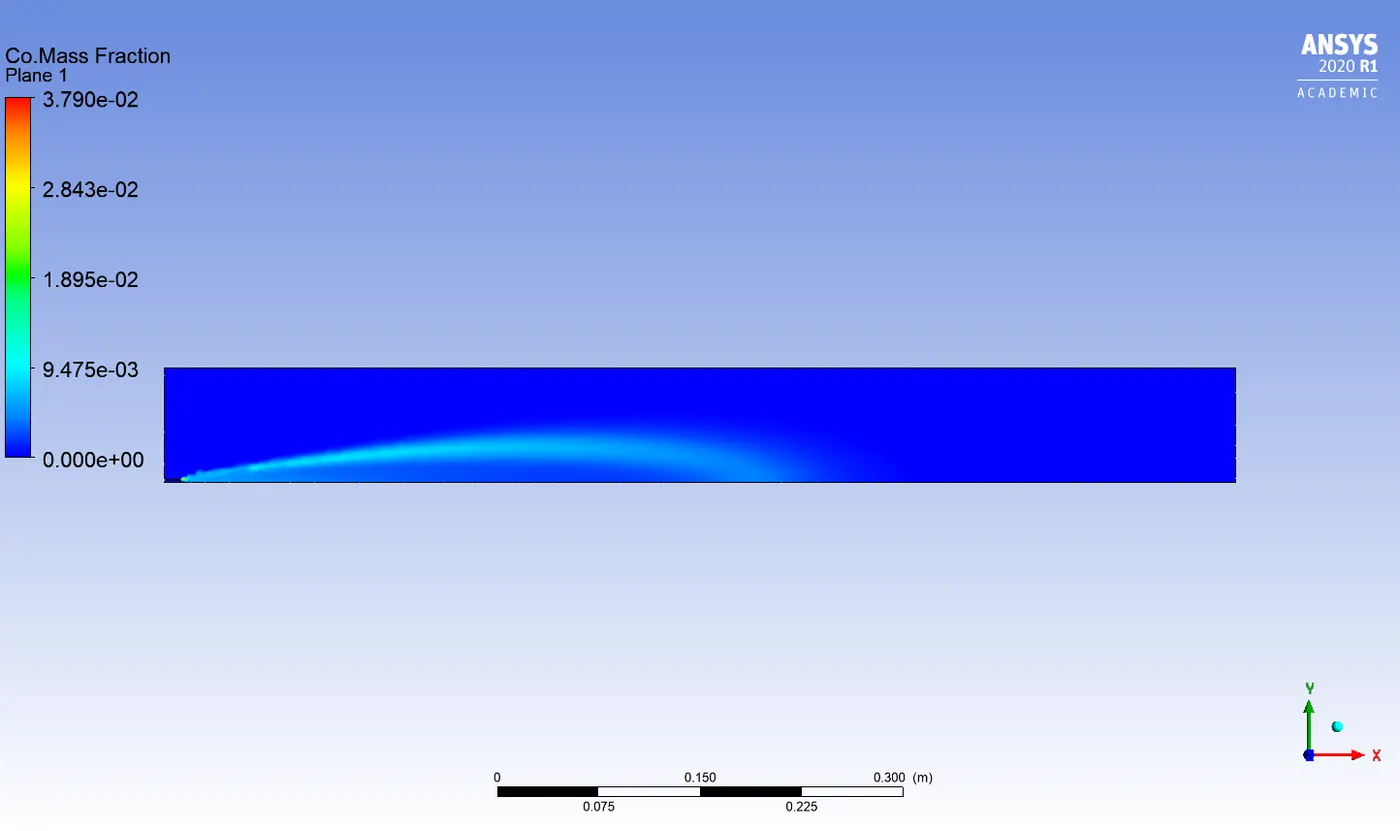
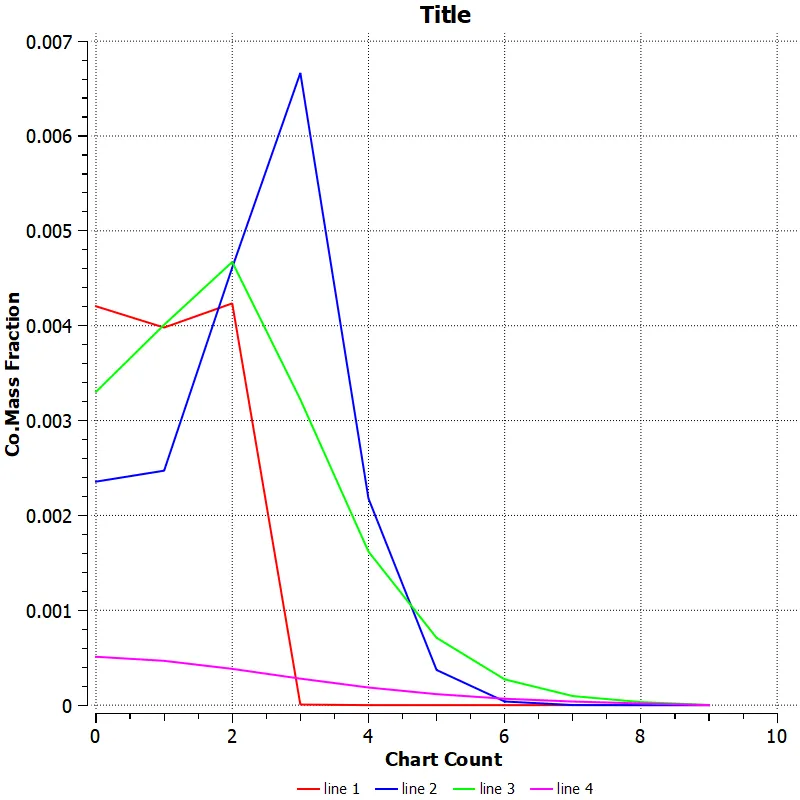
20% water content in fuel
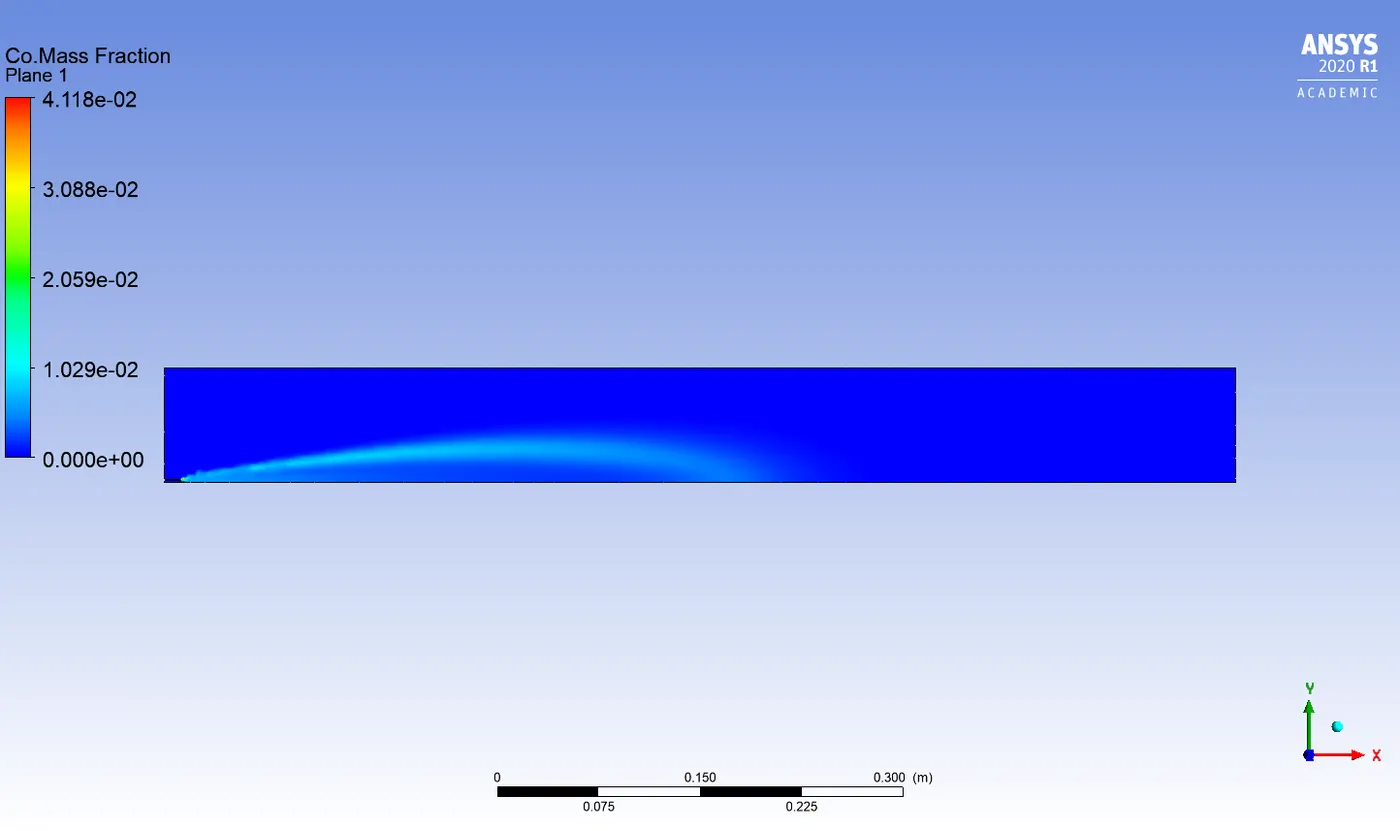
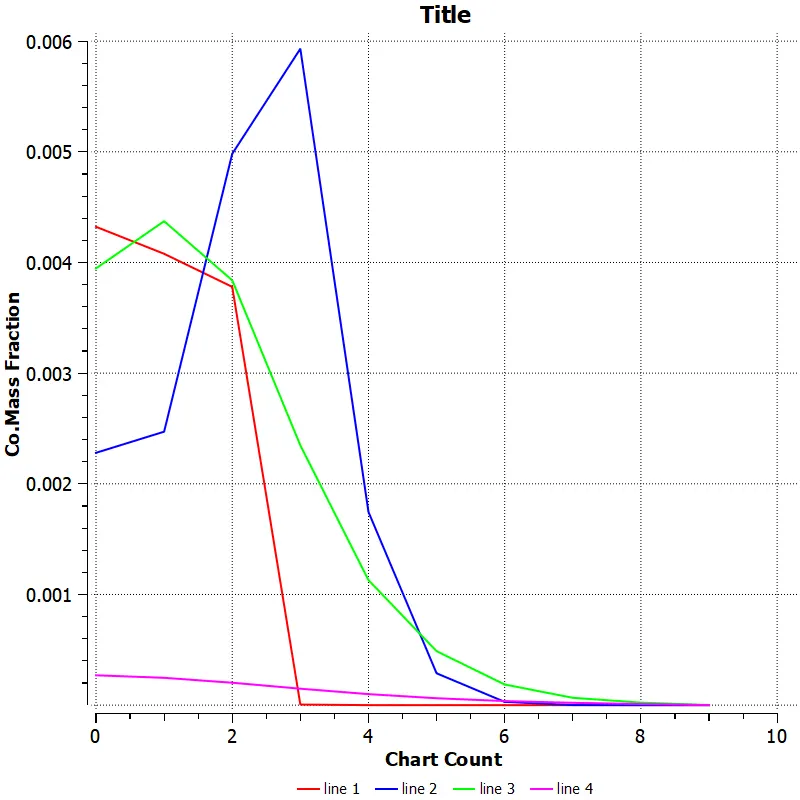
25% water content in fuel
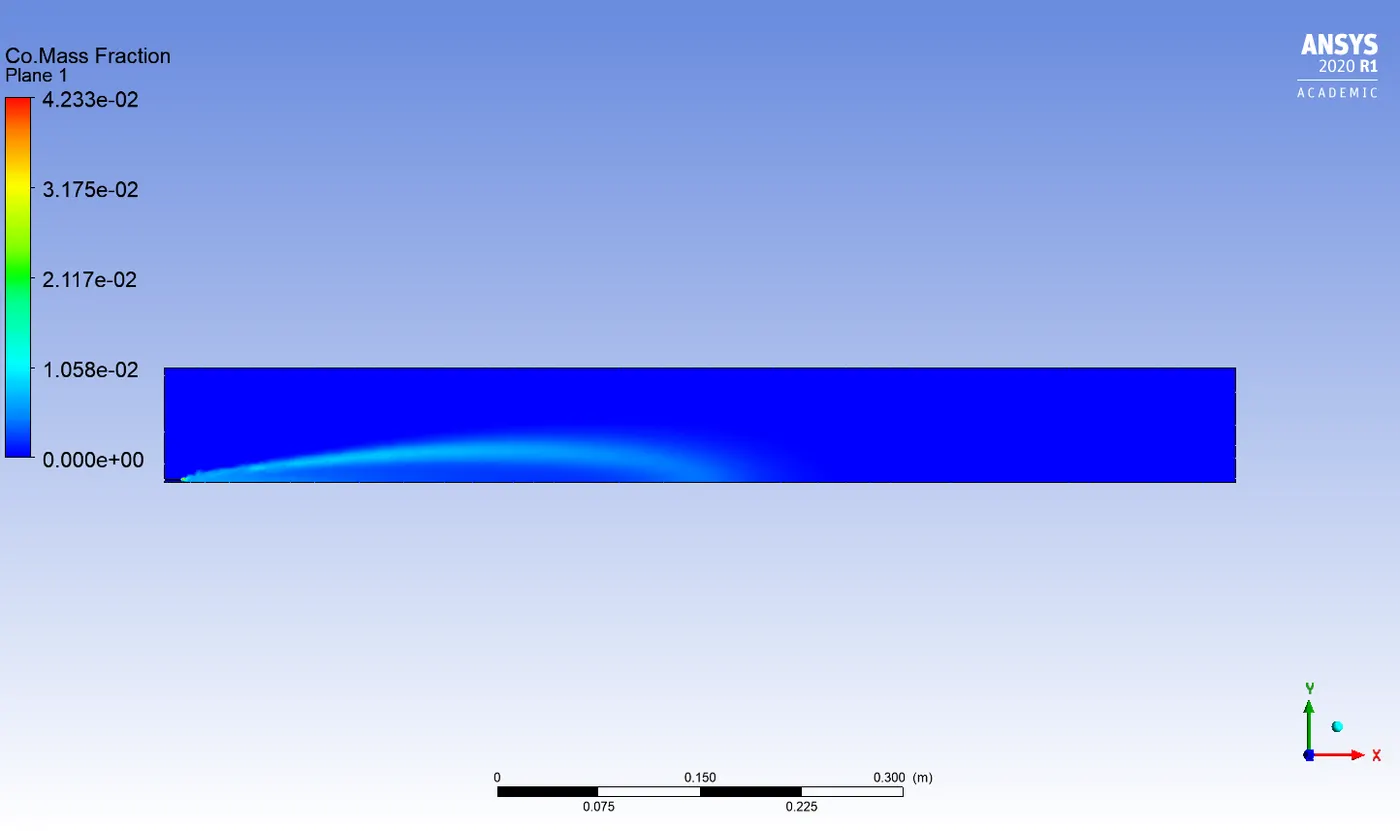
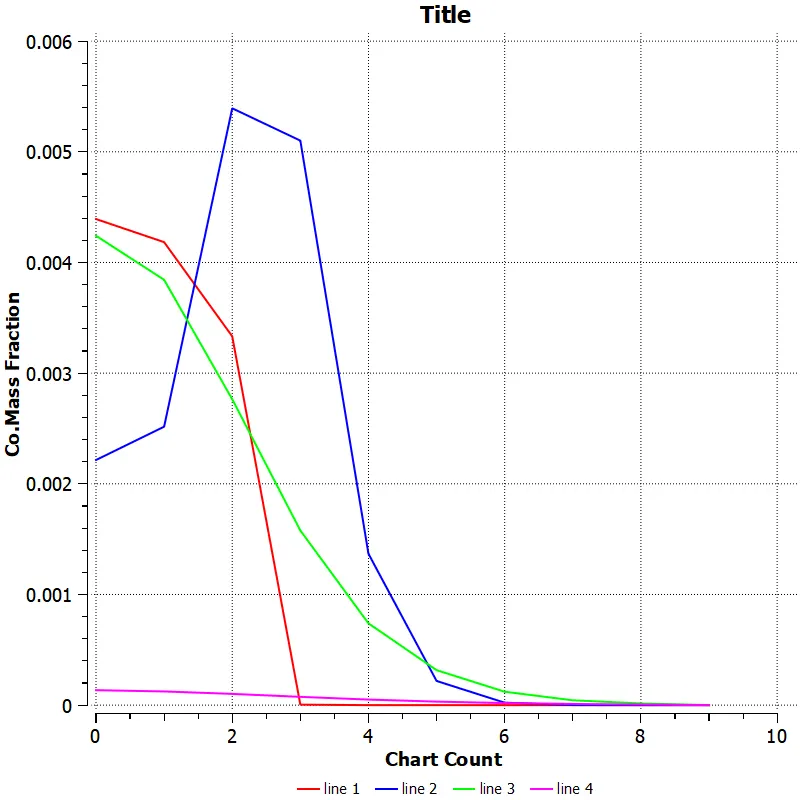
30% water content in fuel
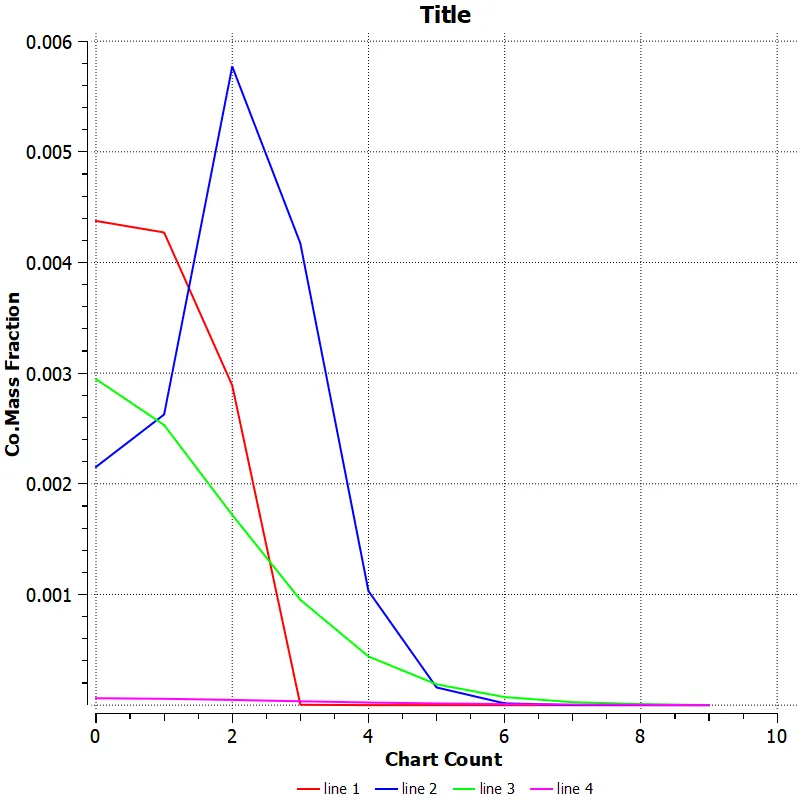
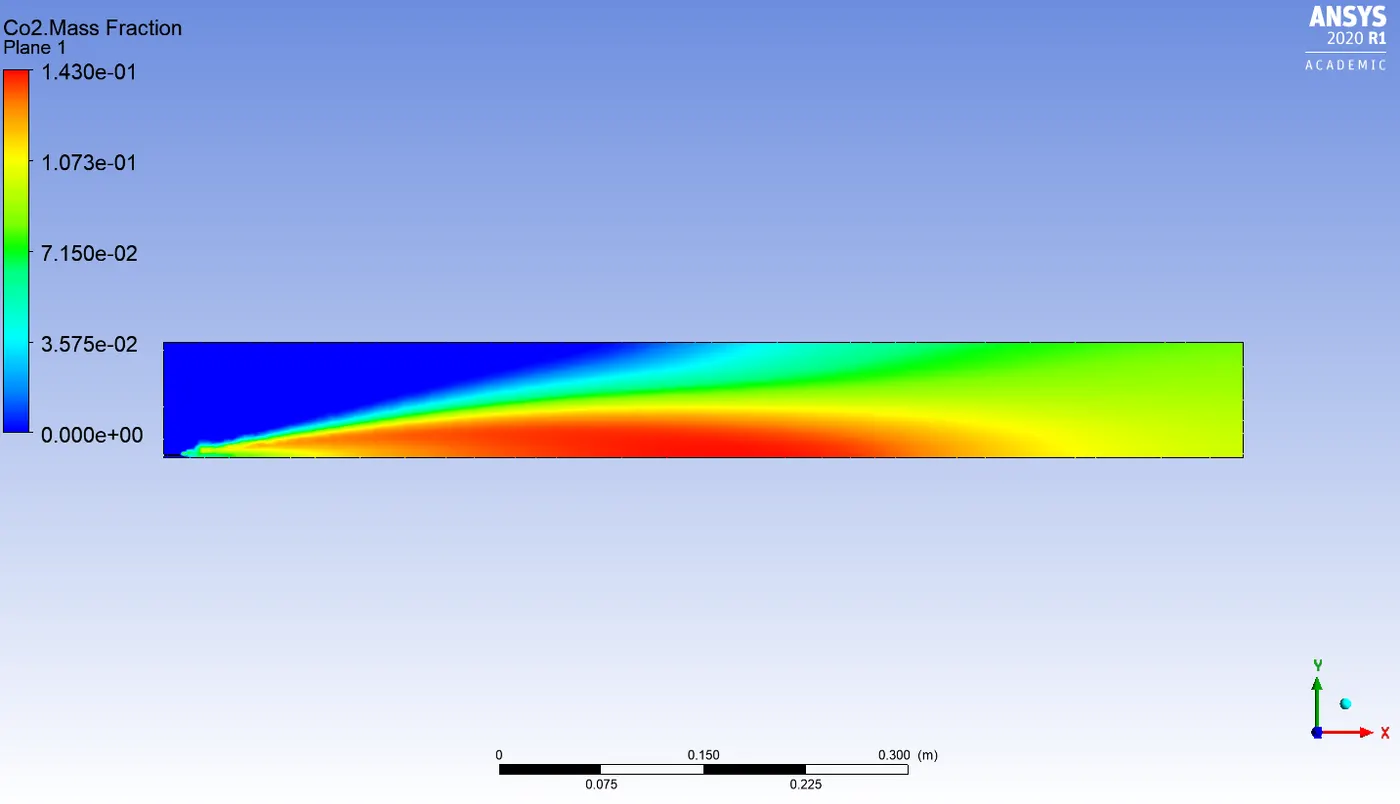
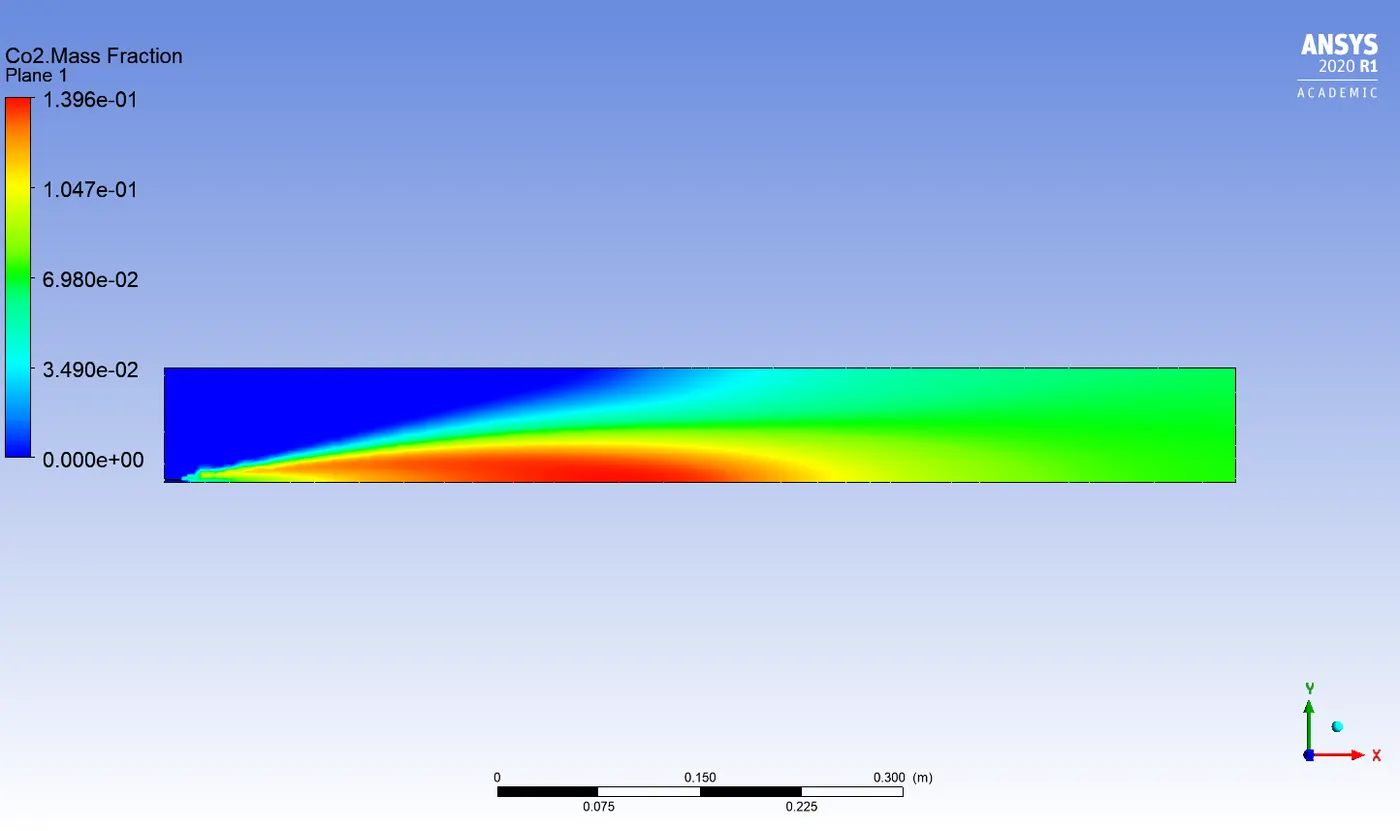
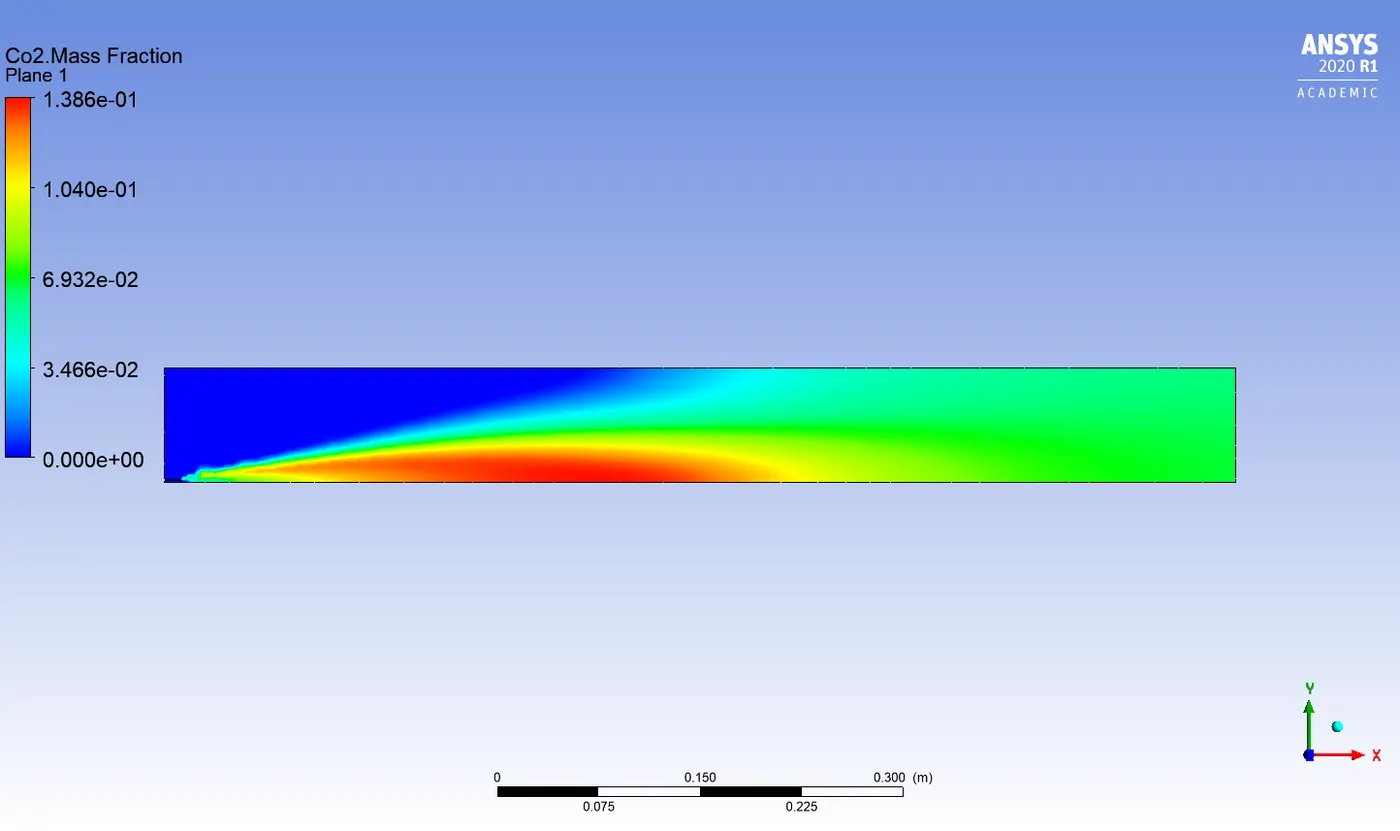
Co2 mass fraction :
5% water content in fuel
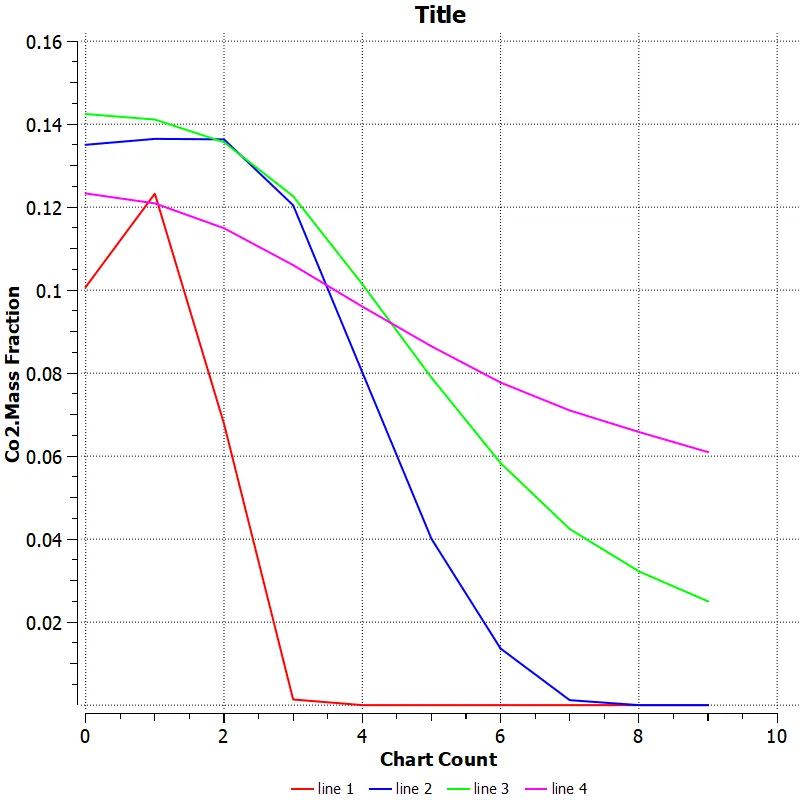
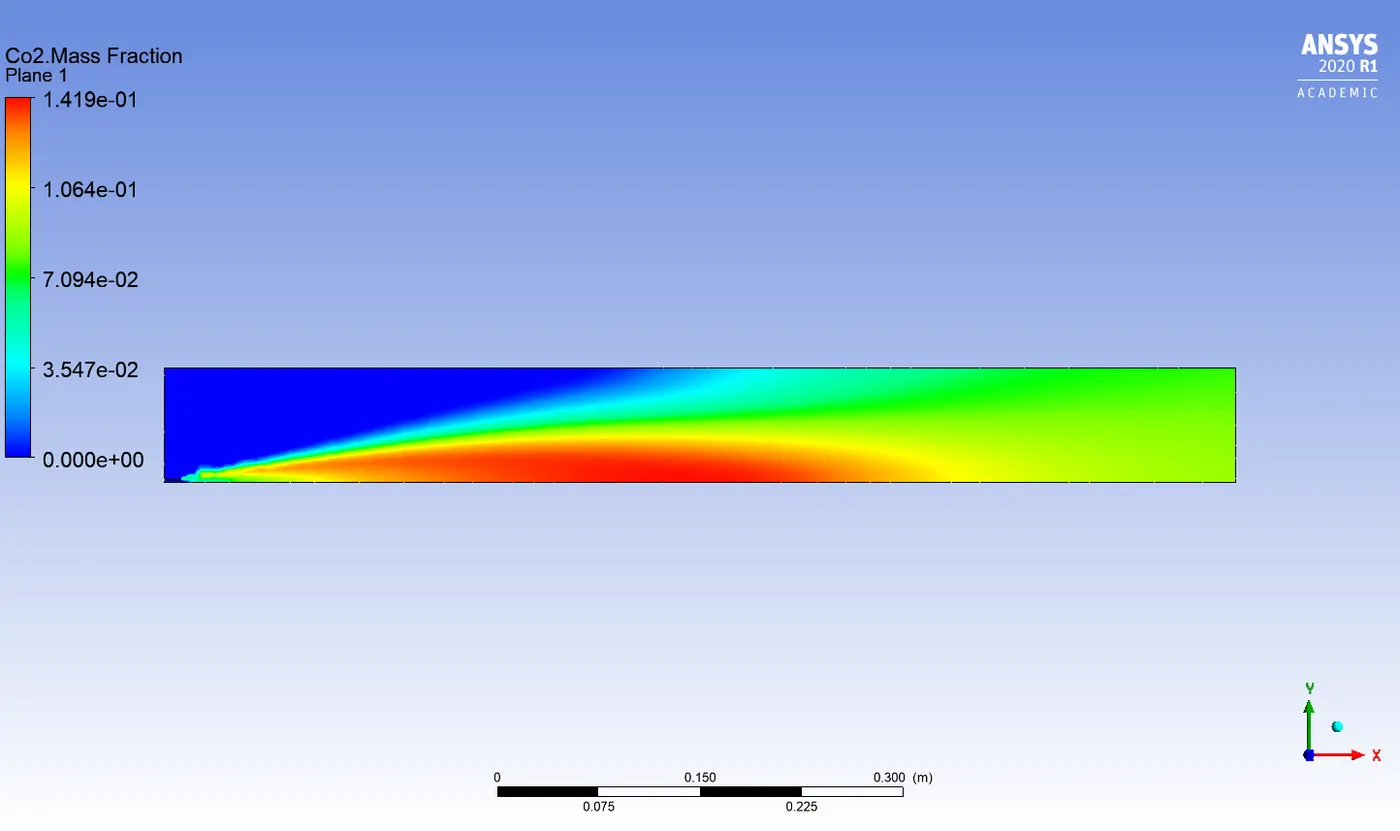
10% water content in fuel
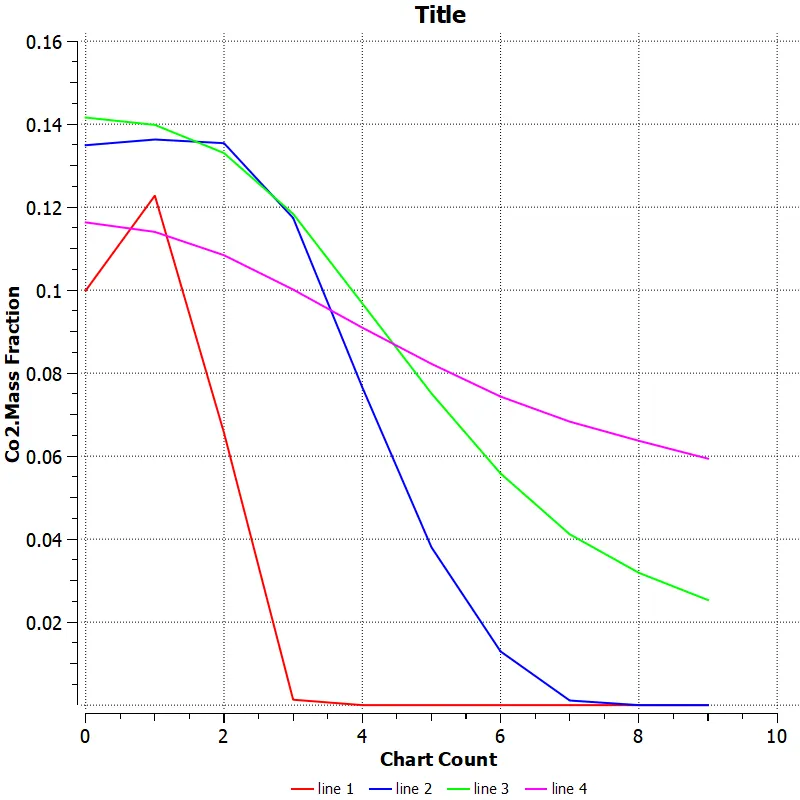
15% water content in fuel
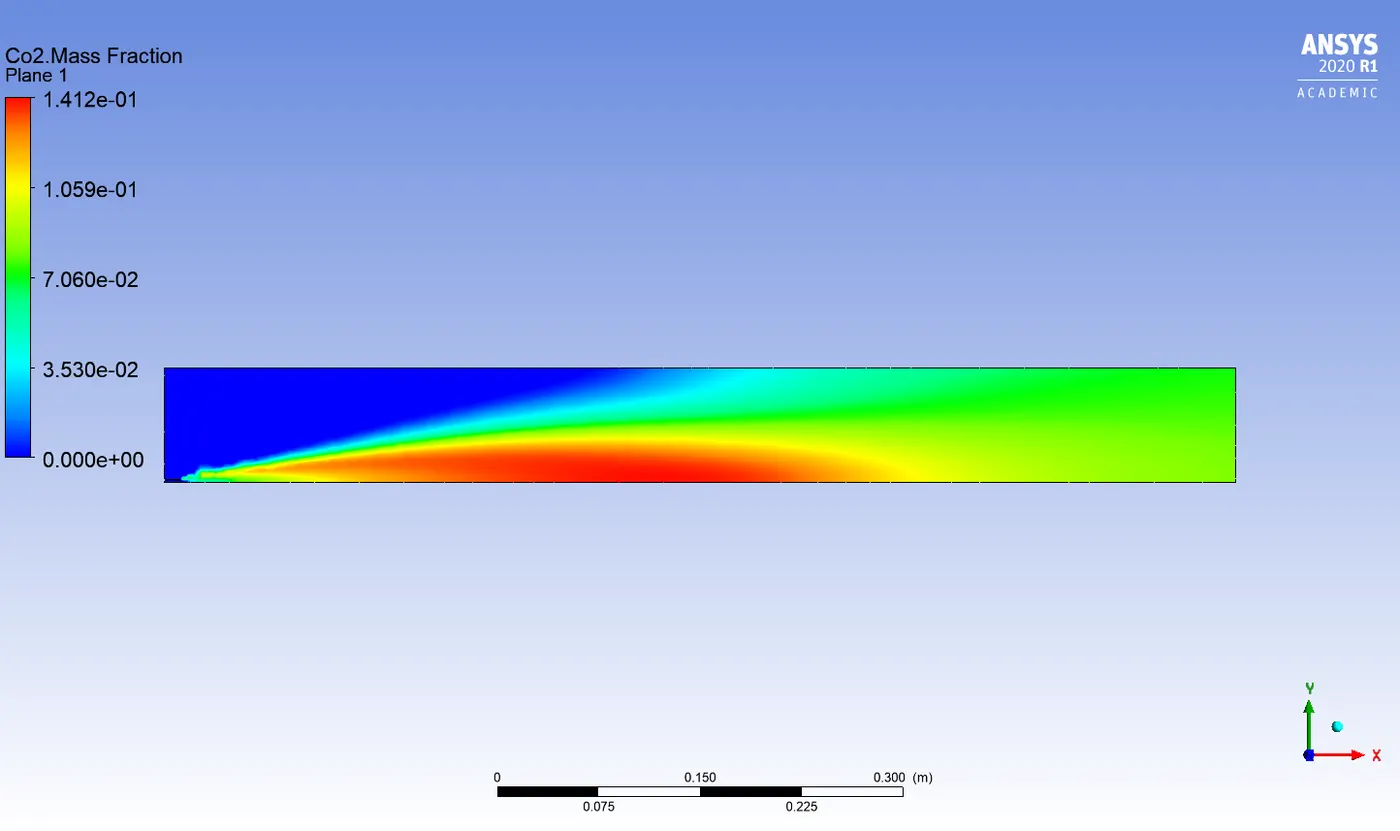
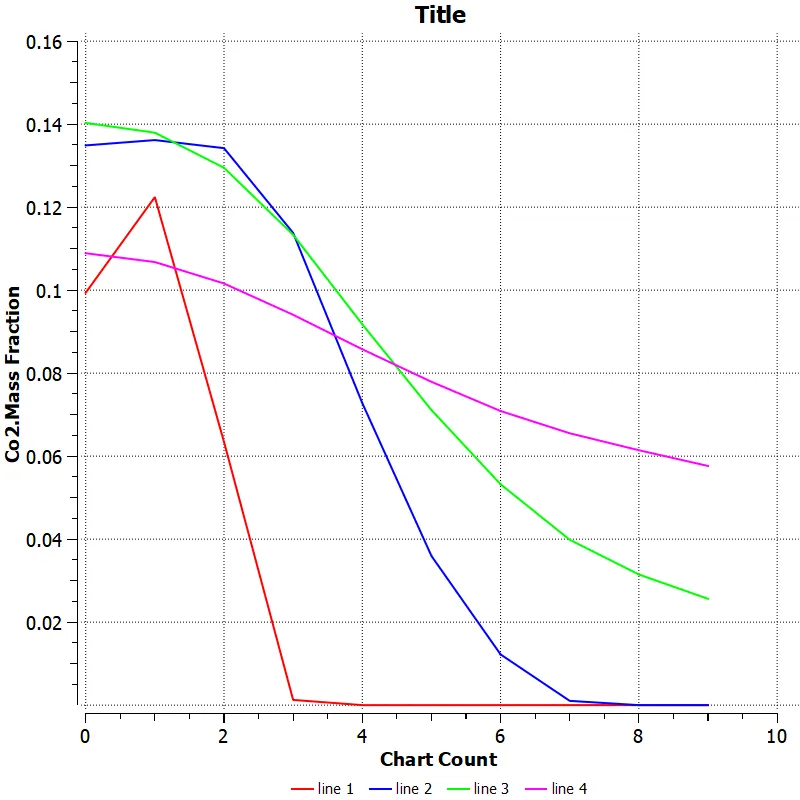
20% water content in fuel
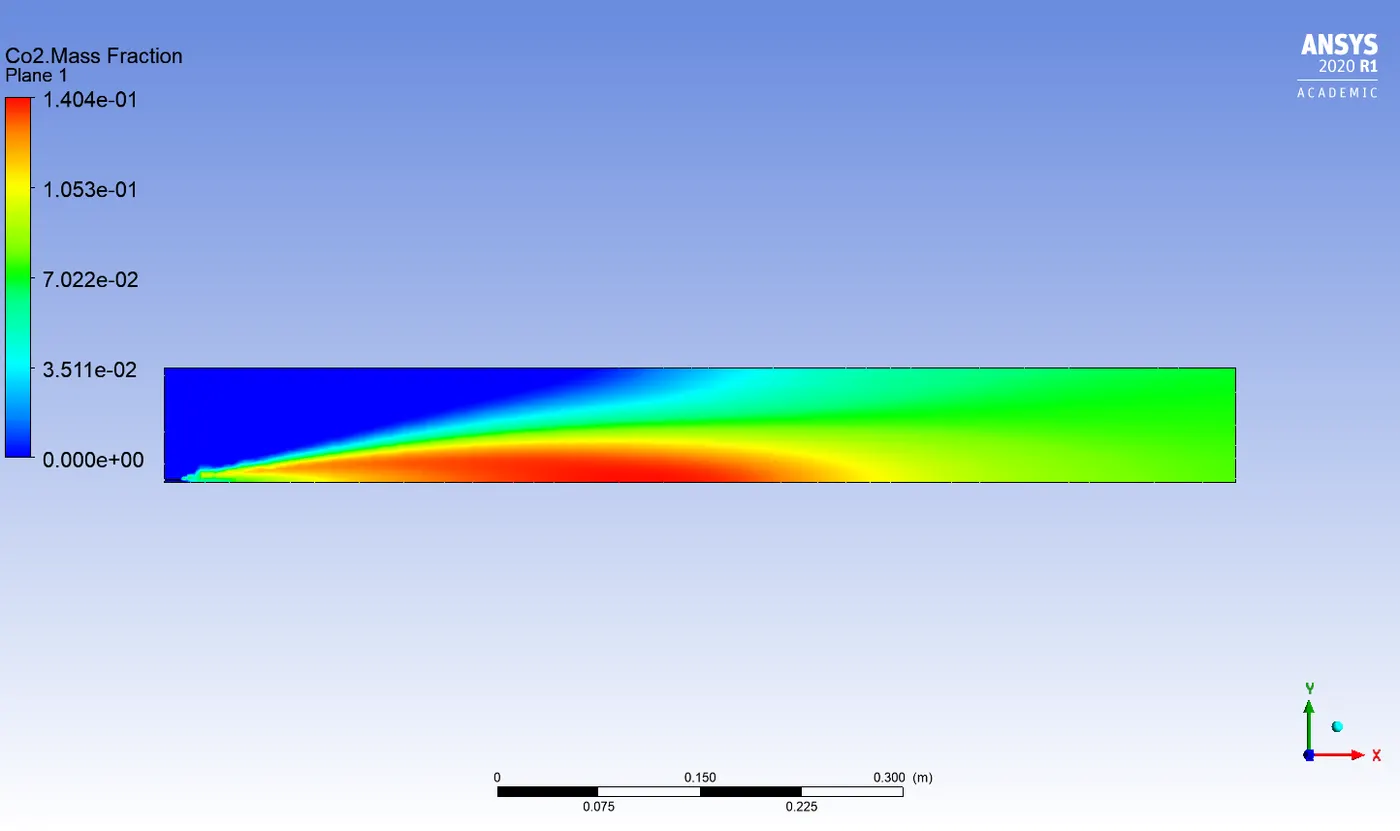
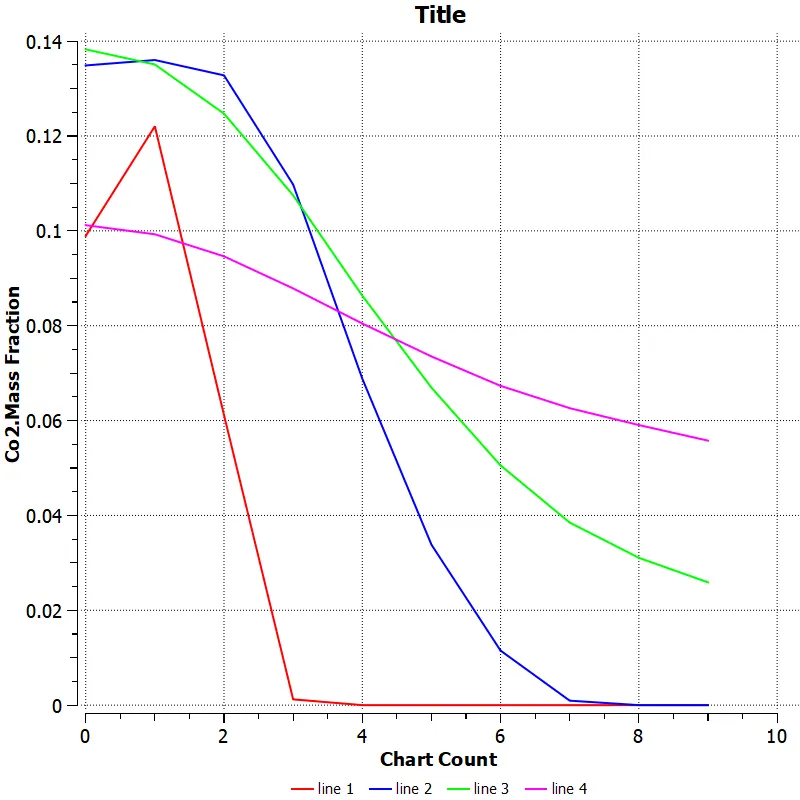
25% water content in fuel
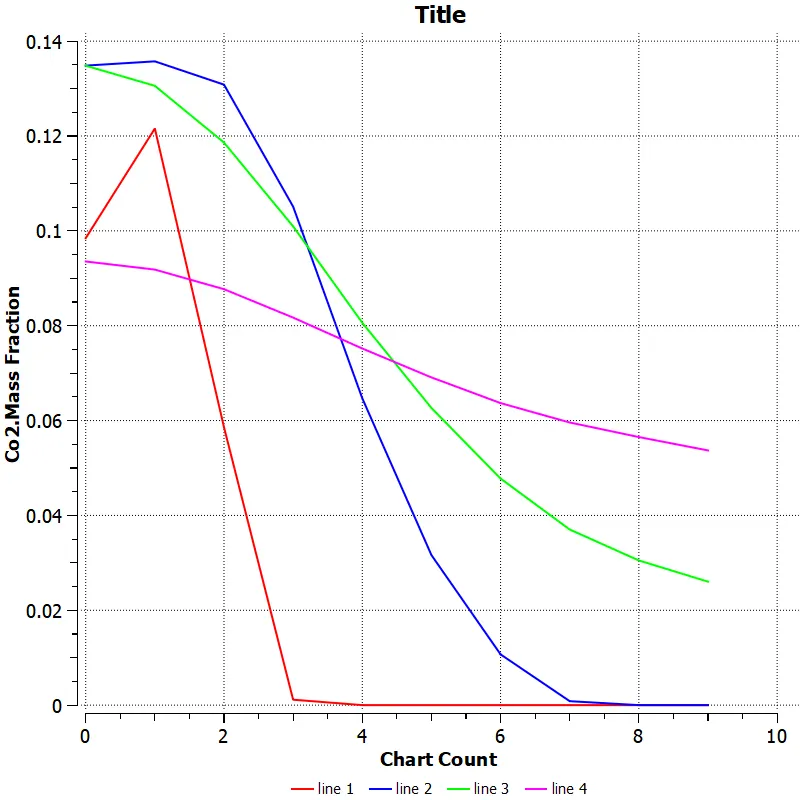
30% water content in fuel
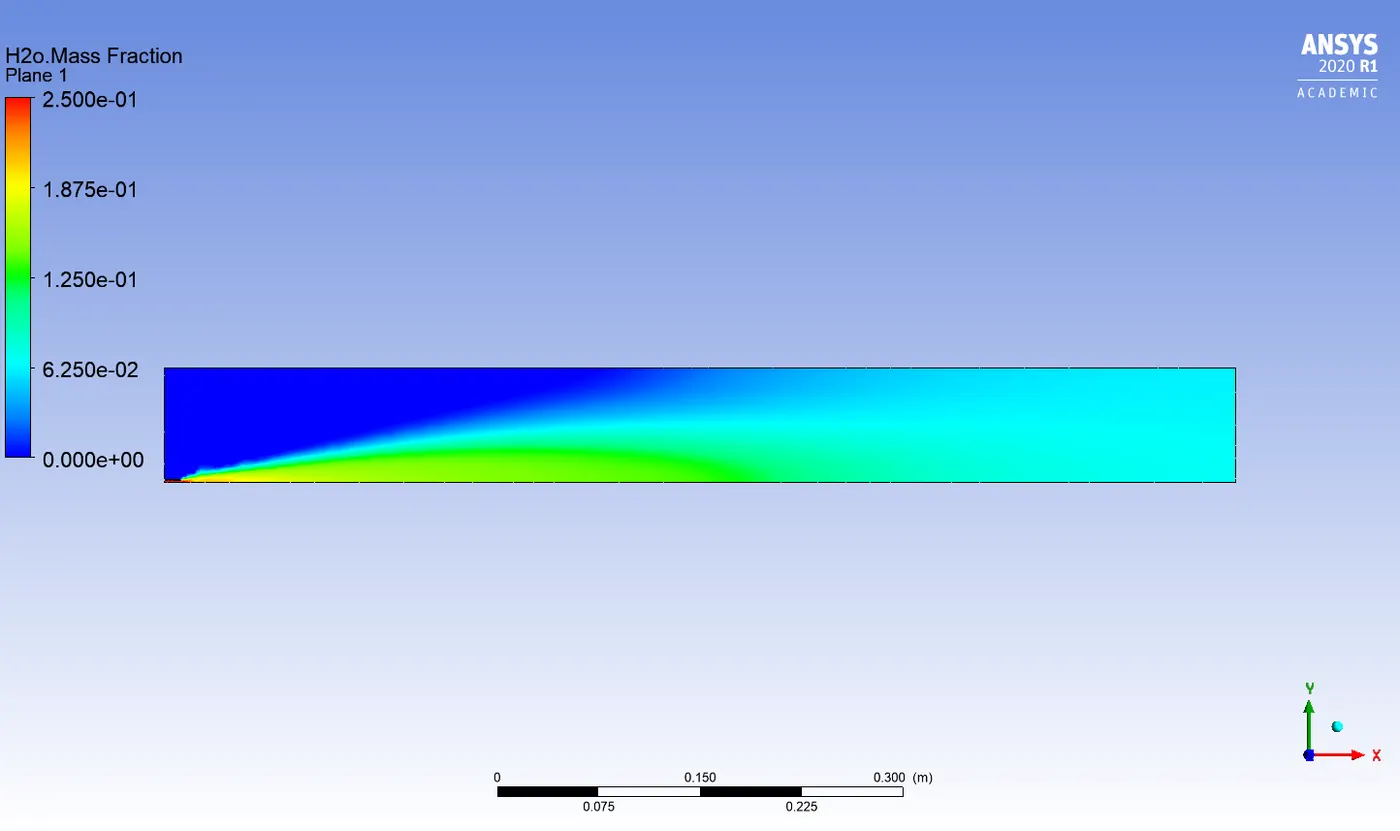
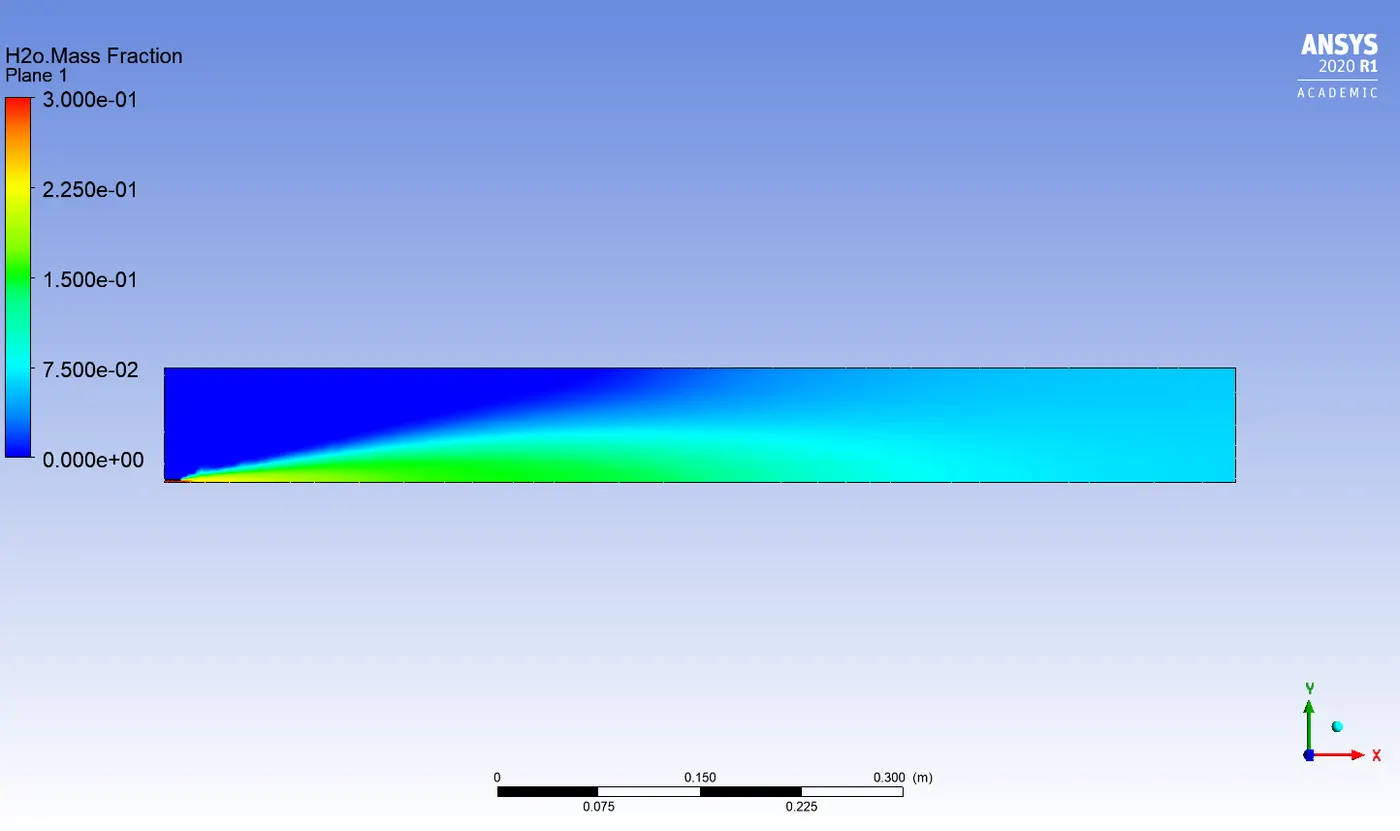
H2o mass fraction :
5% water content in fuel
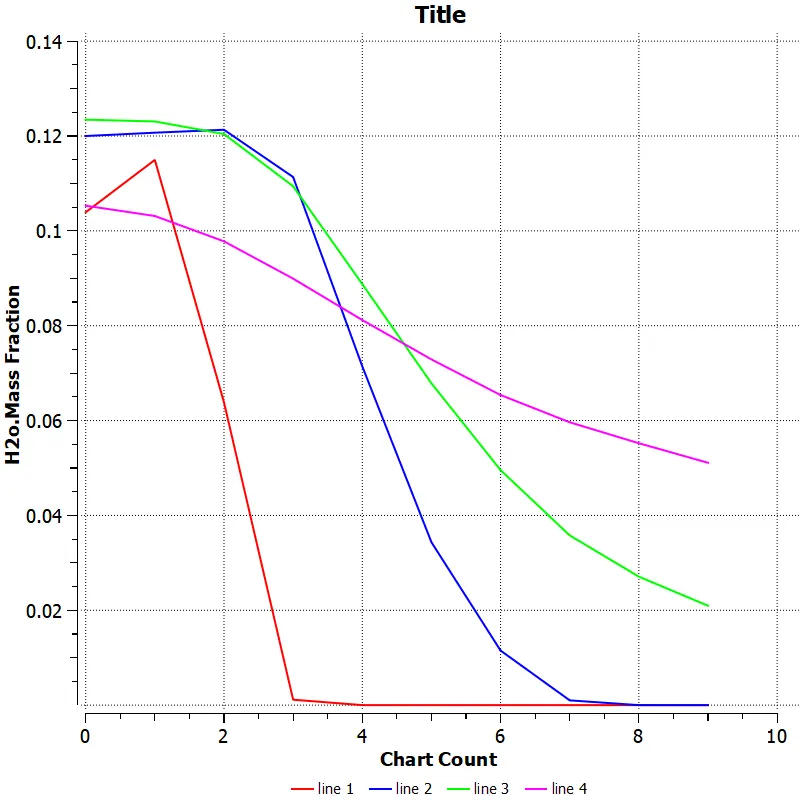
10% water content in fuel
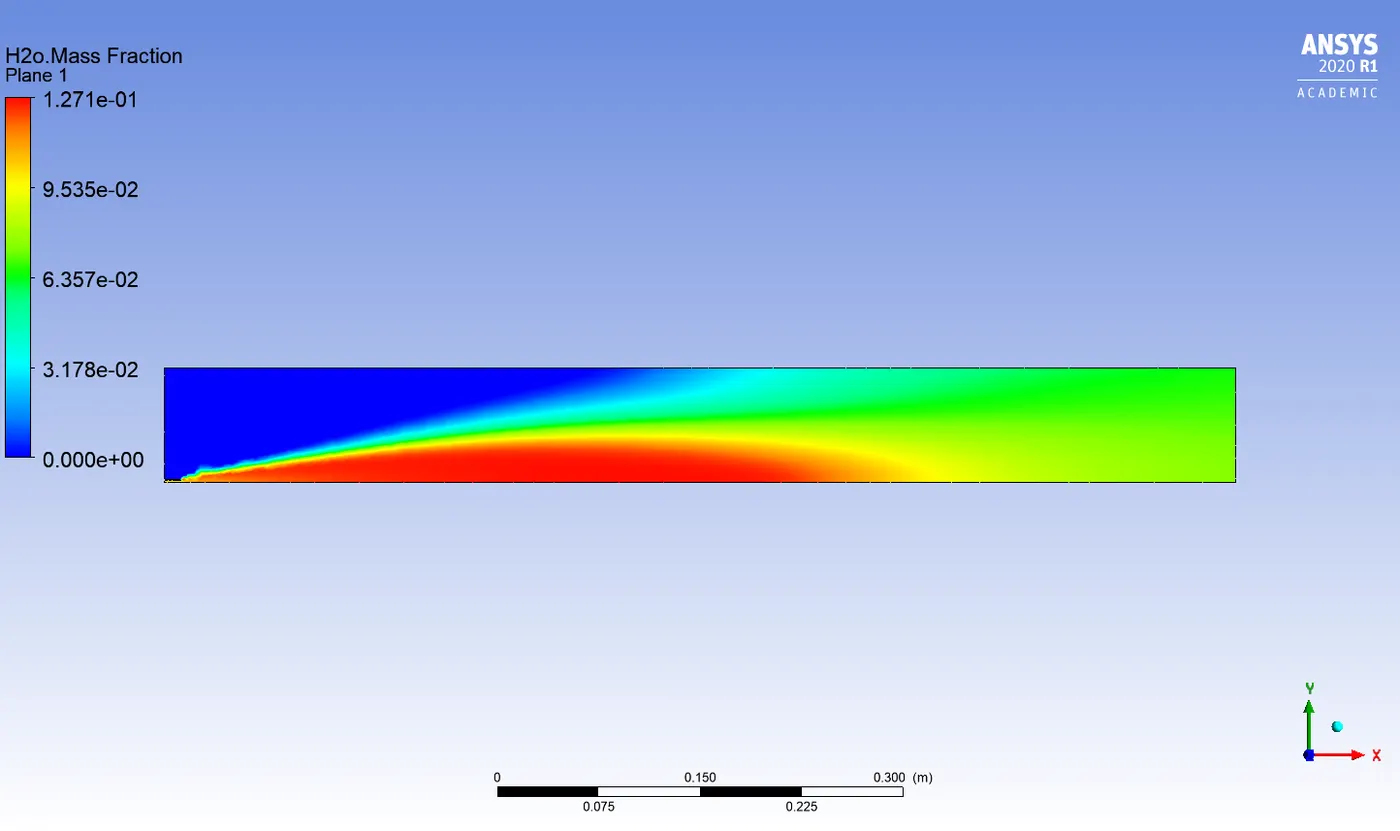
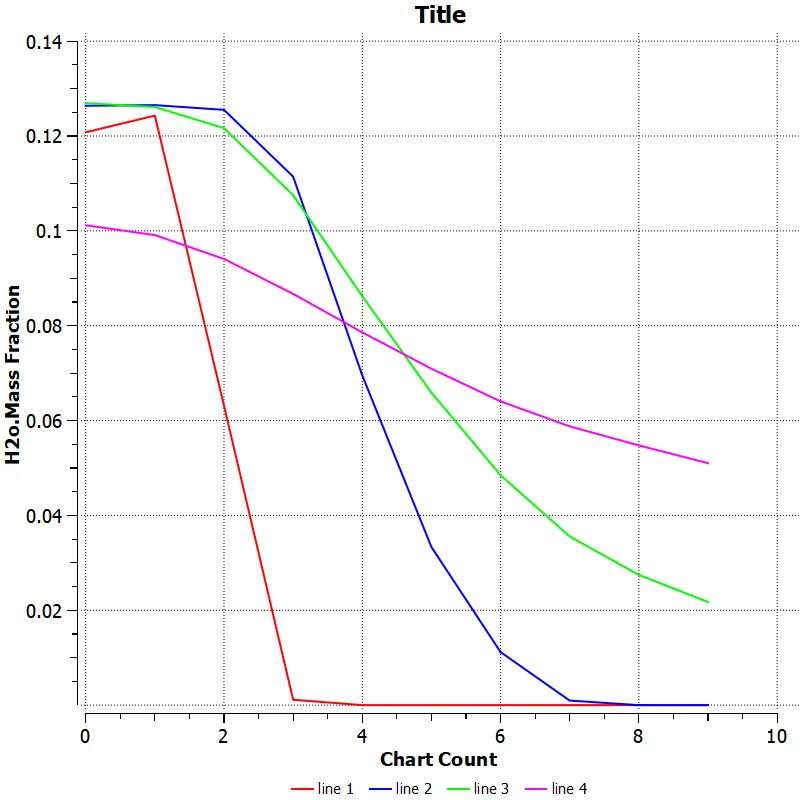
15% water content in fuel
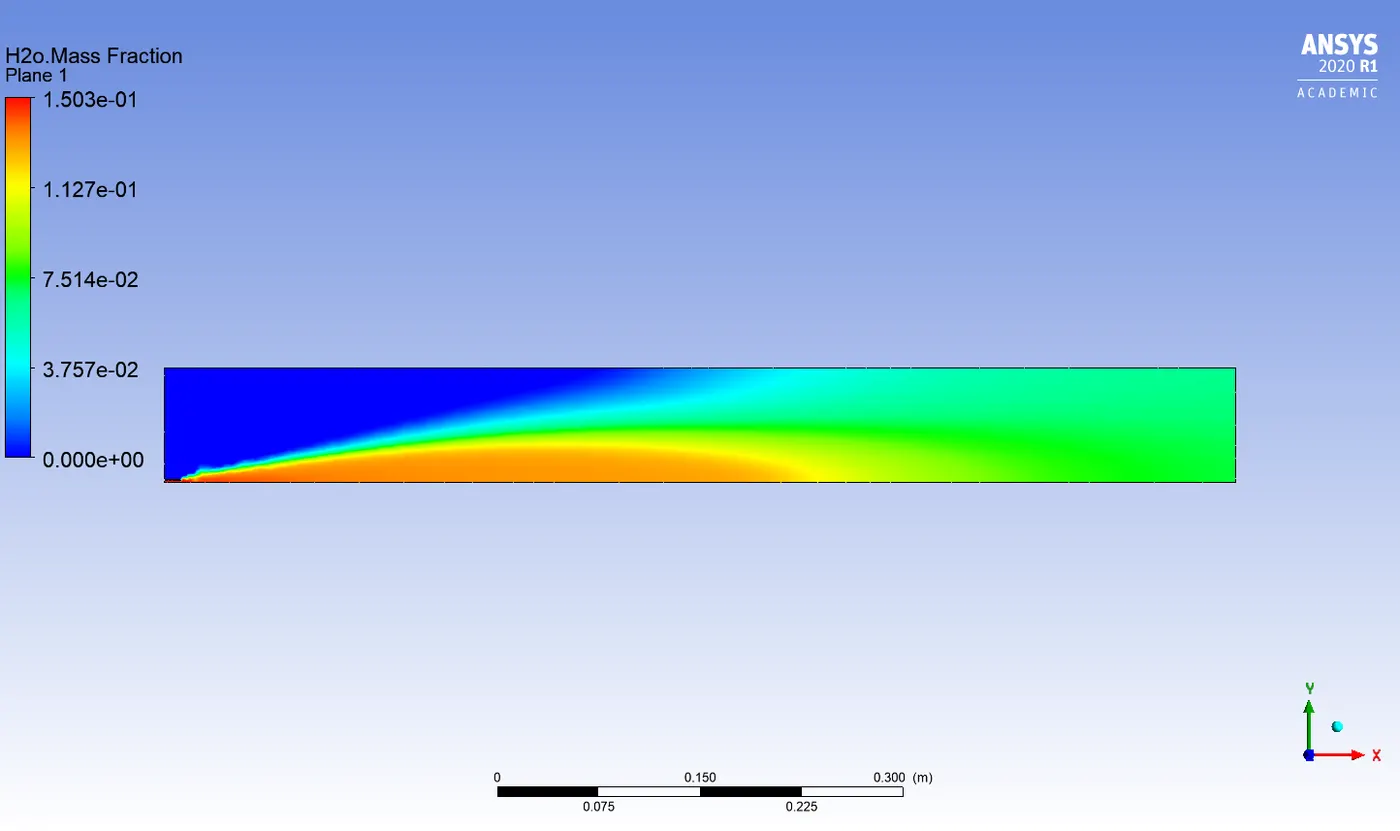
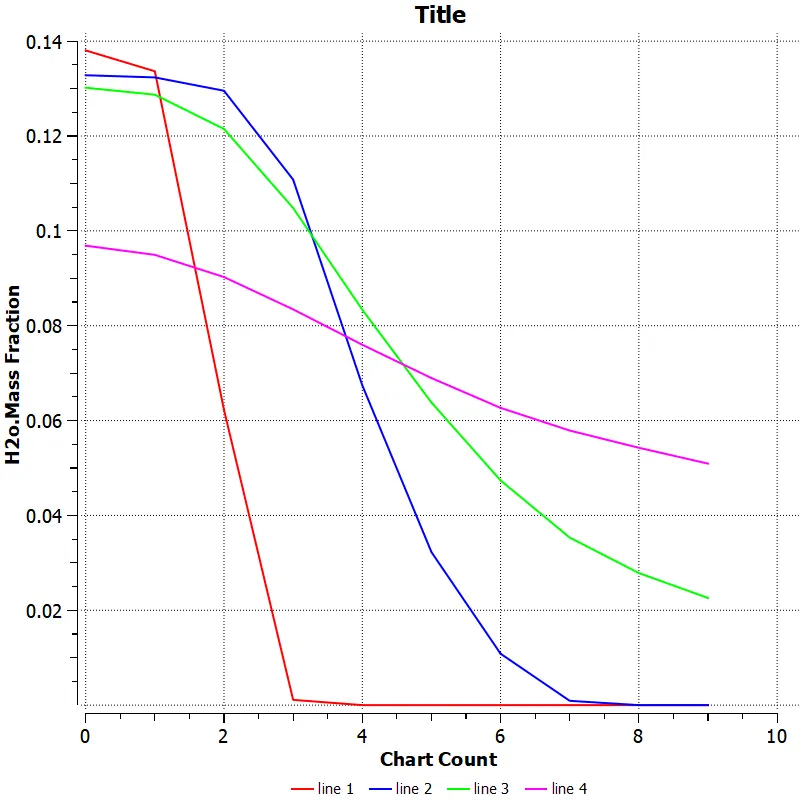
20% water content in fuel
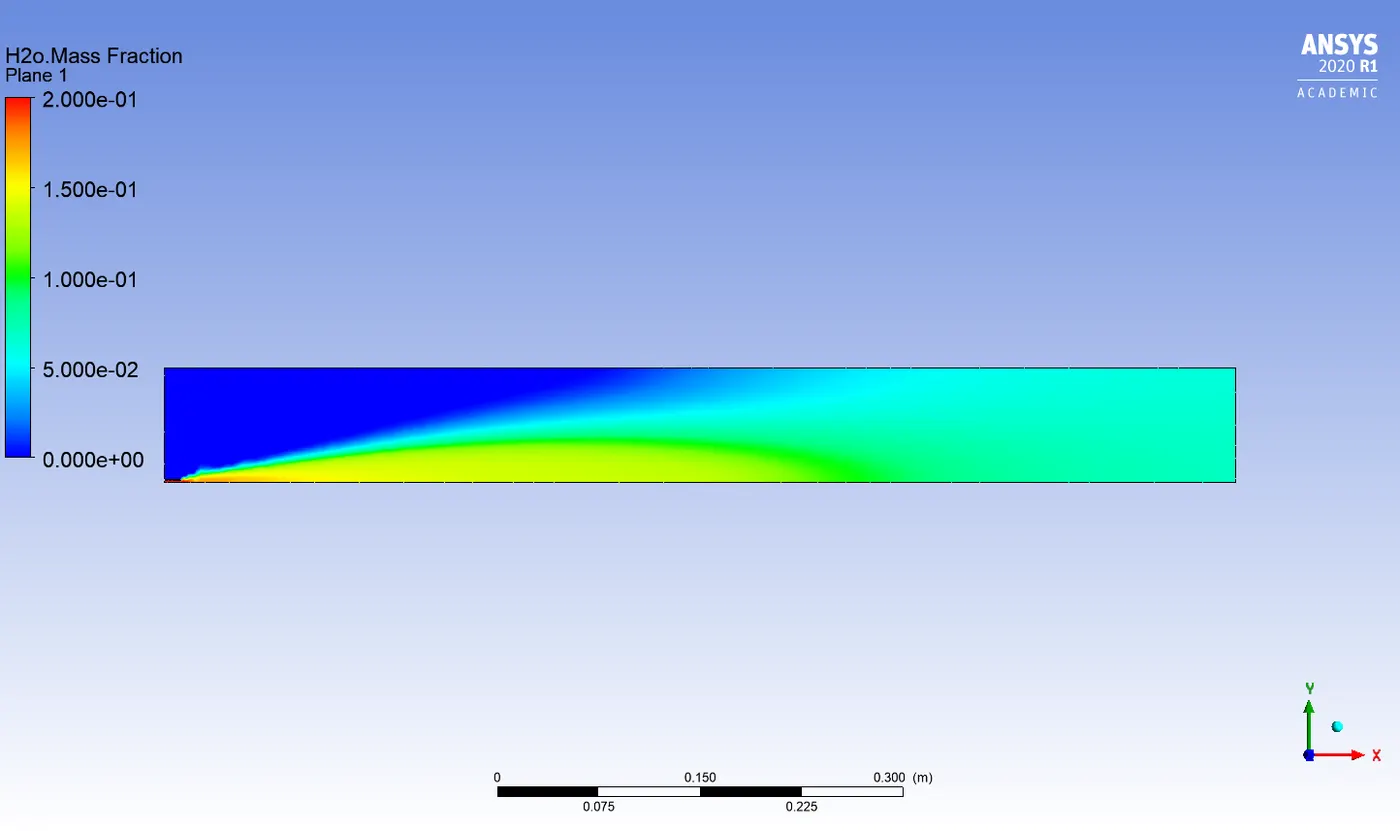
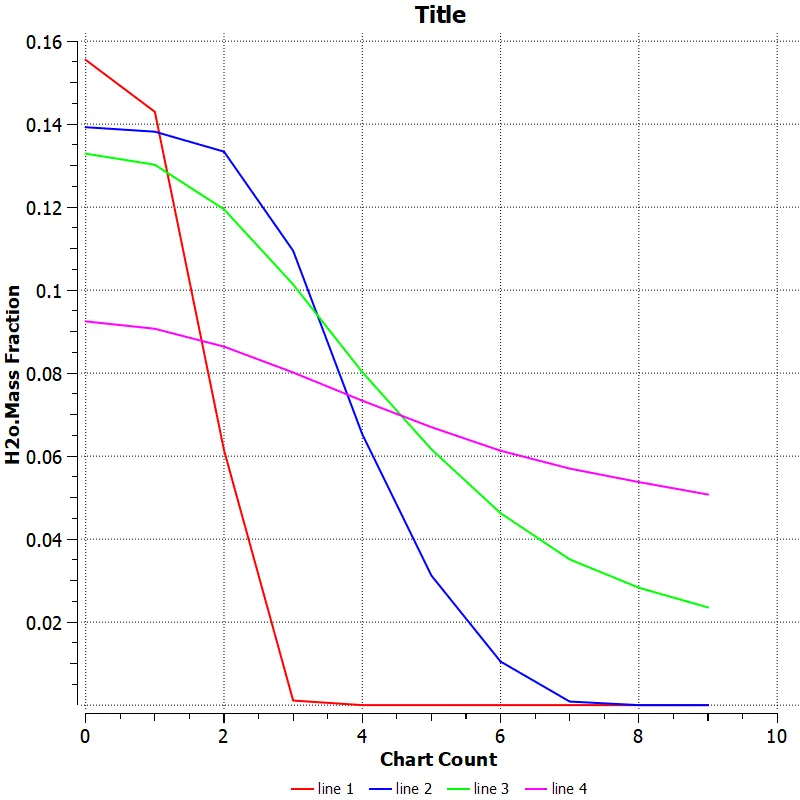
25% water content in fuel
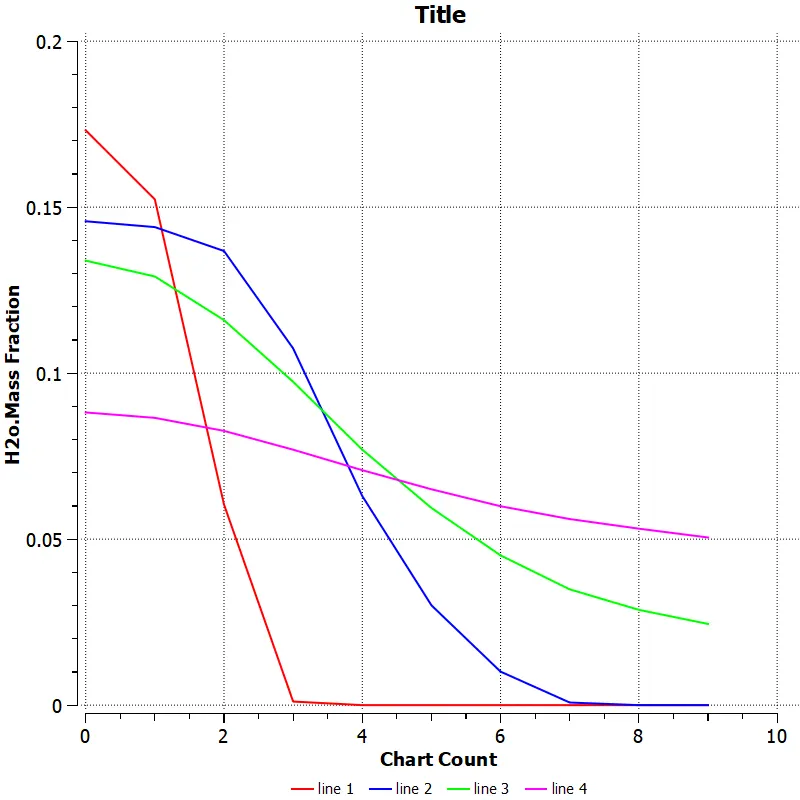
30% water content in fuel
N2 mass fraction :
5% water content in fuel
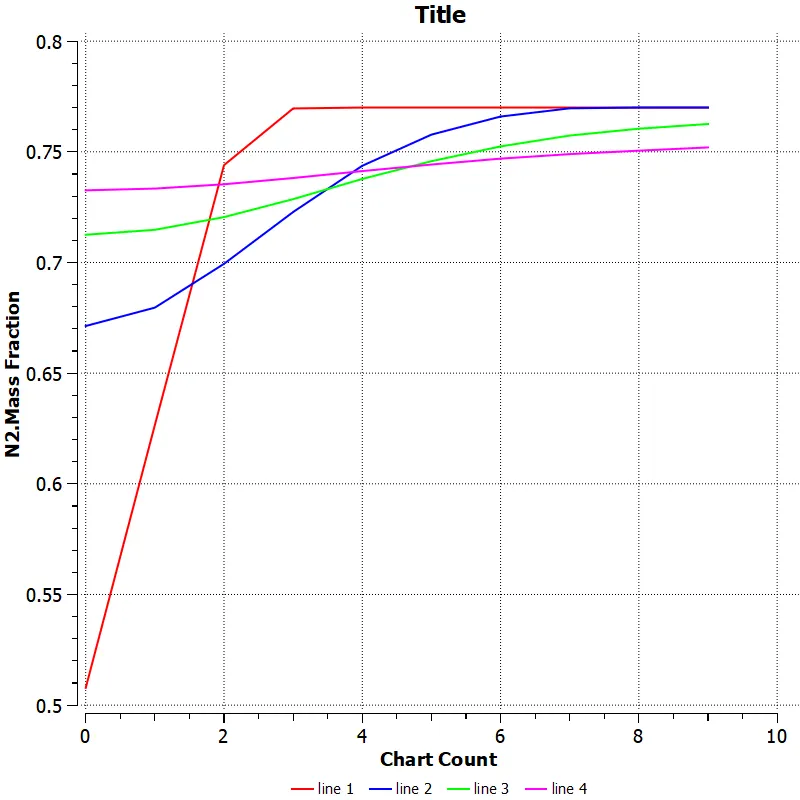
10% water content in fuel
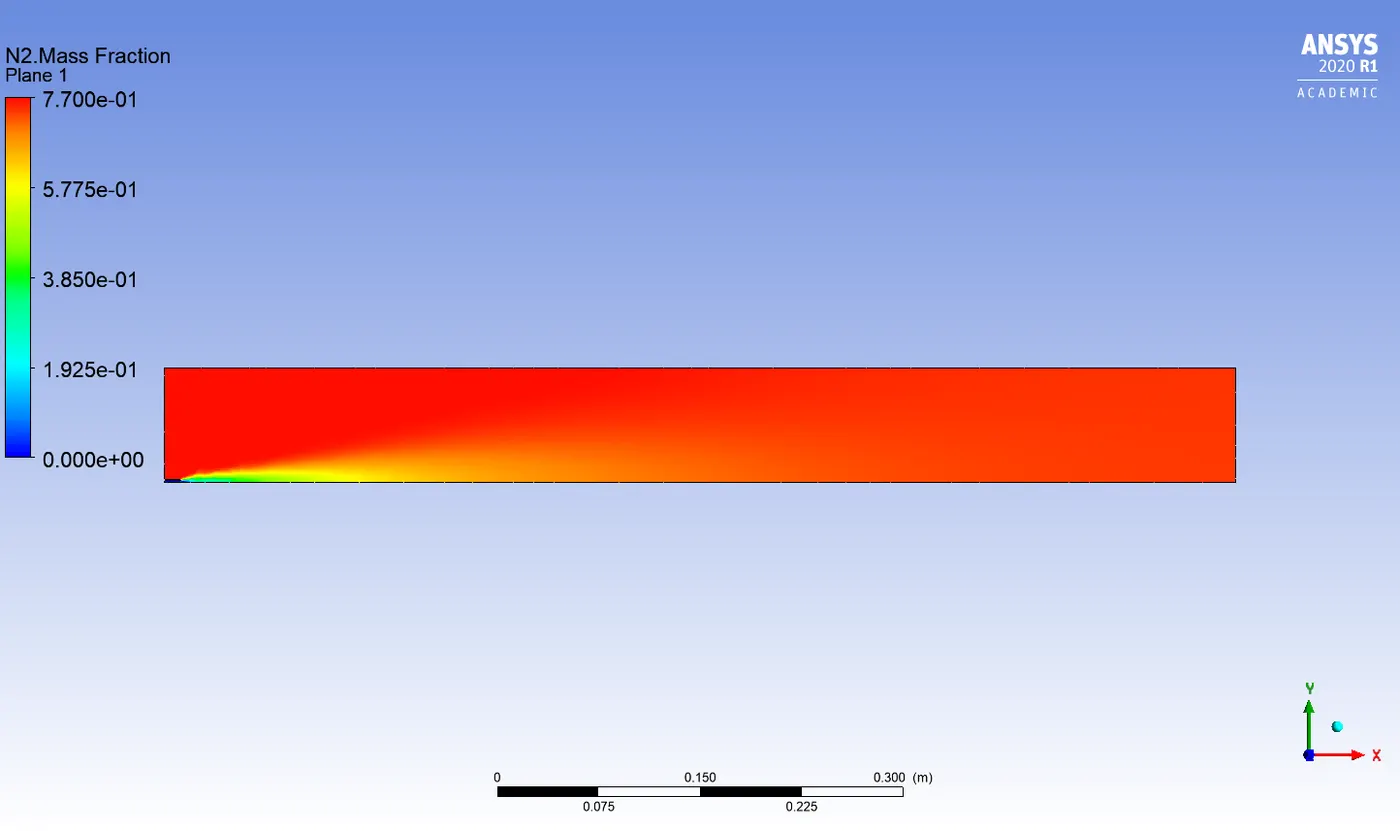
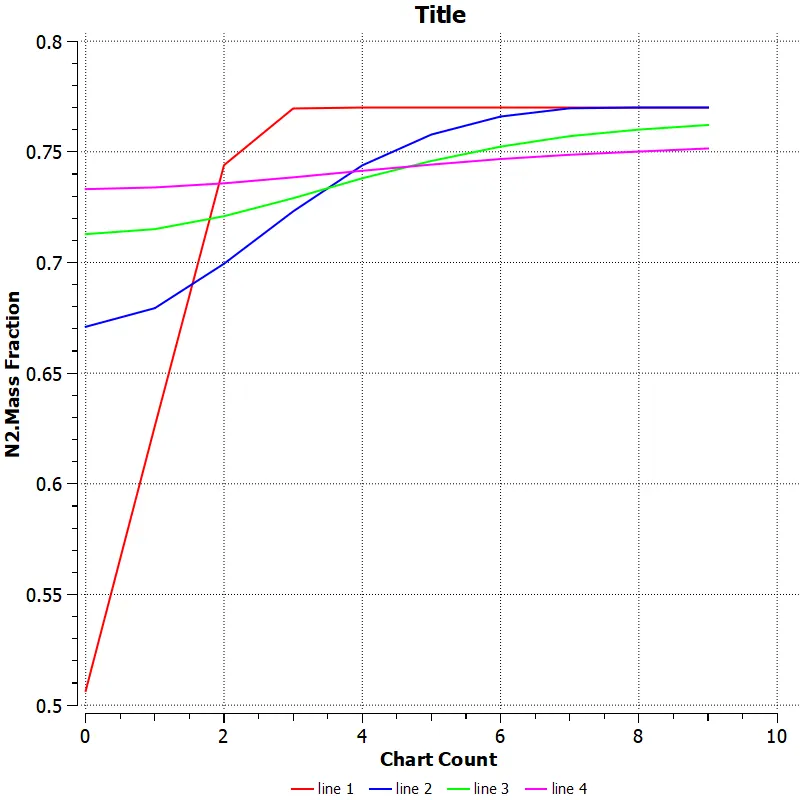
15% water content in fuel
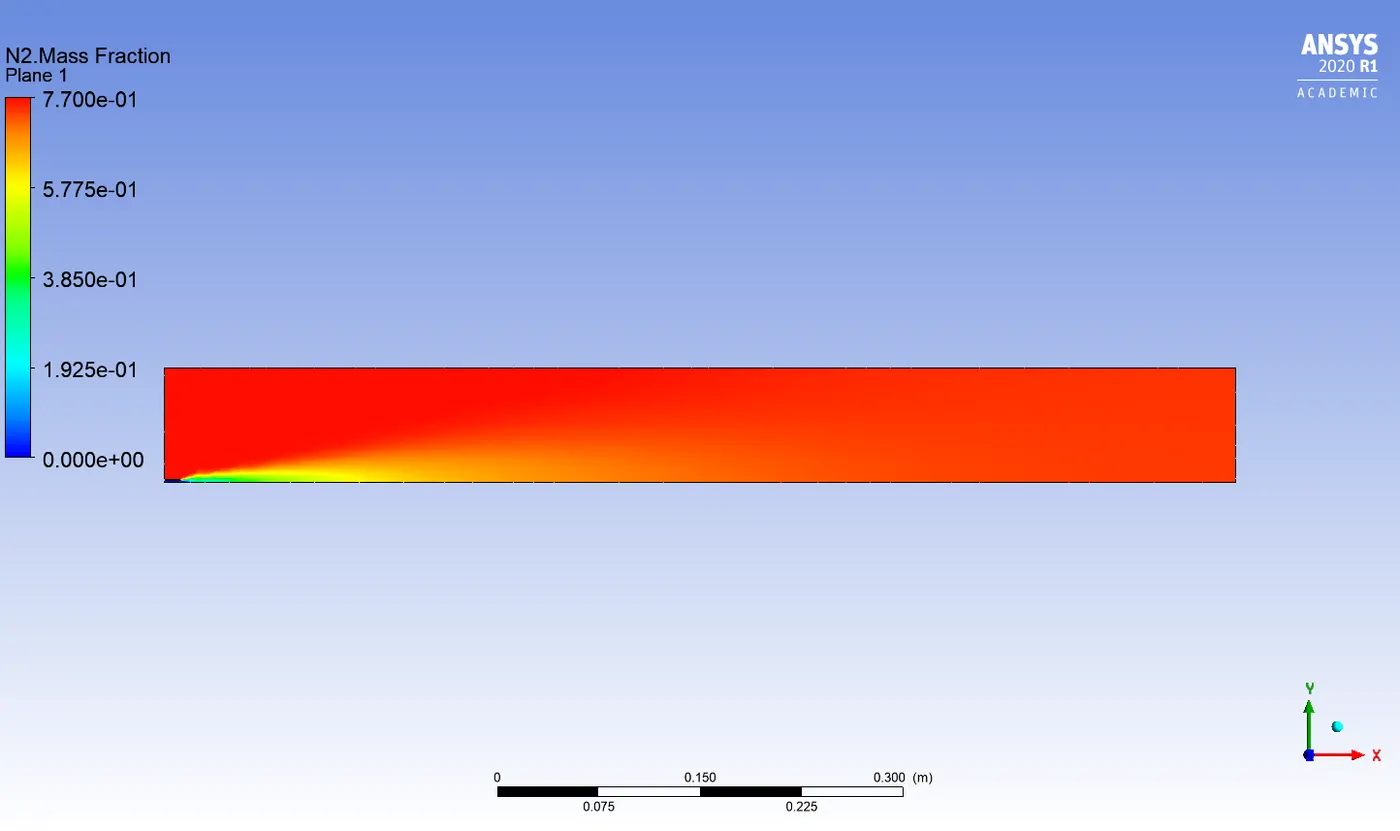
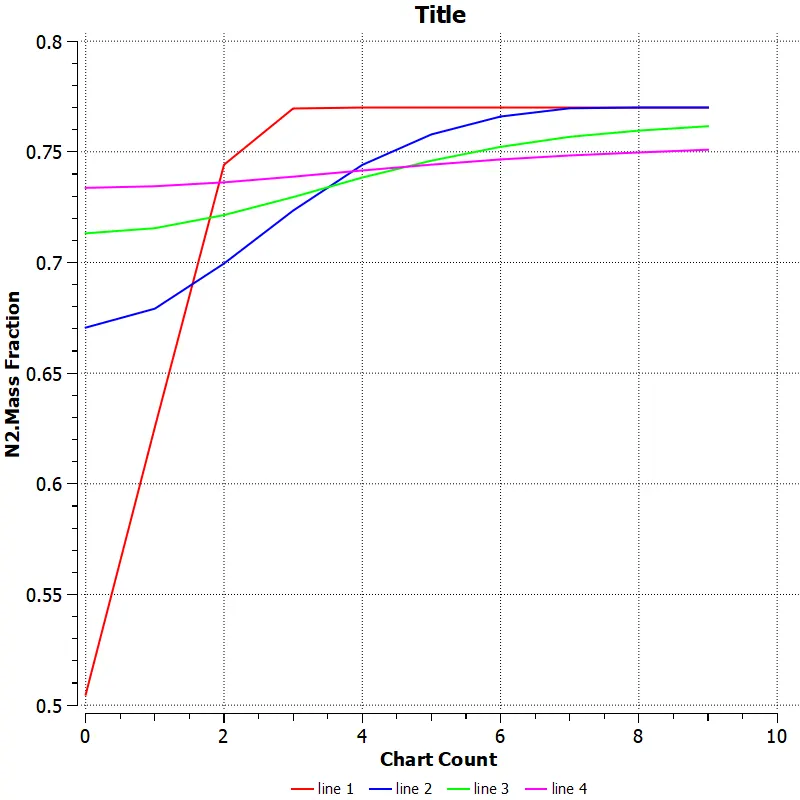
20% water content in fuel
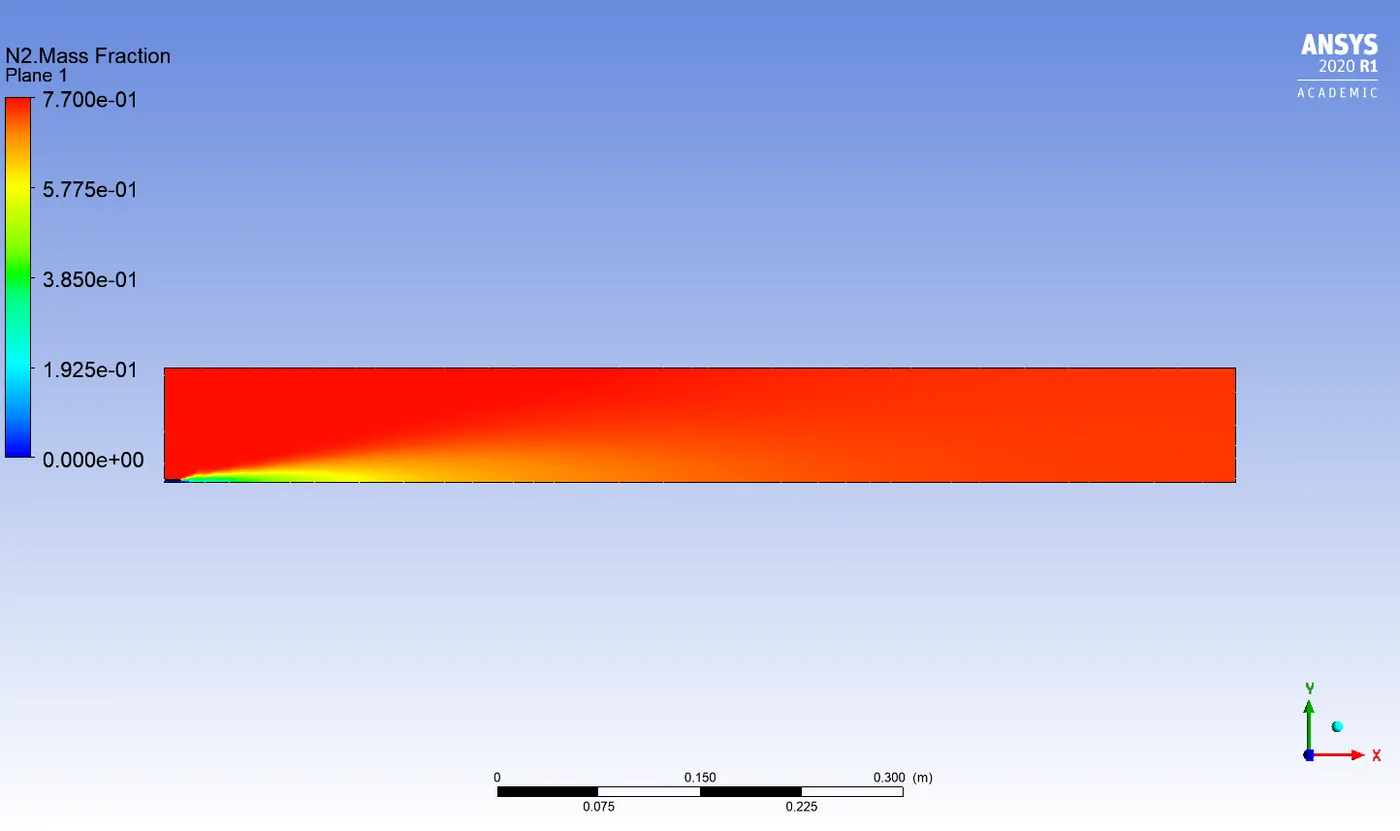
25% water content in fuel
30% water content in fuel
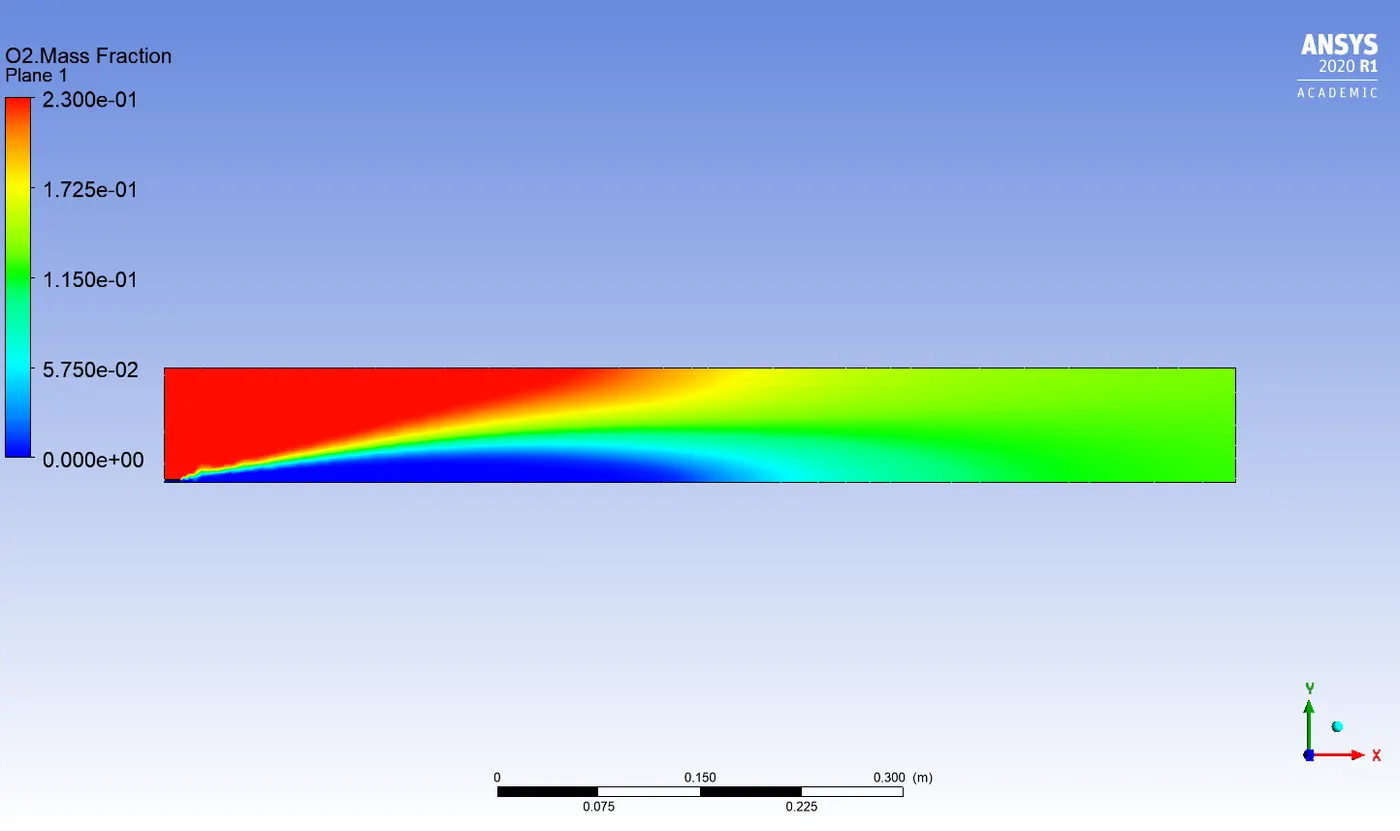
O2 mass fraction :
5% water content in fuel
10% water content in fuel
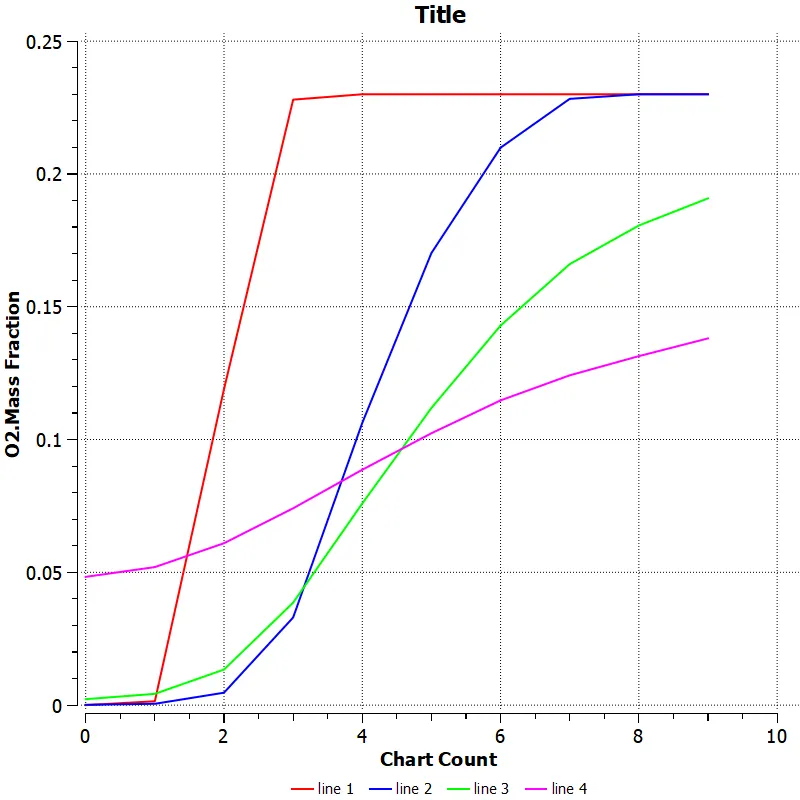
15% water content in fuel
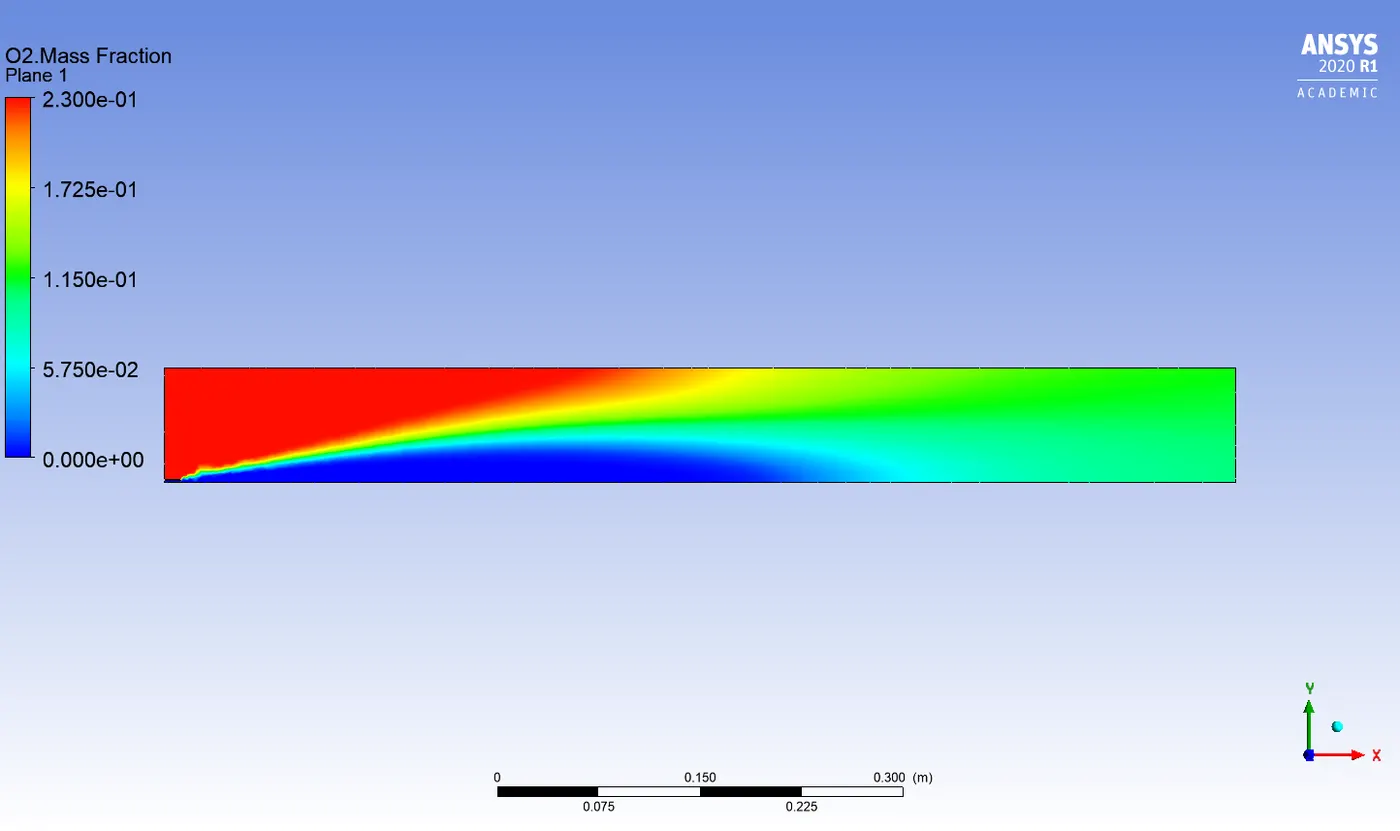
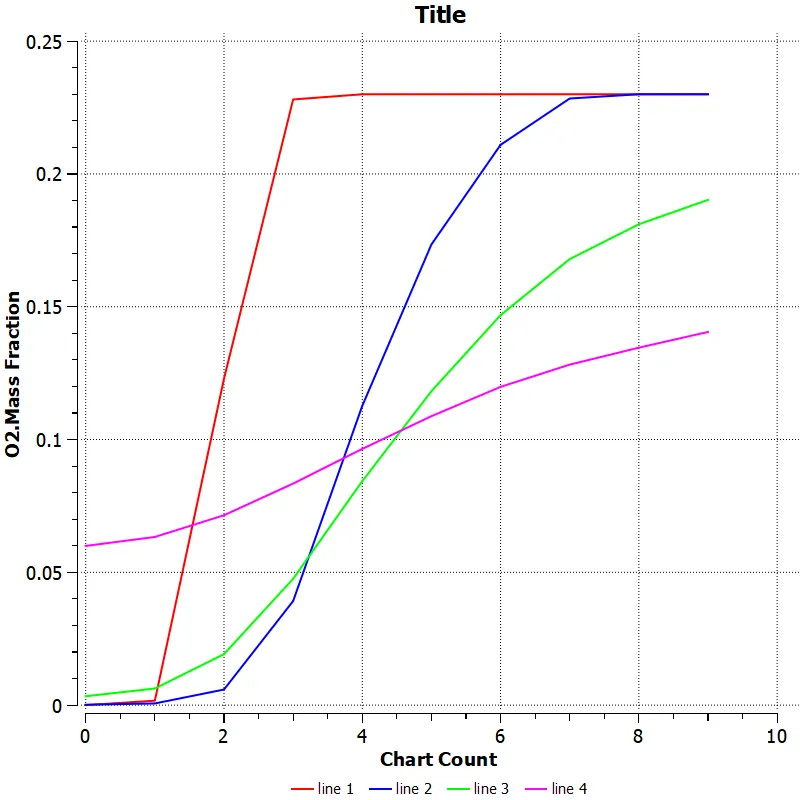
20% water content in fuel
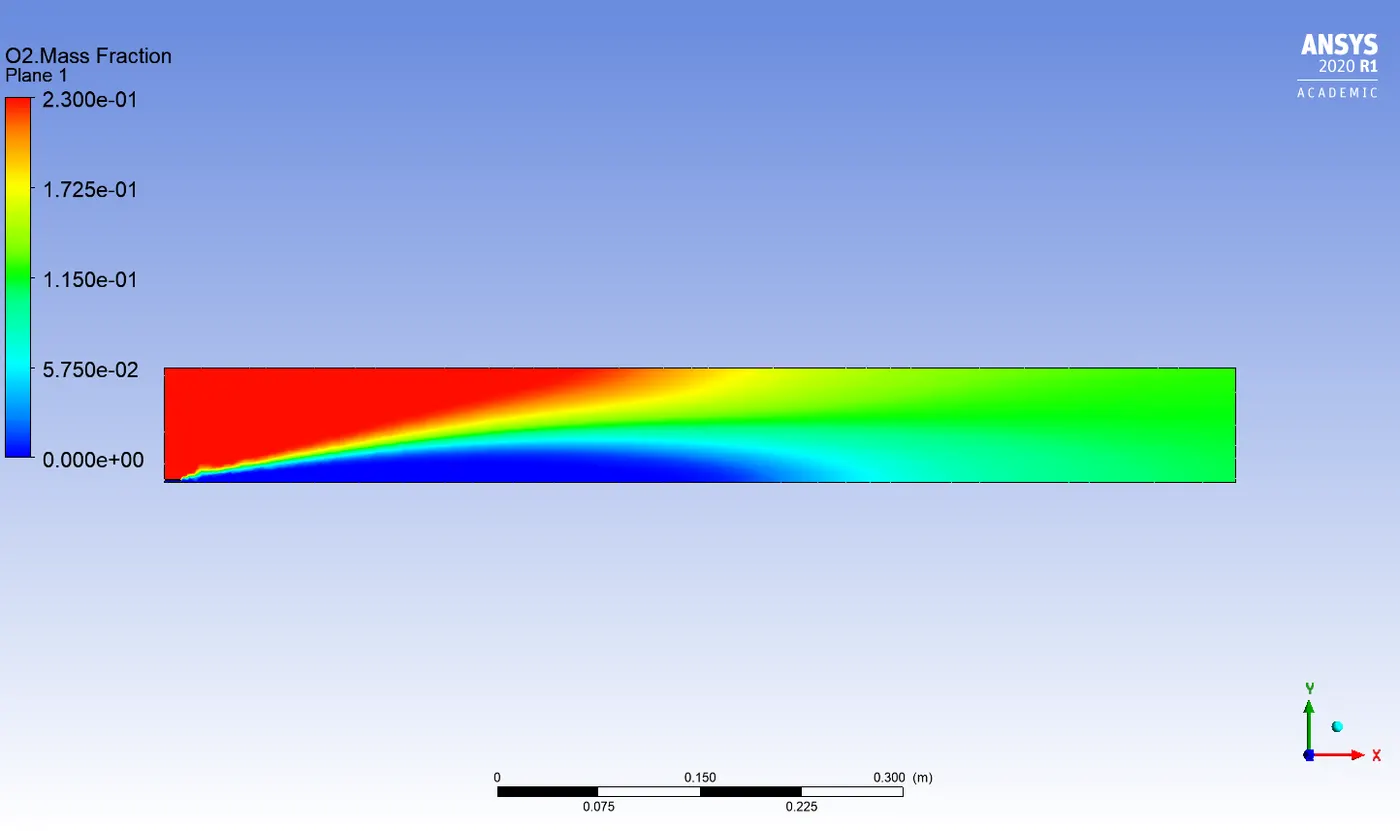
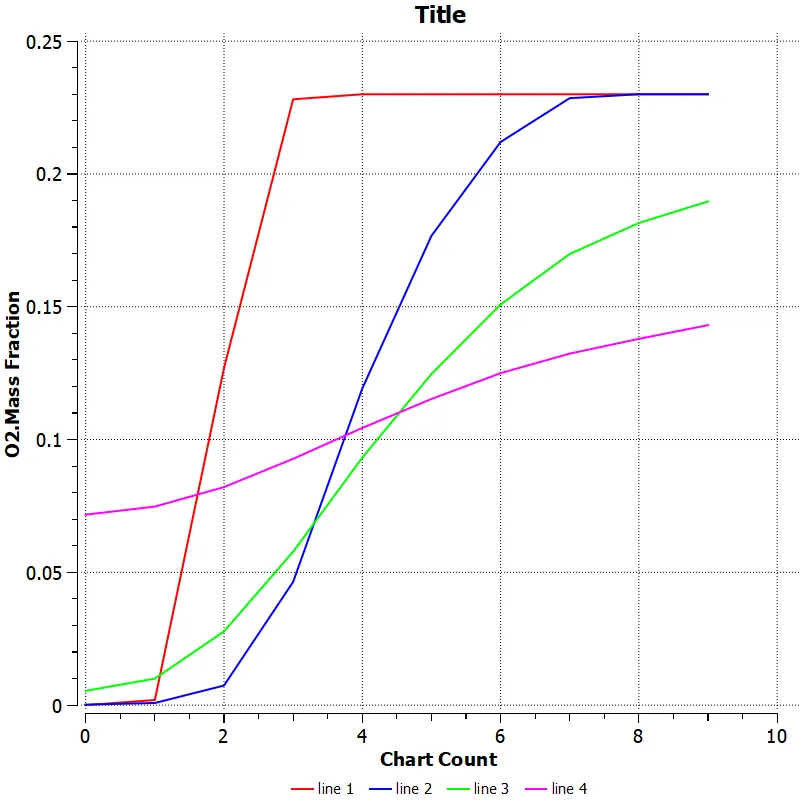
25% water content in fuel
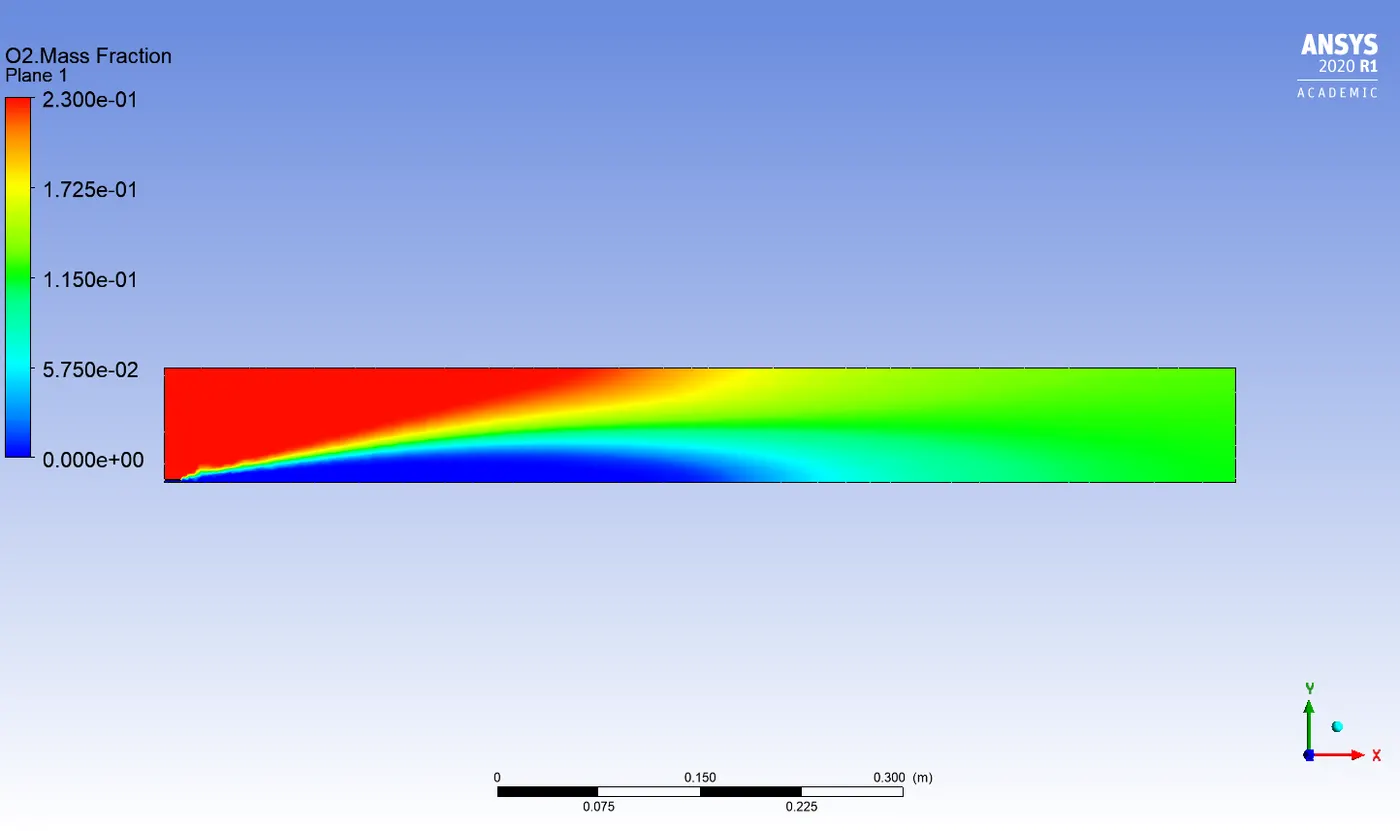
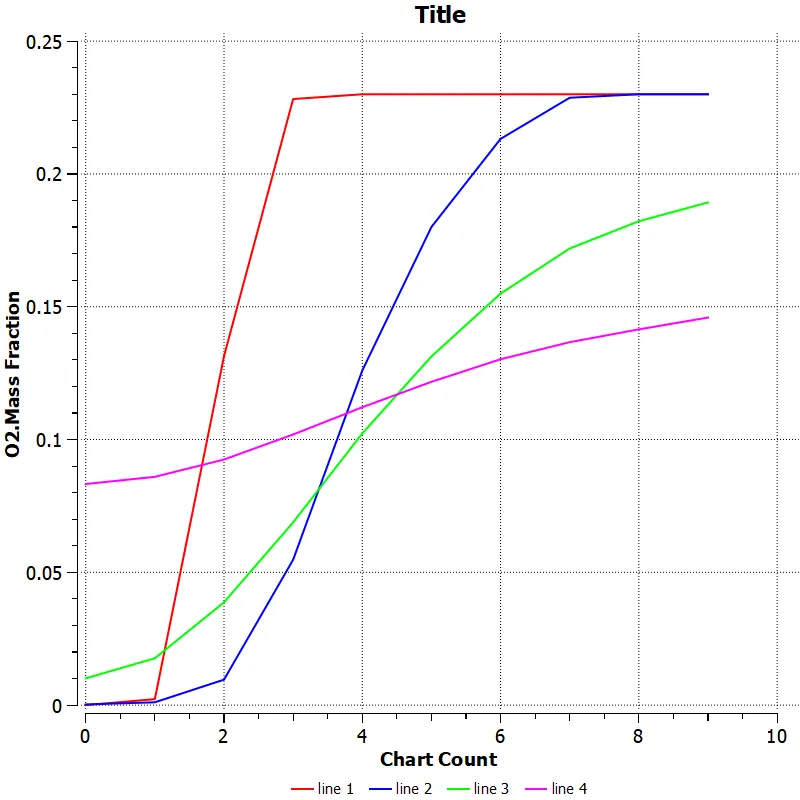
30% water content in fuel
Pollutant NOx mass fraction :
5% water content in fuel
10% water content in fuel
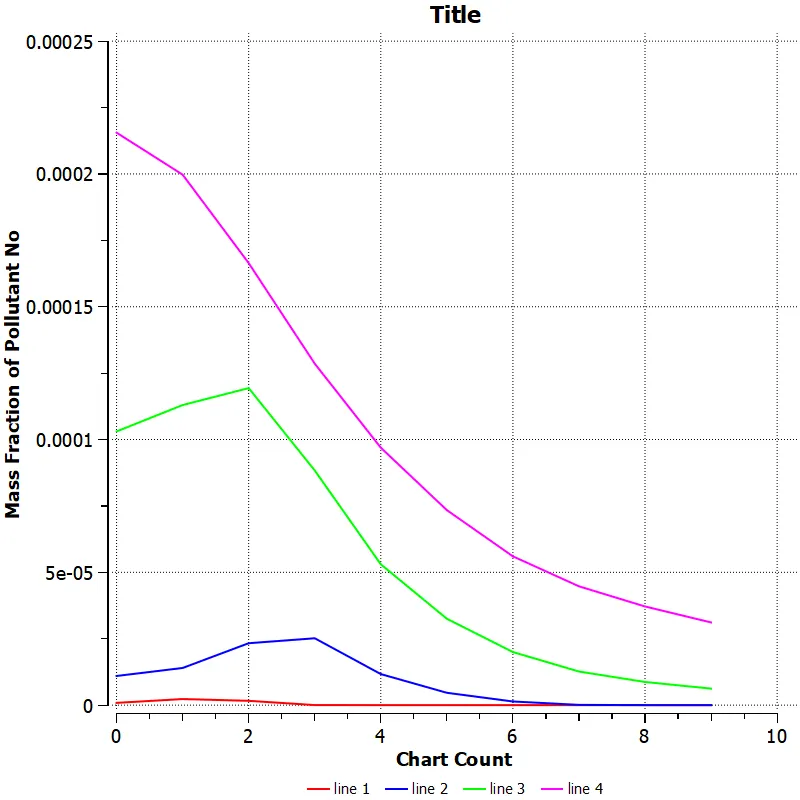
15% water content in fuel
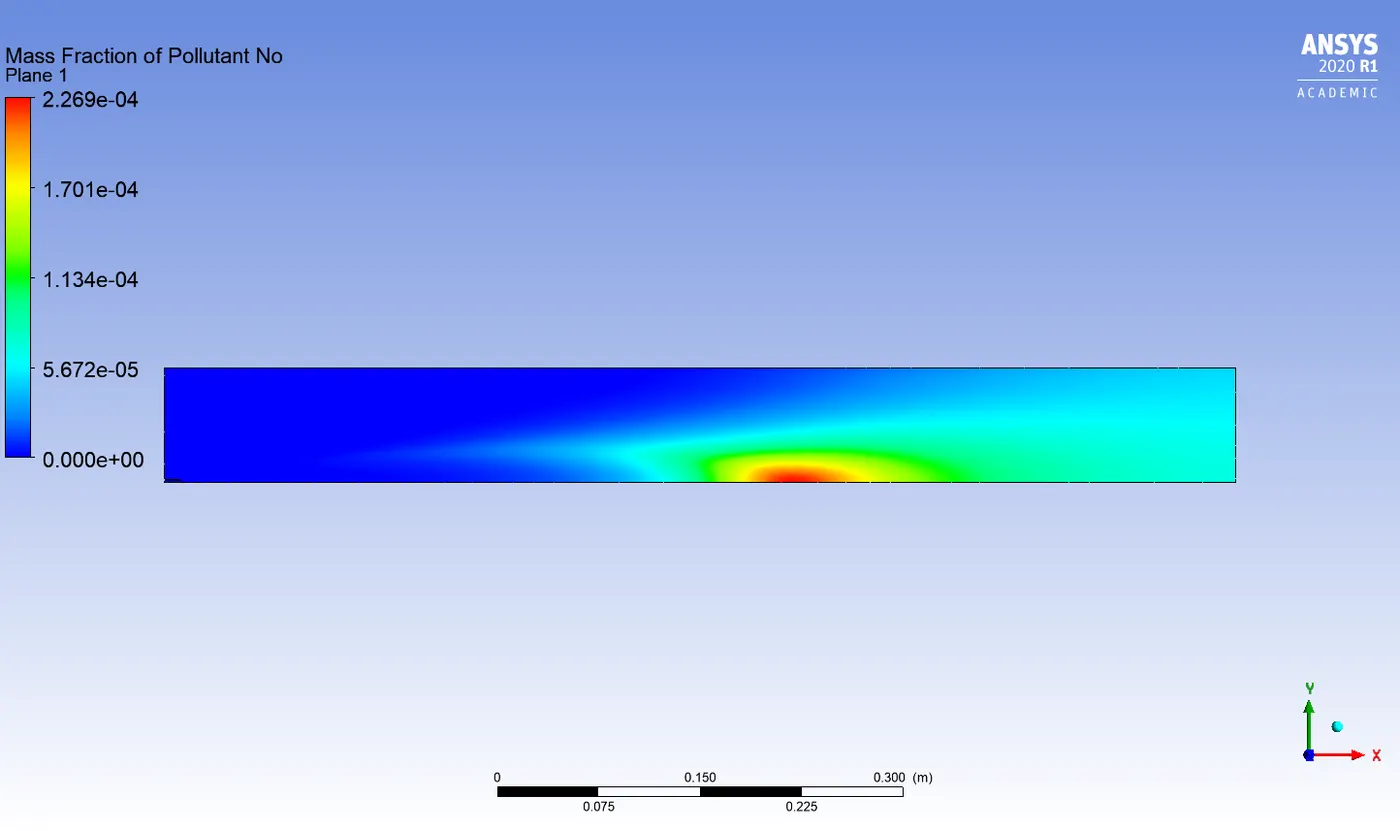
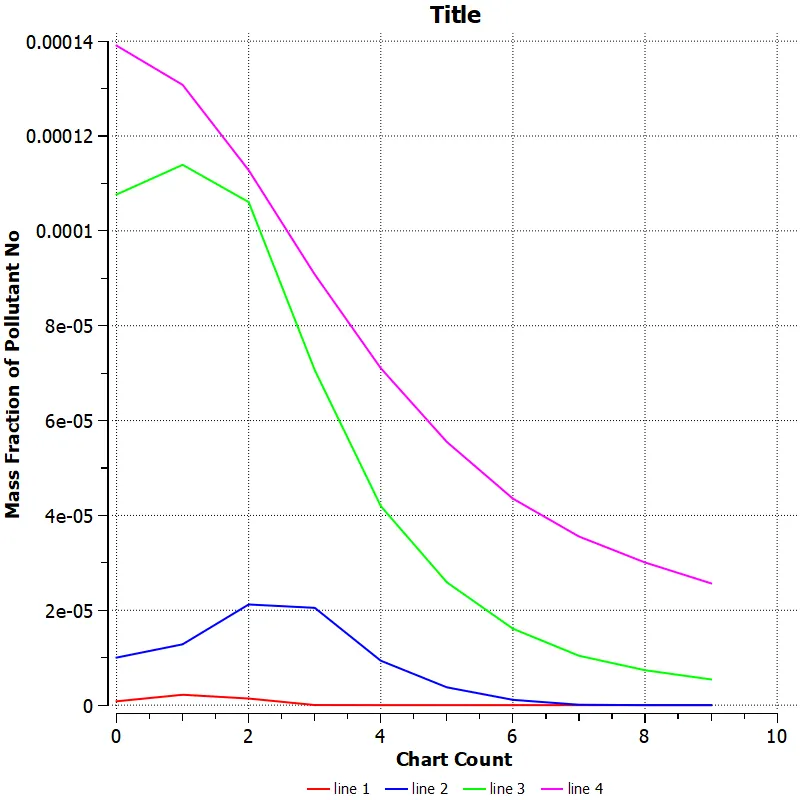
20% water content in fuel
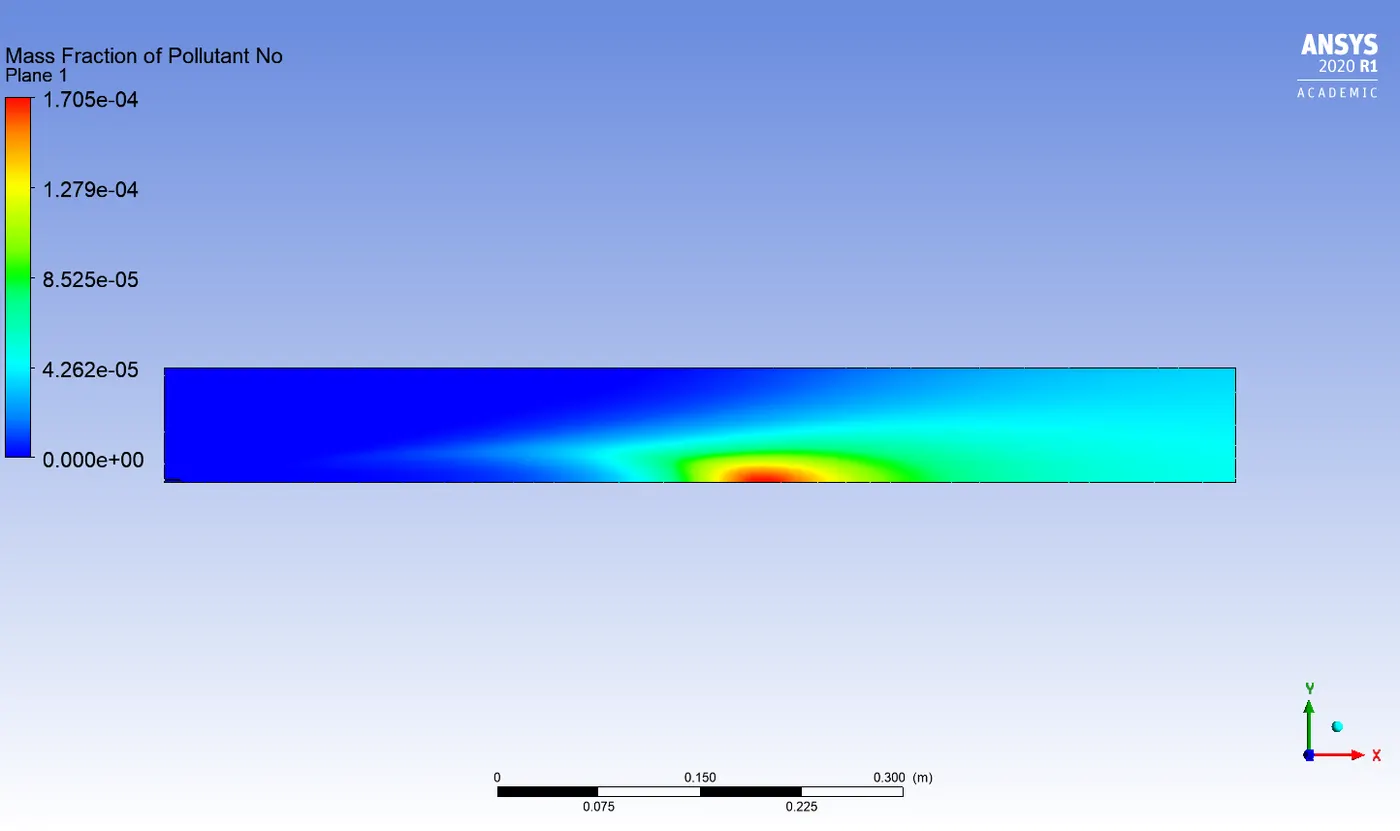
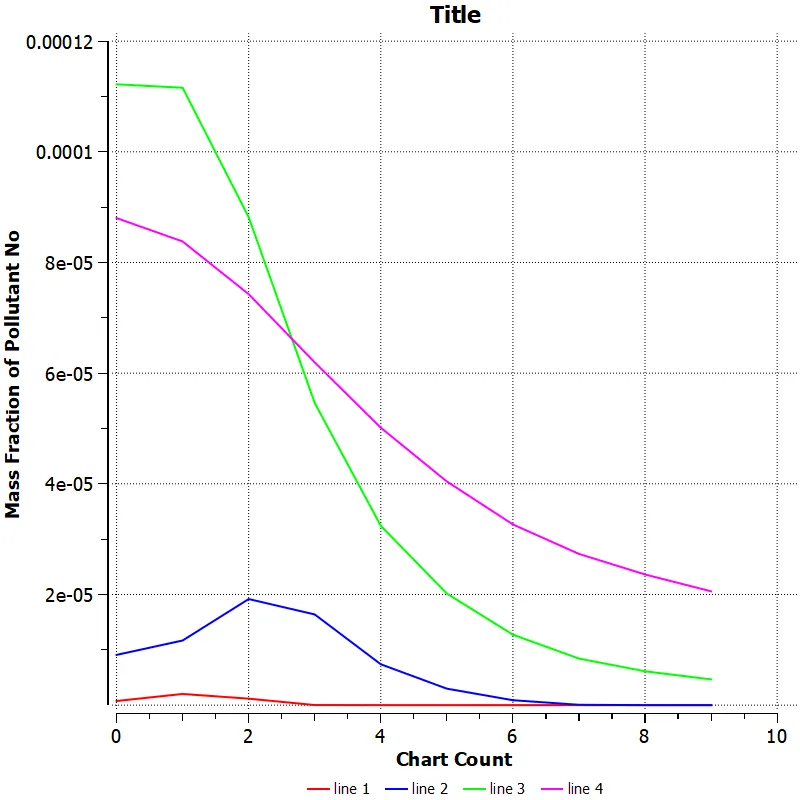
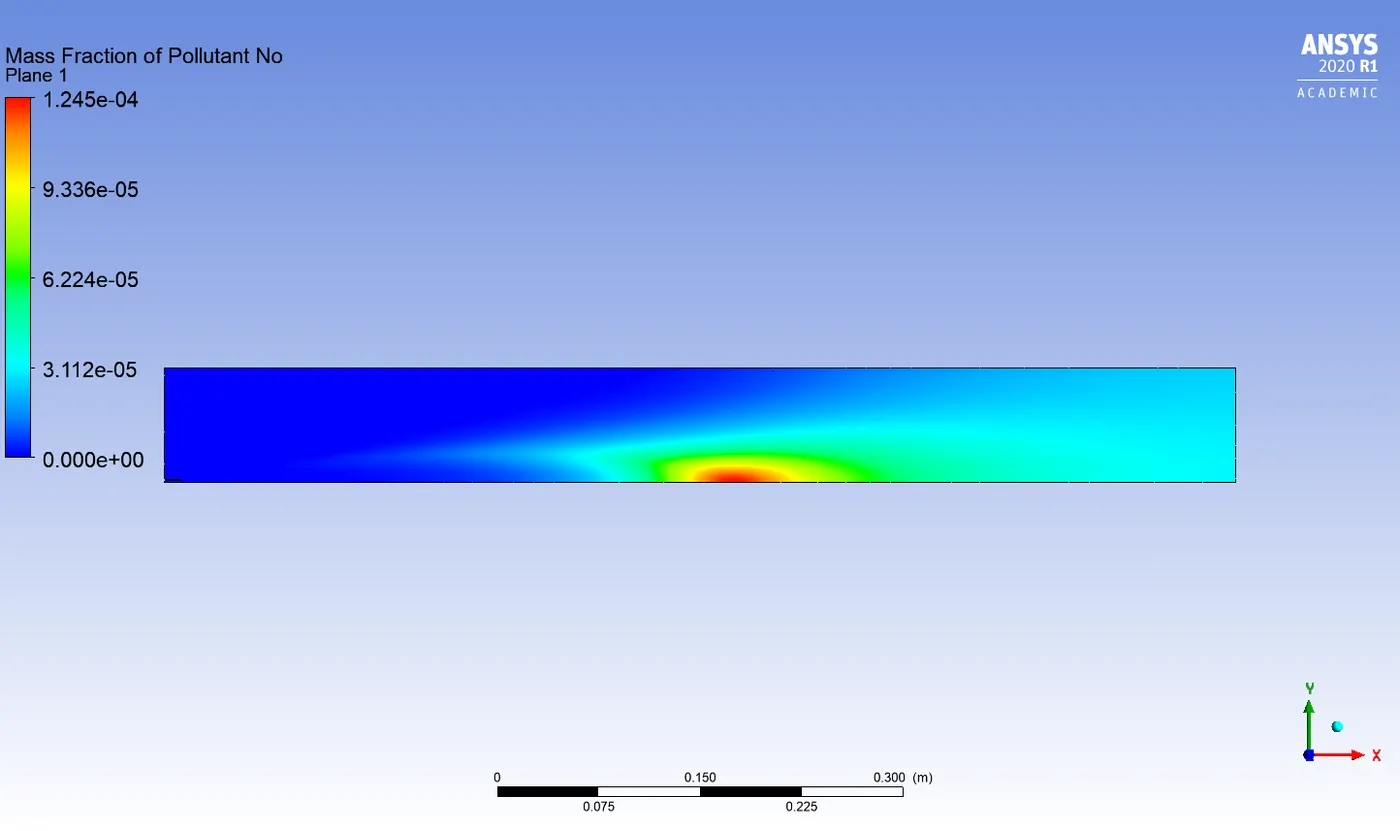
25% water content in fuel
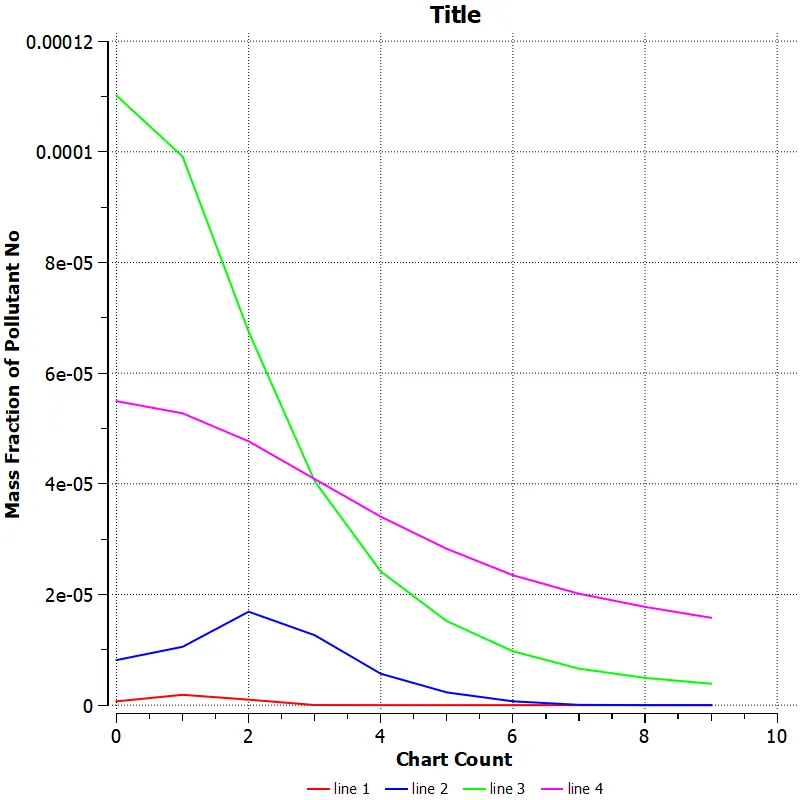
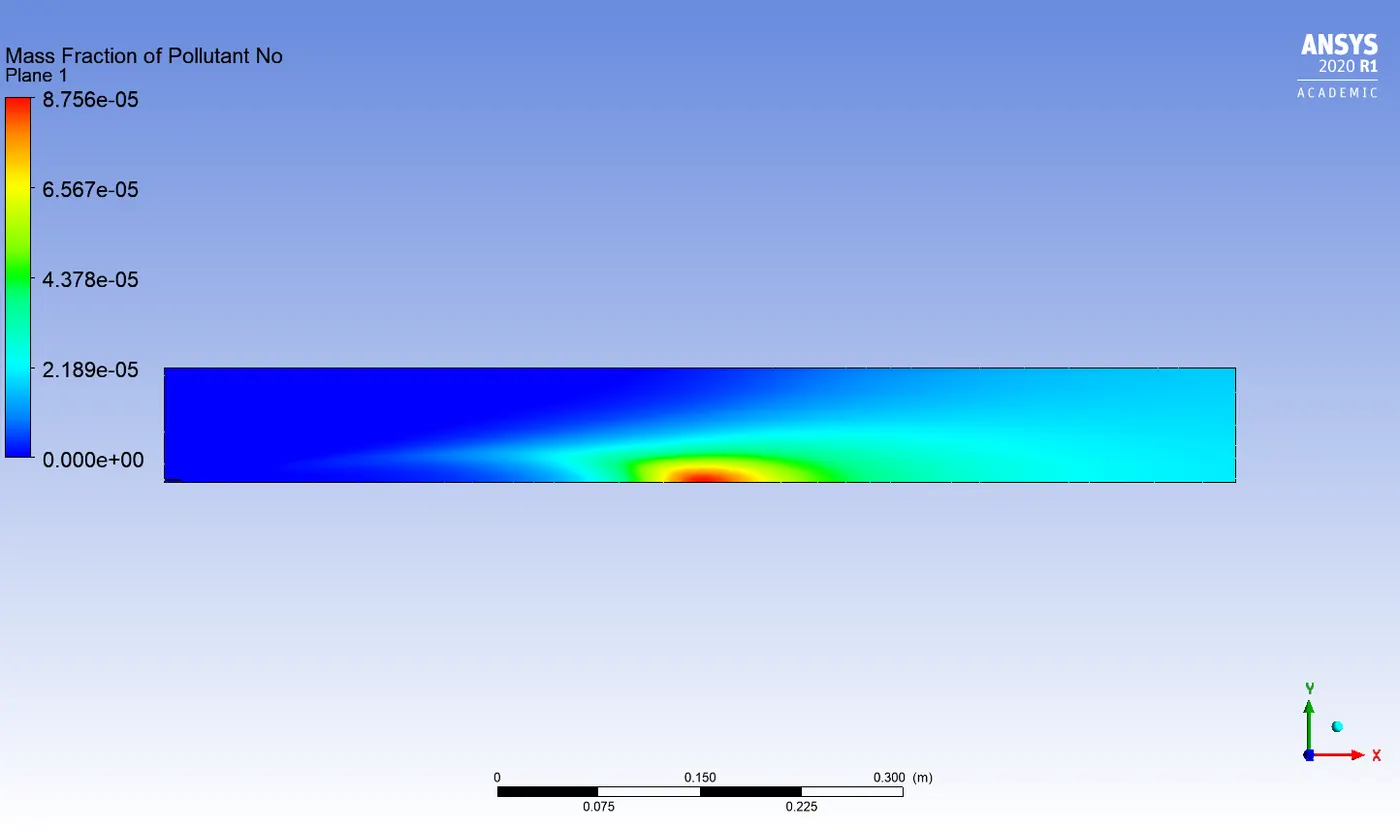
30% water content in fuel
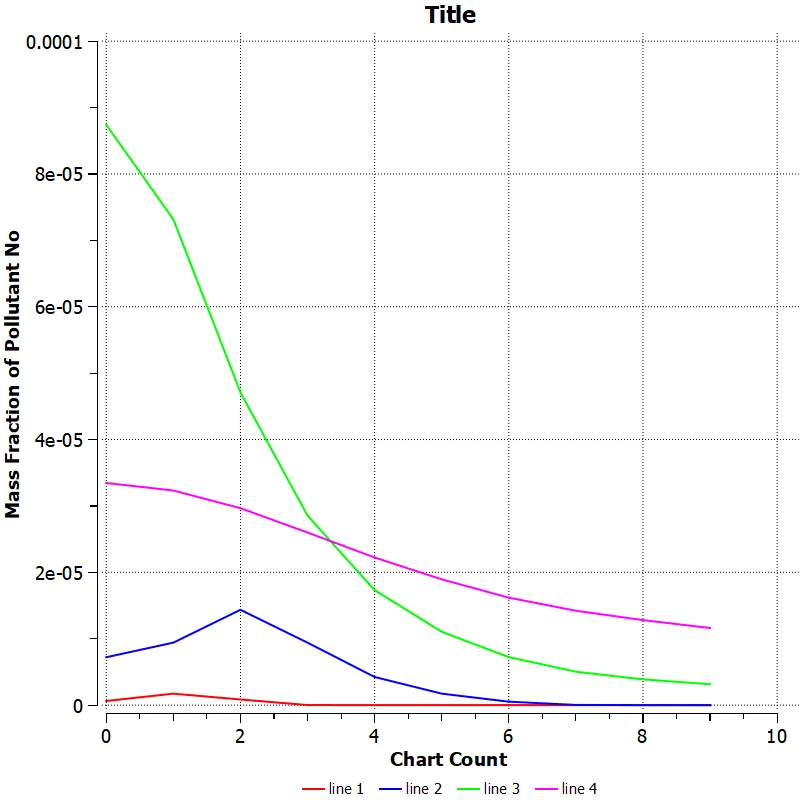
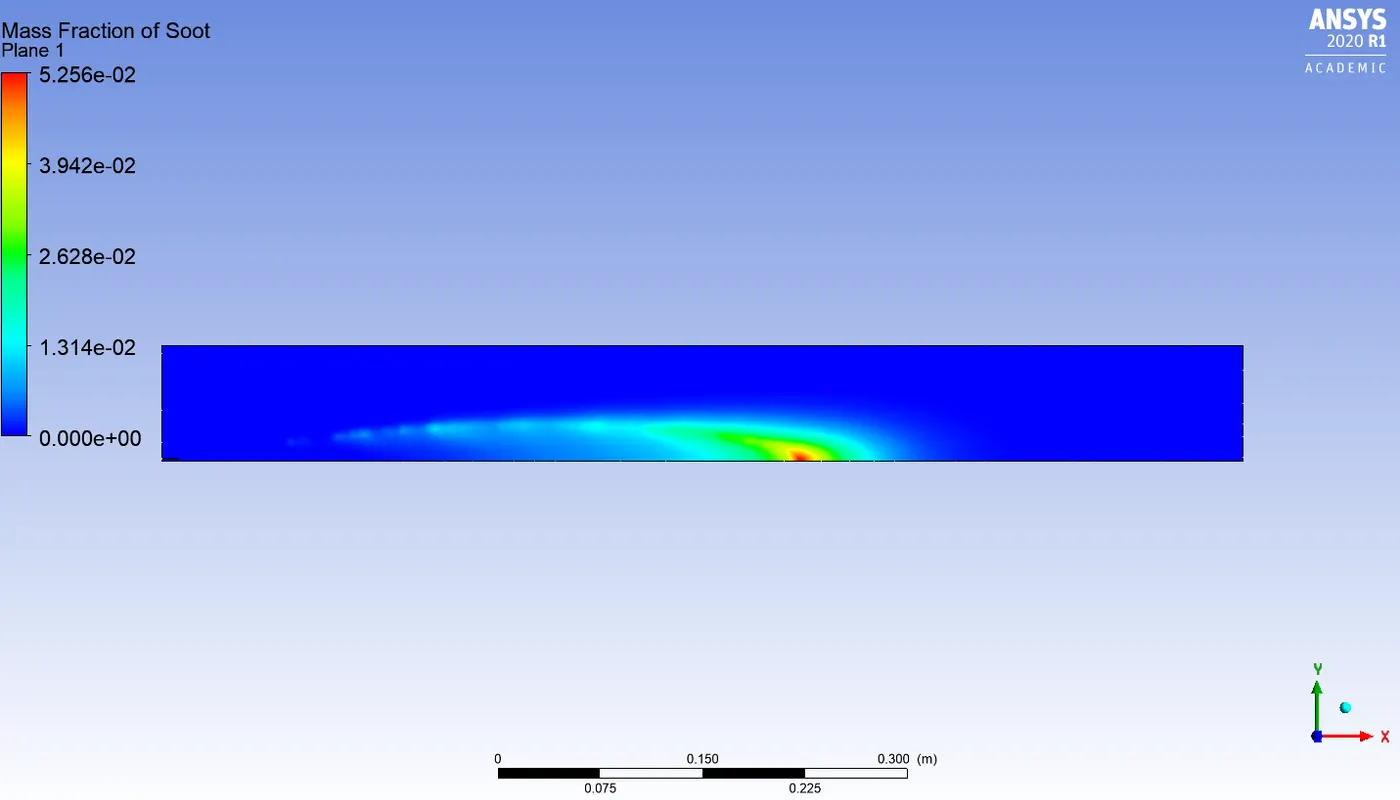
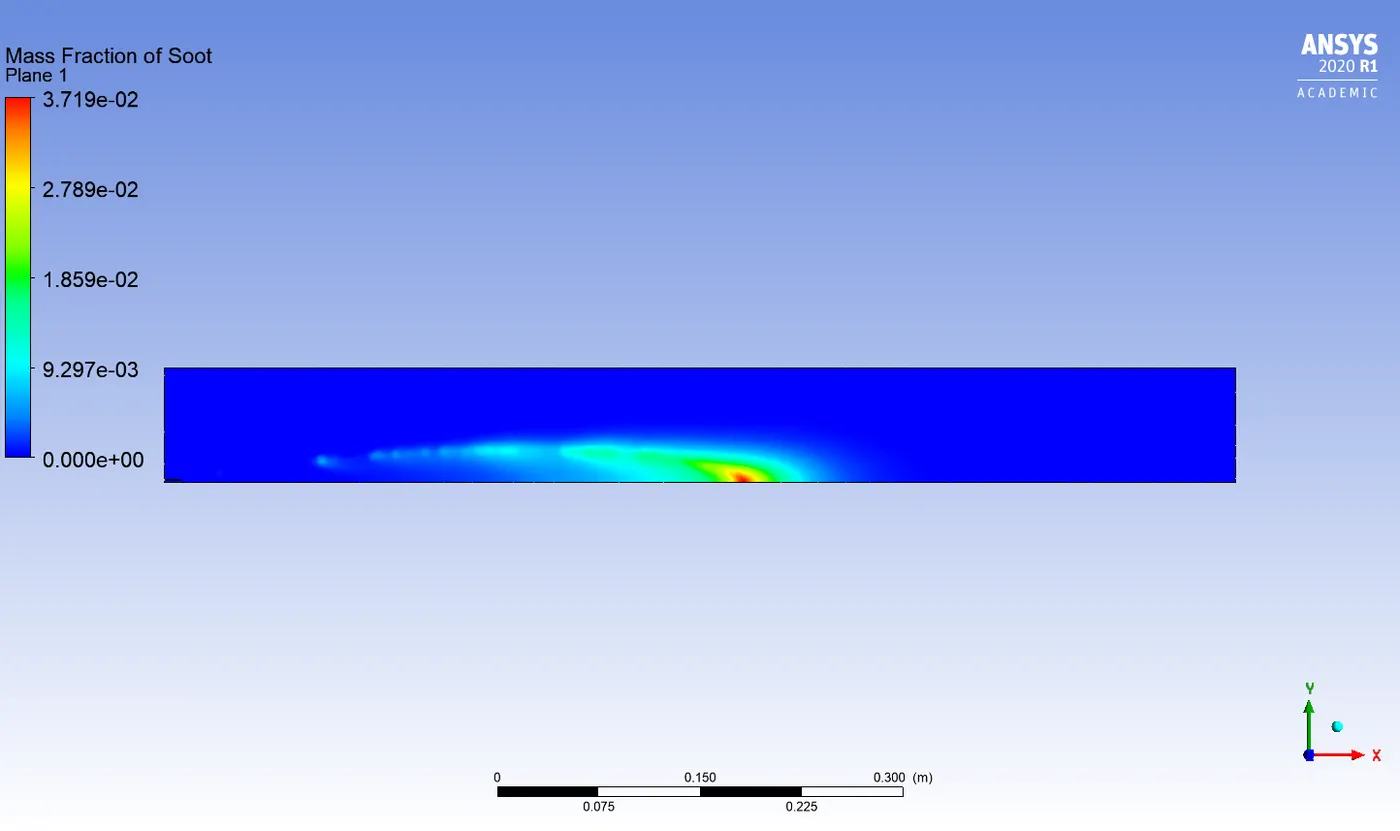
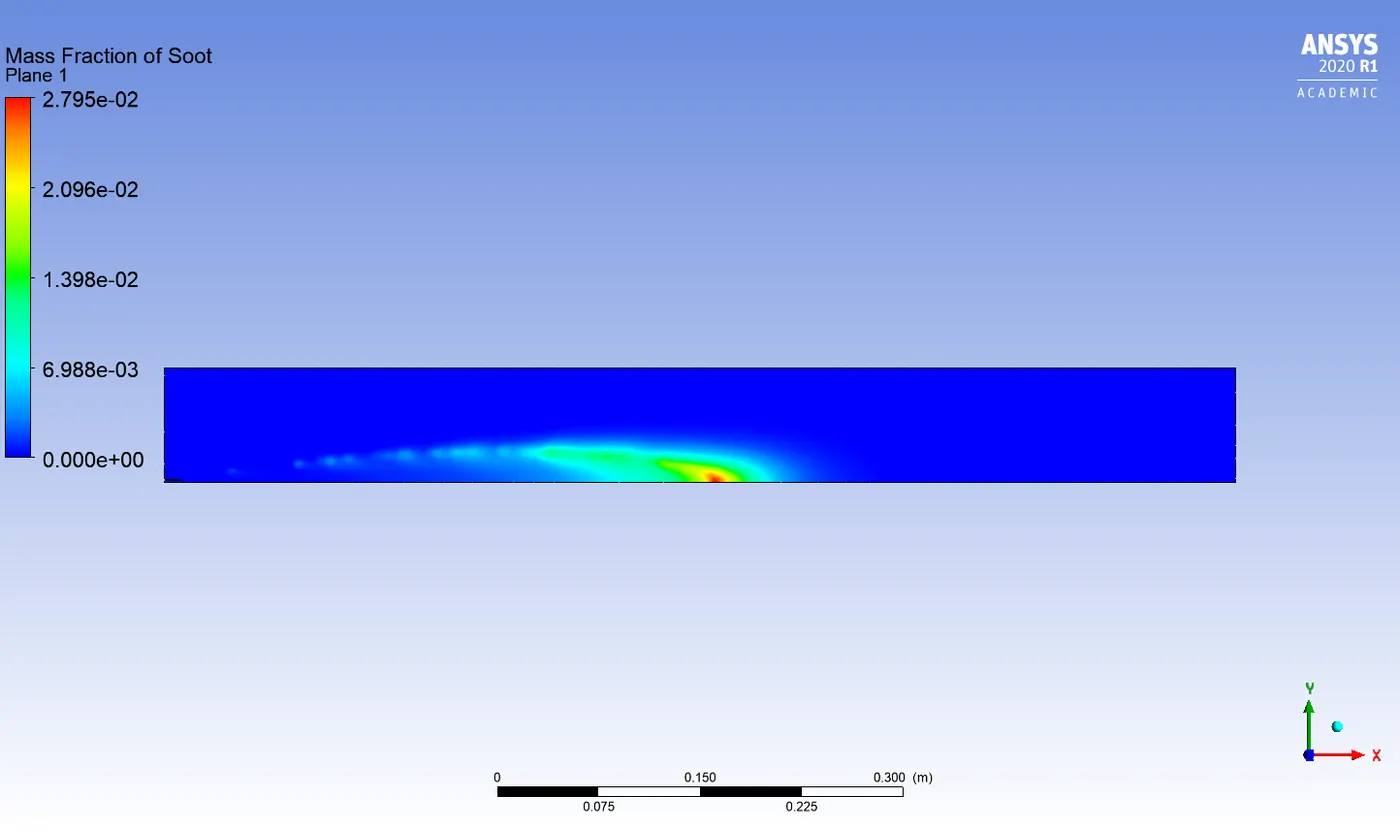
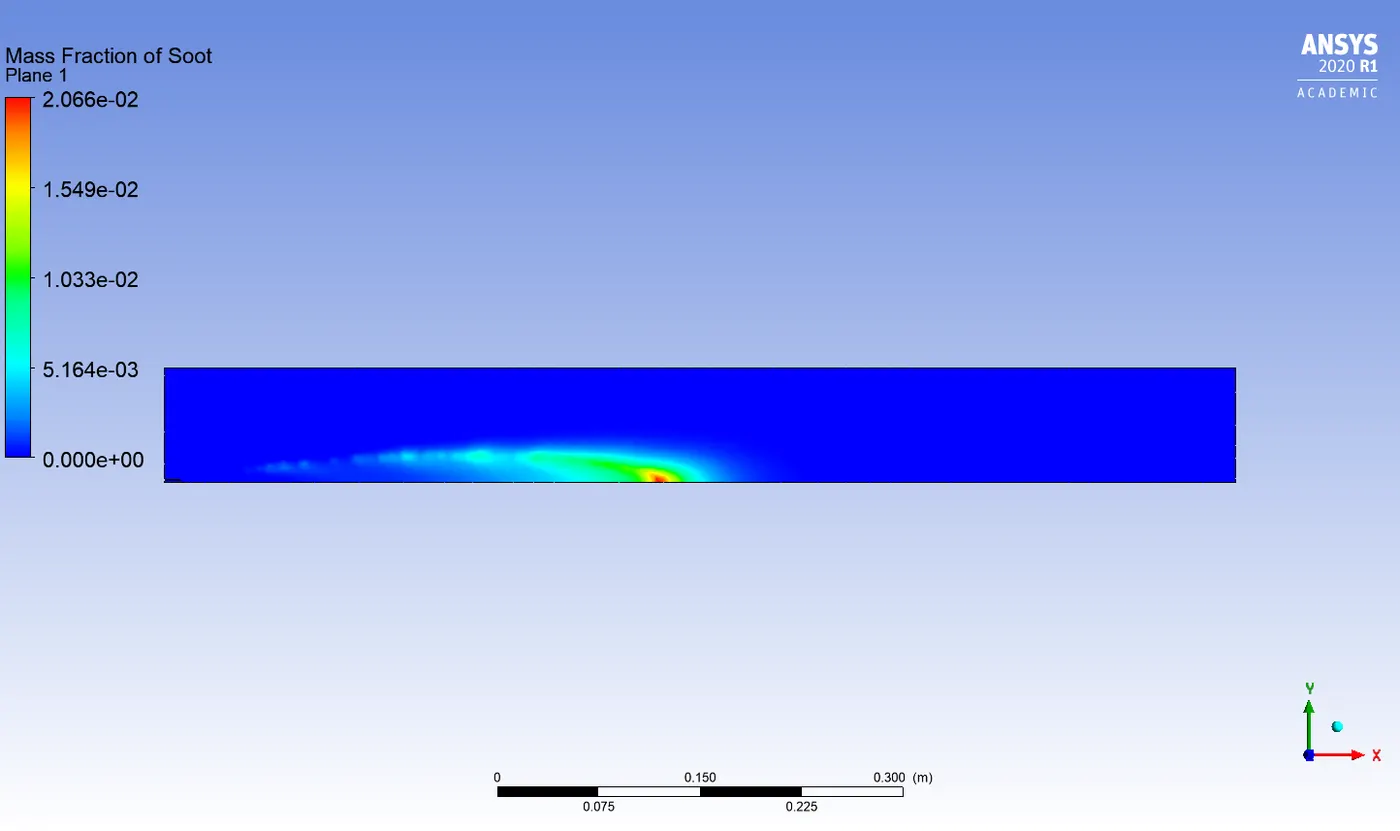
Pollutant soot mass fraction :
5% water content in fuel
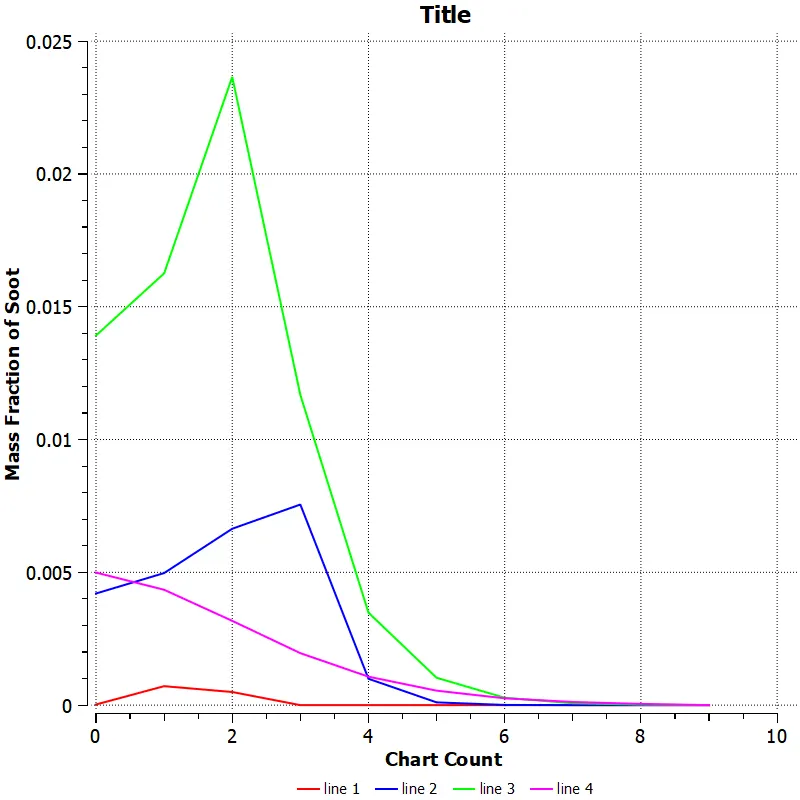
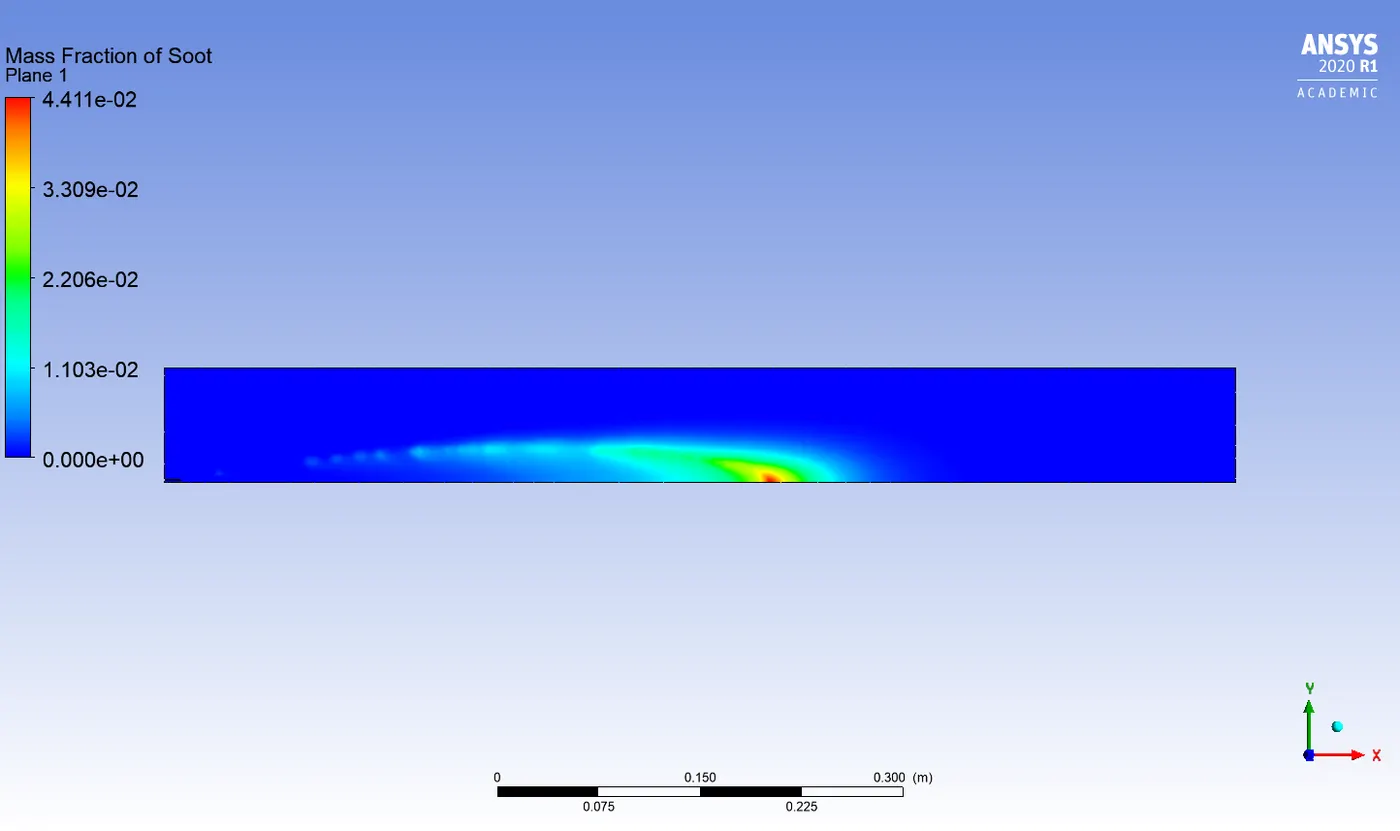
10% water content in fuel
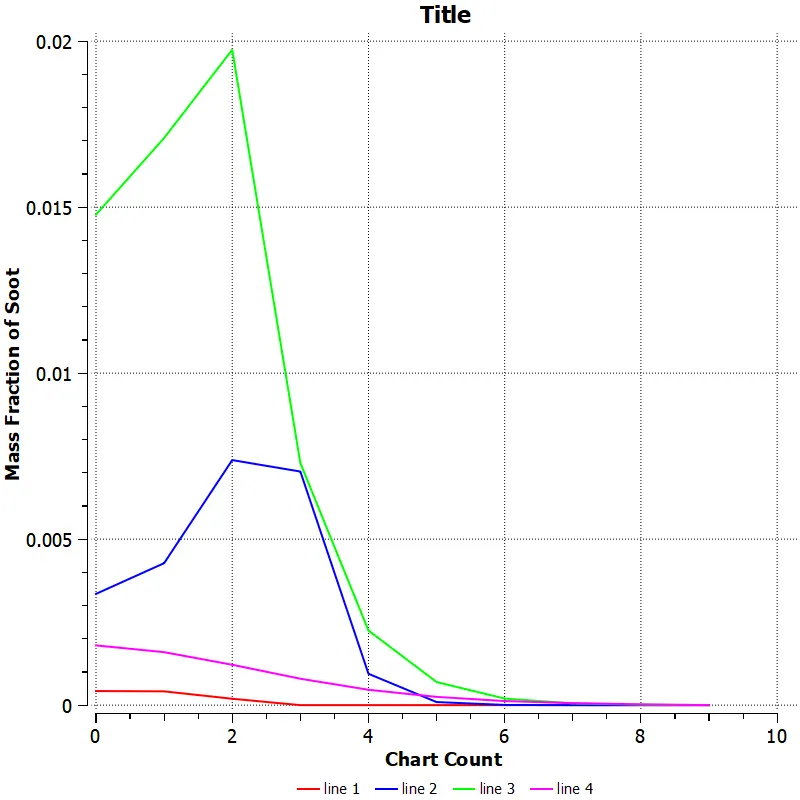
15% water content in fuel
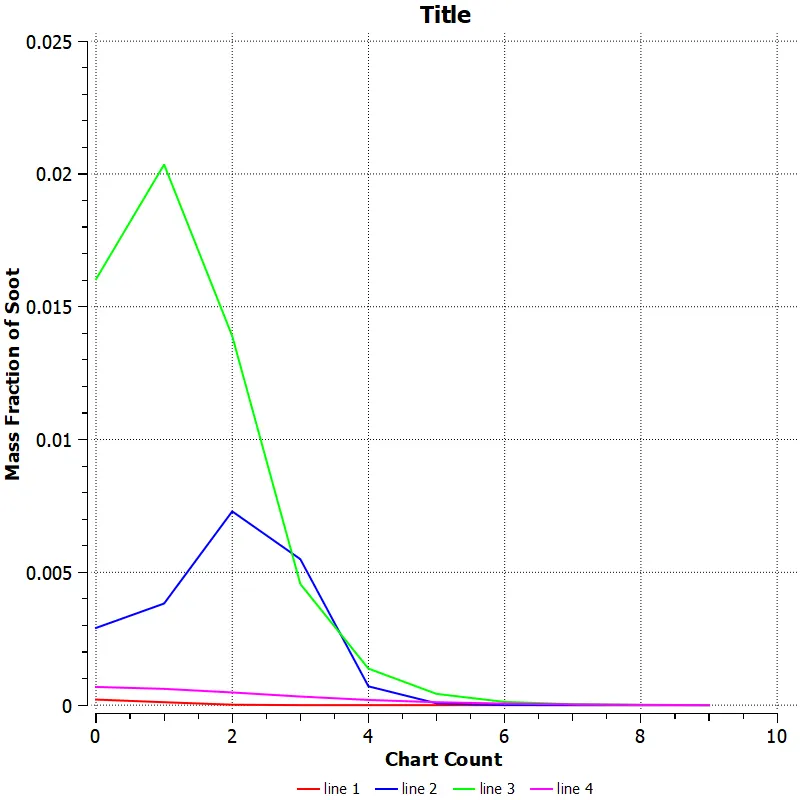
20% water content in fuel
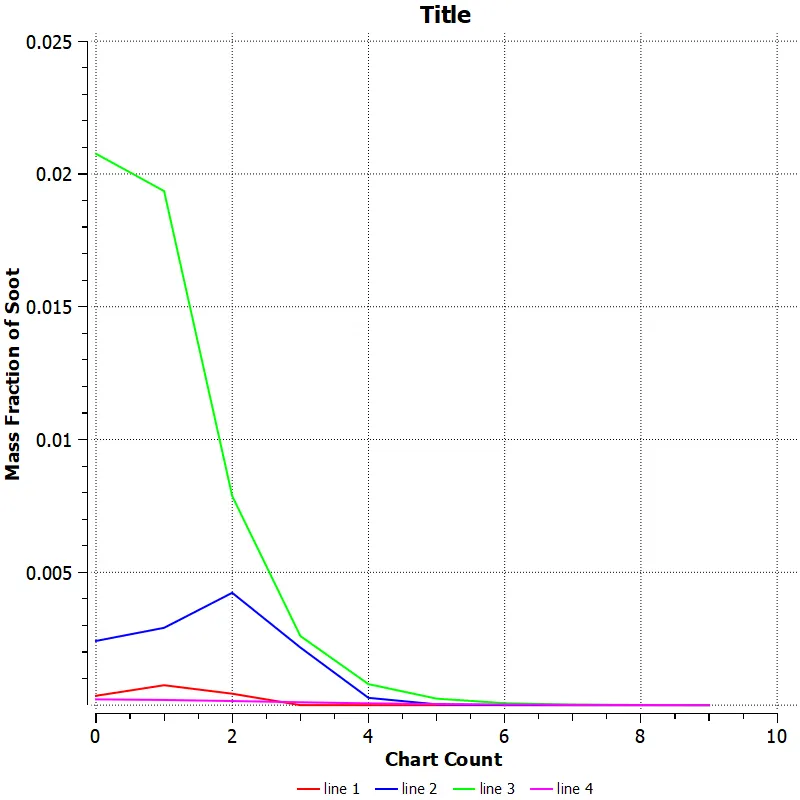
25% water content in fuel
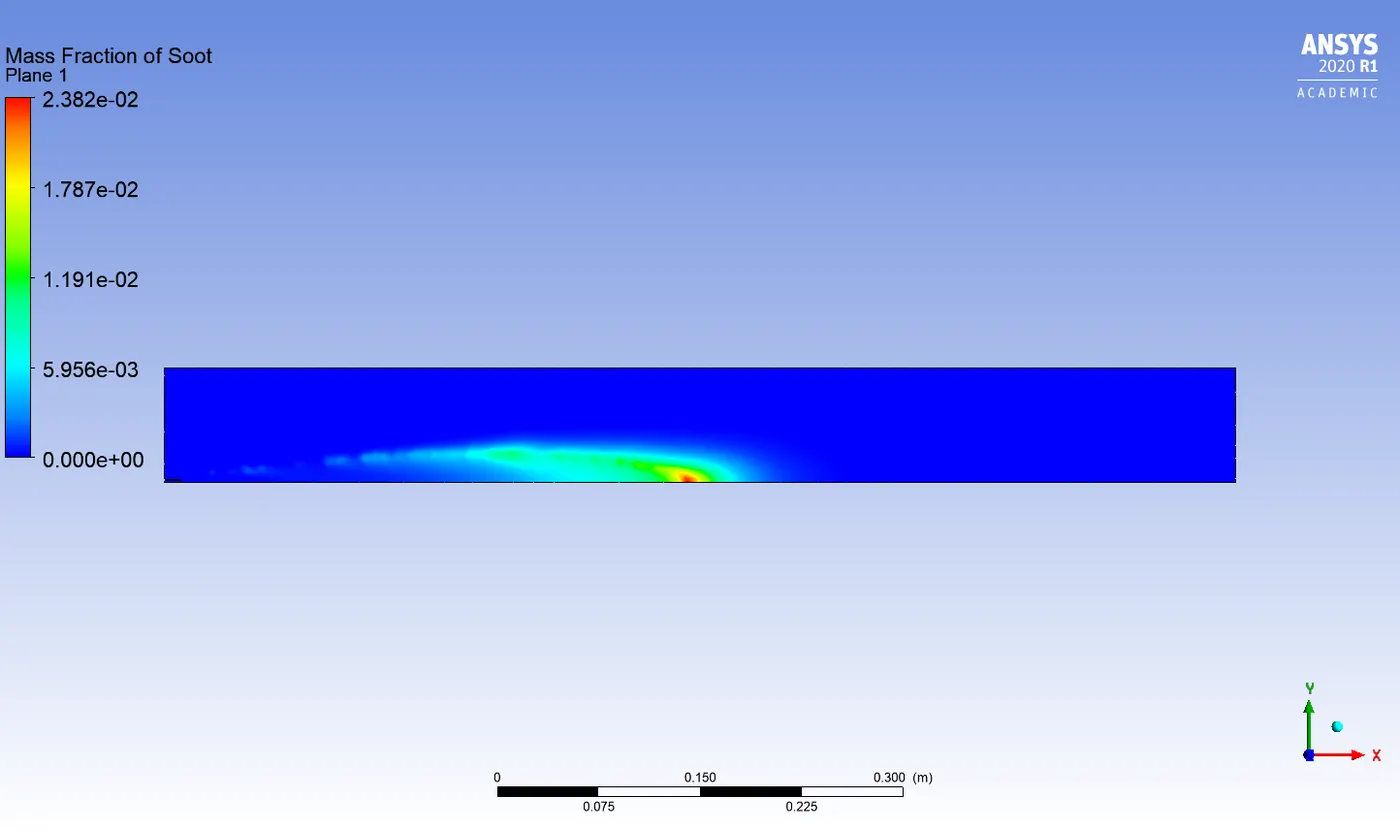
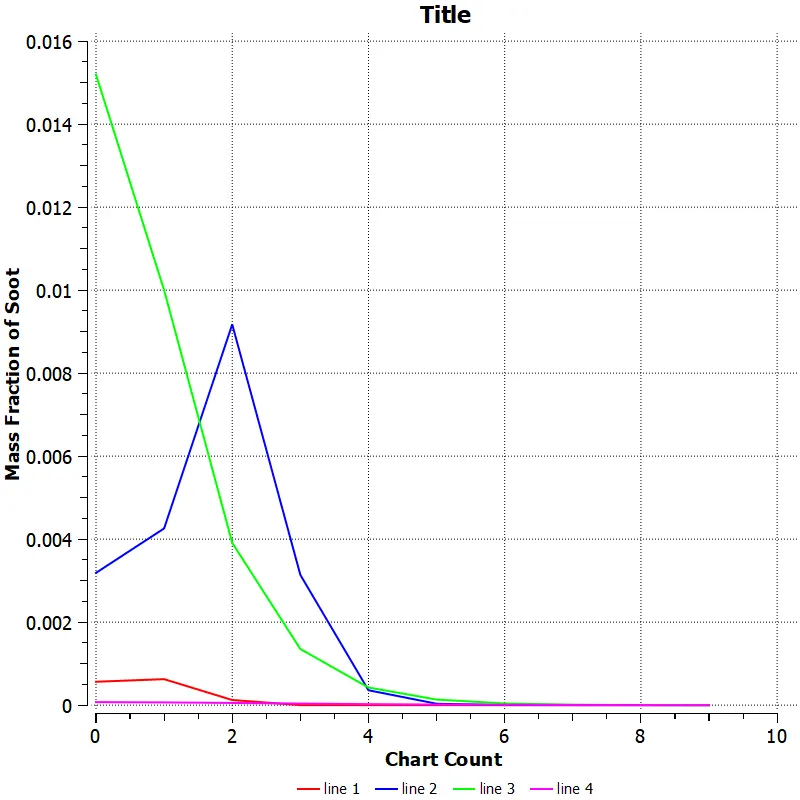
30% water content in fuel
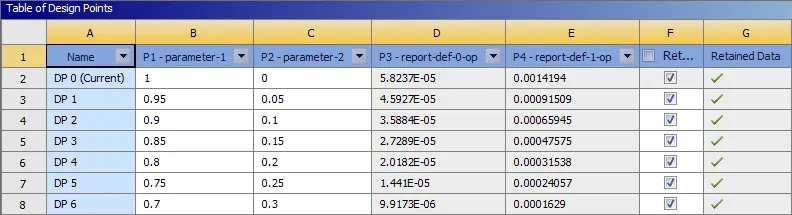
Parametric table
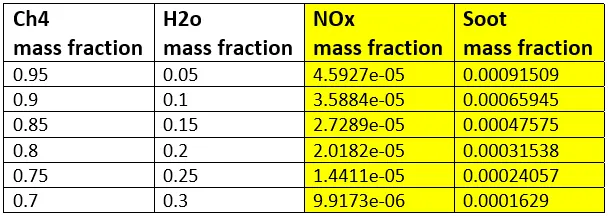
Variation of mass fraction of NOx and soot as water is added to fuel from 5% to 30% by mole
Observation from part 2 simulation
1. The temperature drops from 2302 K to 2229 K as the water content is increased from 5% to 30% in the fuel.
2. The mass fraction of Co increases from 0.02 to 0.04 as the water content is increased in the fuel.
3. No variation of N2 and O2 mass fraction is observed.
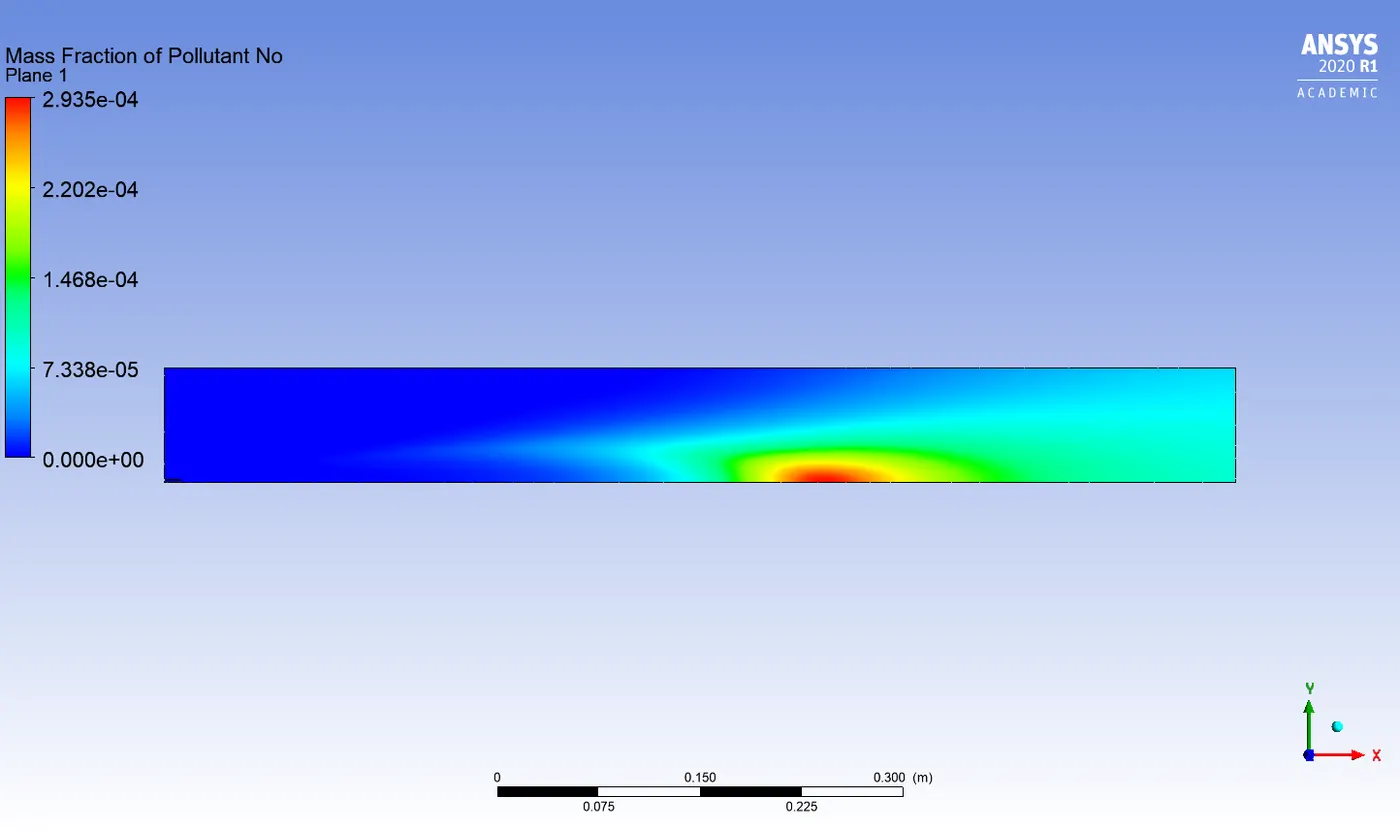
4. The mass fraction of pollutants like NOx and soot decreases as the water content in the fuel is increased.
Conclusion
In this project, the mass fraction of pollutants from NOx emission and soot formation is predicted with the help of physical and mathematical models incorparated in the CFD software ANSYS fluent. The results obtained from the simulation shows that the addition of water into the fuel not only decreases the temperature of the combustor but also helps in reducing the mass fraction of pollutants like NOx and soot.