Challenge on Combustion
Aim- To perform combustion simulation on the combuster model and plot the variation of the mass fraction of the different species.
Introduction- Combustion is a high-temperature exothermic reaction(redox) between a fuel(reductant ) and an oxidant or the oxidizer to release a large amount of chemically bound energy. A flame is a characteristic indicator of the combustion reaction. It is a sequence of elementary radical reactions. Solid fuels undergo endothermic pyrolysis to generate gaseous fuel whose combustion supplies the heat required to produce more of such gaseous fuel products. The formation of these products is very complex and many different species such as H, O, OH, CH3, CH4 are formed in the process. Besides CO2 and H2O, a large number of pollutants like NOx, CO, and Soot particles are formed. A simple example can be seen in the combustion of Hydrogen and Oxygen into water vapor, a reaction generally used to fuel the rocket engines. The reaction releases 242 KJ/mol of heat and reduces the enthalpy accordingly (at constant temperature and pressure):
2H2(g) + O2(g) = 2H2O(g)
Combustion of an organic fuel in air is always exothermic because the double bond in O2 is much weaker than other double bonds or pairs of single bonds, and therefore the formation of the stronger bonds in the combustion products CO2 and H2O results in the release of energy. The bond energies in the fuel play only a minor role since they are similar to those in the combustion products; e.g., the sum of the bond energies of CH4 is nearly the same as that of CO2. The heat of combustion is approximately −418 kJ per mole of O2used up in the combustion reaction and can be estimated from the elemental composition of the fuel.
Non-premixed combustion simulation is performed in this project which will be explained in the theory below along with other types of possible combustion simulations.
Theory- Basically combustion is broadly divided in two categories as follows:
Based on Mixing:
- Non-premixed Combusion
- Premixed Combustion
- Partially Premixed Combustion
Based on Phases:
- Fluid Phase
- Wall
- Particles
- Porus Region
Non-premixed Combustion: A non-premixed combustion occurs when the fuel and oxidizer are not mixed prior to reacting. An example of this is the diffusion flame from a lighter as shown in Figure 1. Lighter fuel is typically compressed butane which is liquid inside the lighter canister, but rapidly expands to gas once released from the lighter nozzle. The concentration of the butane near the nozzle is too high for combustion, and the flame cannot form until it mixes with the surrounding air. Diffusion flames are typically much cooler than premixed flames as the mixing step limits the overall combustion.
Premixed Combustion: A premixed flame results when the fuel and oxidizer are mixed prior to the passage of the reaction zone. An example premixed flame is shown in Figure 1 below for a gas stove where natural gas (70-90% methane, 30%-10% other gases) and oxygen are mixed prior to being ignited inside the burner.
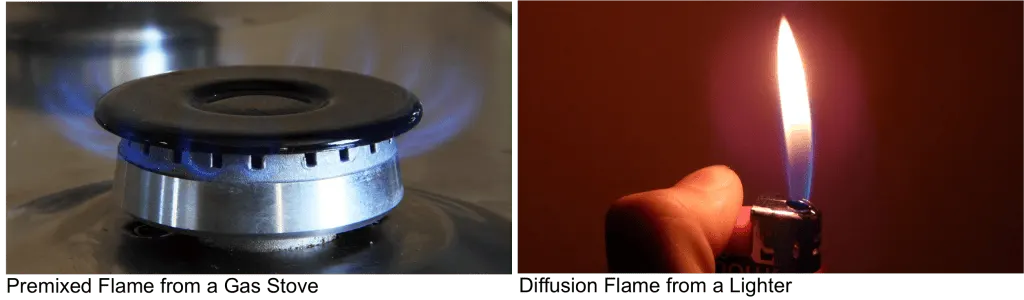
Figure 1. Types of Combustion
Partially pre-mixed combustion: Partially premixed combustion (PPC), also known as PPCI (partially-premixed compression ignition) or GDCI (gasoline direct-injection compression-ignition) is a modern combustion process intended to be used in internal combustion engines of automobiles and other motorized vehicles in the future. Its high specific power, high fuel efficiency and low exhaust pollution have made it a promising technology. A PPC engine injects and premixes a charge during compression stroke. Thus premixed charge is too lean to ignite during the compression stroke, the charge will ignite after the last fuel injection ends near TDC. The fuel efficiency and working principle of a PPC engine resemble those of Diesel engine, but the PPC engine can be run with a variety of fuels. Also the partially premixed charge burns clean. The partially pre-mixed combustion cycle can be observed in Figure 2.
Figure 2. Partially pre-mixed combustion cycle
Fluid Phase Combustion: If the combustion is taking place in fluid phase then it can be called as volumetric reaction or volumetric combustion. Volumetric combustion can be characterized by a very intensive mixing and internal recirculation inside of the combustion chamber e.g. combustion of biomass. In this way, combustion occurs in a very large volume with a relatively uniform distribution of the reacting species, temperature and heat fluxes.
Combustion on Wall: If the combustion is taking place on a wall the such type of combustion reactions are known as surface reaction e.g. surface combustion reaction reaction on steel wool as shown in Figure 3.
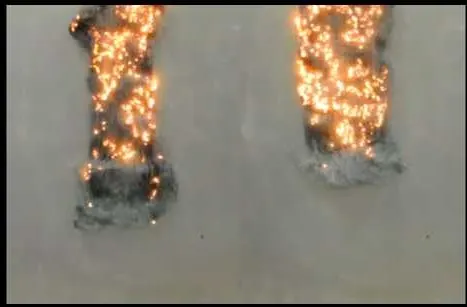
Figure 3. Surface Combustion Reaction
Combustion on Particles: Combustion happens over surfaces involving multi phase particle surface reaction mechanism that is when the combustion takes on lagrangian particles. The example for this type of combustion is combustion of coal.
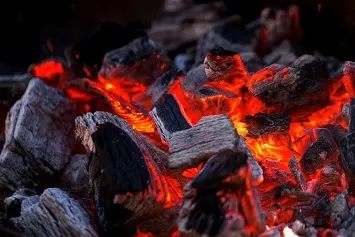
Figure 4. Combustion on Particles
Porus Region Combustion: When combustion takes place in porus region, it is a porus region combustion. It mainly takes place in after treatment system. It is a series of components that cleans the diesel exhaust emitted by the engine prior to releasing it through the tailpipe to the outside air. Its purpose is to reduce the emission of harmful pollutants into the environment. After treatment system can be observed in Figure 5.
Figure 5. After treatment system
Geometry- The 2D geometry is prepared in Spaceclaim. While making a geometry it is very important to sketch along the XY plane and the axisymmetric axis must be X-axis only otherwise Fluent will show an error. The reason for choosing 2D geometry over 3D geometry is to reduce the computational time as the geometry is axisymmetric. Figure 6 shows the 2D geometry and 3D representation of this axisymmetric 2D geometry can be observed in Figure 7. This 3D geometry is obtained by drafting the sketch or 2D geometry by 360 degrees.

Figure 6. 2D Geometry for Simulation
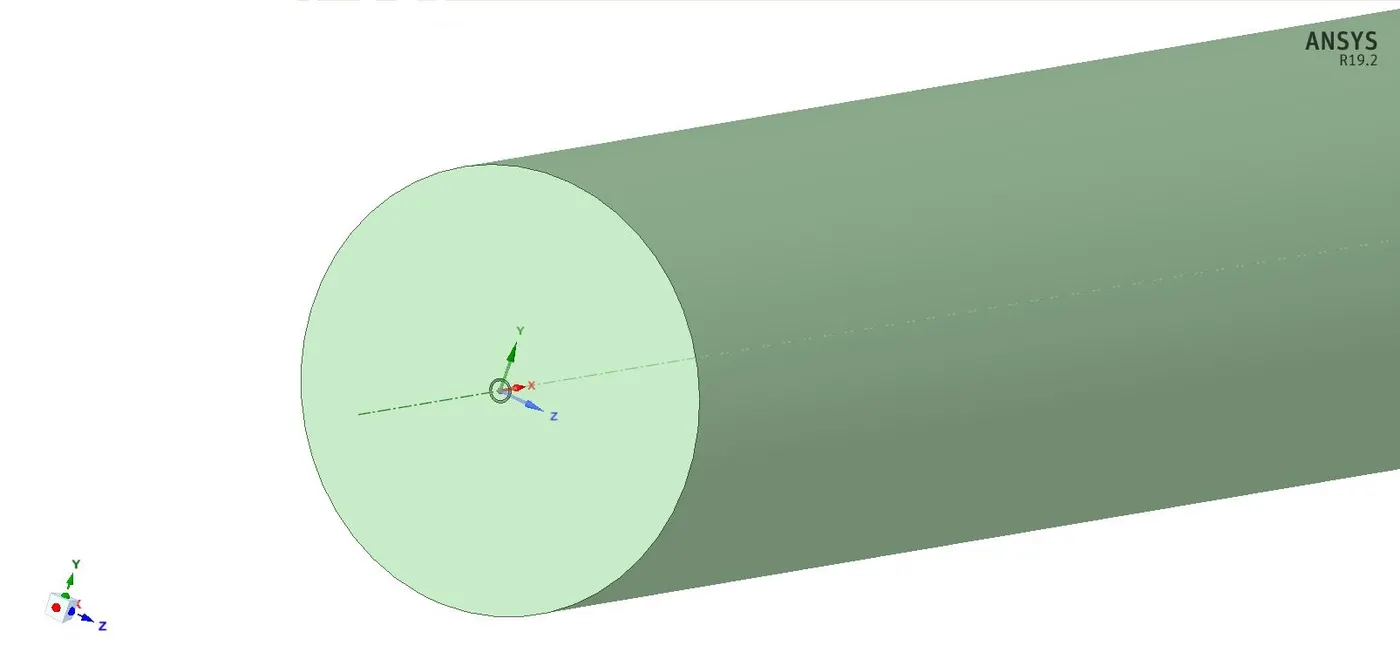
Figure 7. 3D geometry
Meshing- The geometry was meshed by All triangles with an element size of 10 mm which can be observed in Figure 8. The number of nodes and elements are 5134 and 9792 respectively. Proximity was enabled with a minimum size of 0.3 mm and 3 number of cells across gap. The named selection was given to each boundary of geometry as shown in Figure 9. Mesh quality check was enabled with a target skewness of 0.4 for which the mesh metric of skewness can be observed in Figure 10.

Figure 8. Meshing
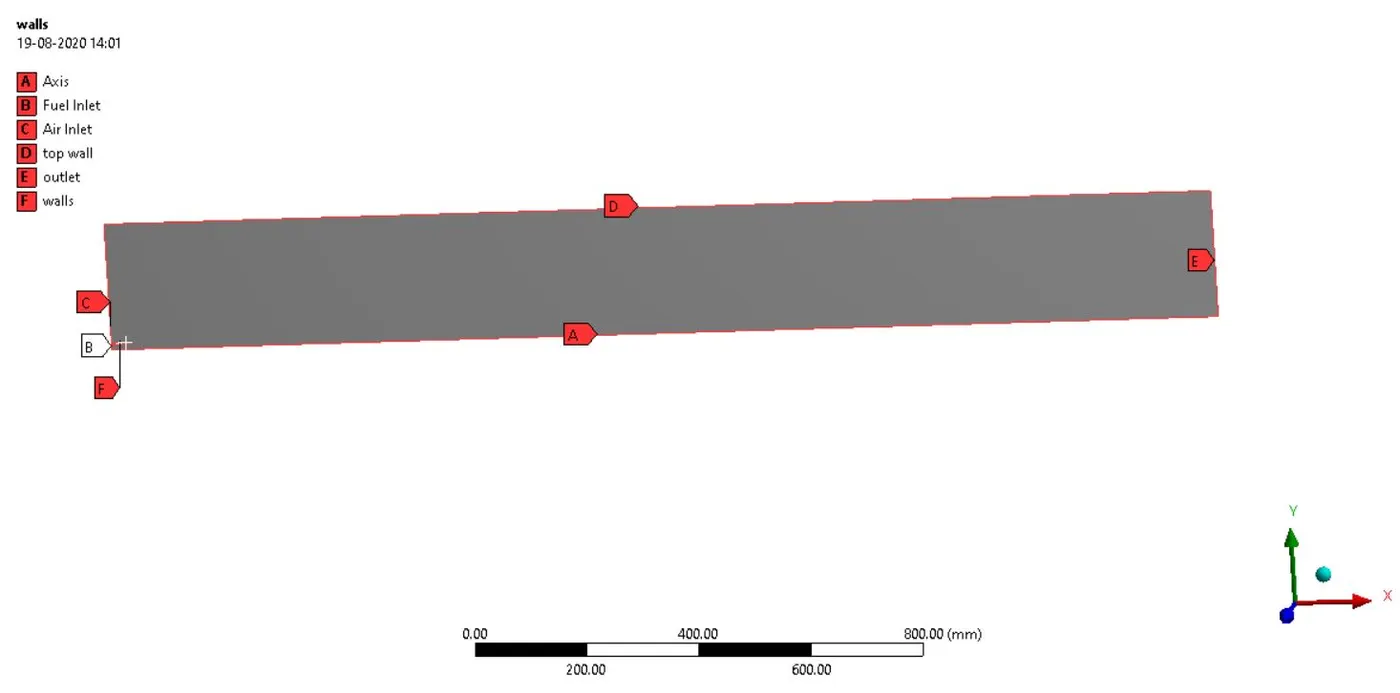
Figure 9. Named Selection
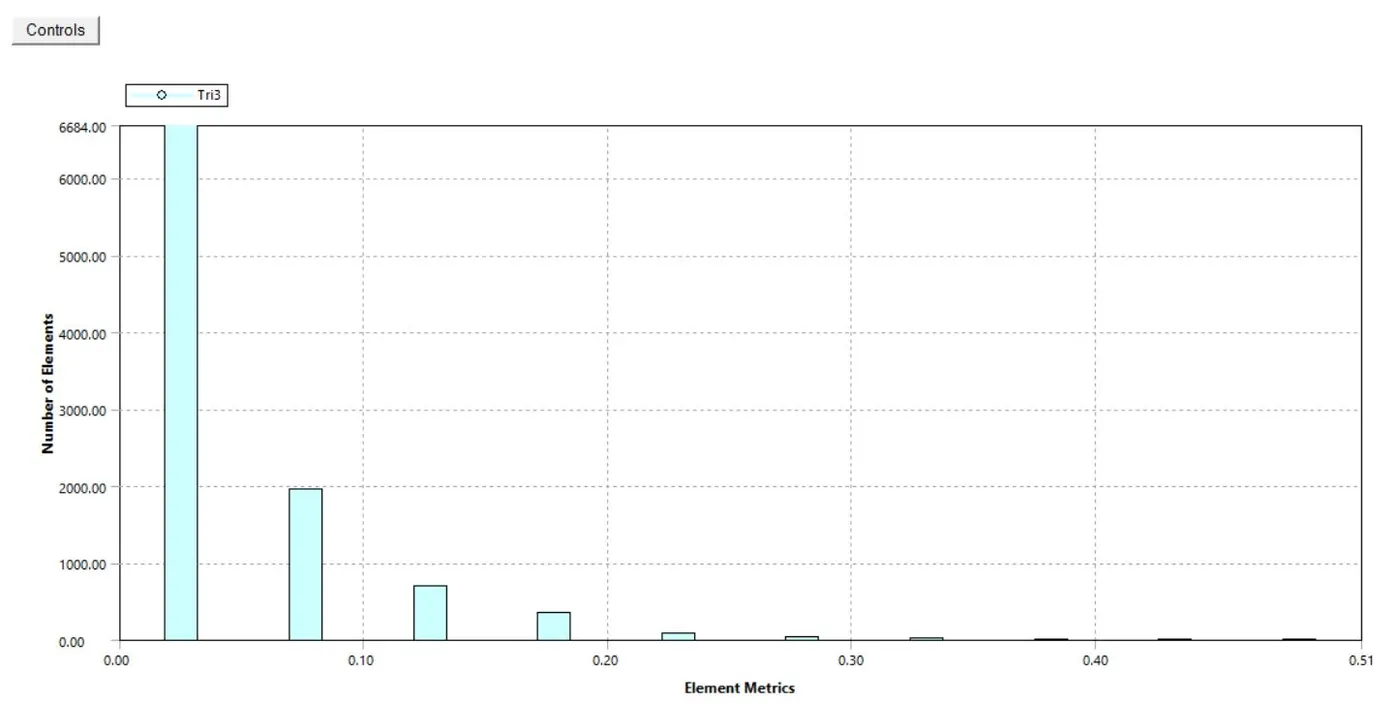
Figure 10. Mesh Metrics for Skewness
Boundary Conditions- The standard k-epsilon model was selected. The energy option was enabled. Pressure based solver with steady-state axisymmetric solver was selected. Species transport was selected with methane-air for Part I and methane-air-2step for Part II as a mixture material. Eddy-dissipation turbulence chemistry interaction was selected with volumetric reactions enabled. Also, Inlet diffusion and diffusion energy options were enabled which can be observed in Figure 11.
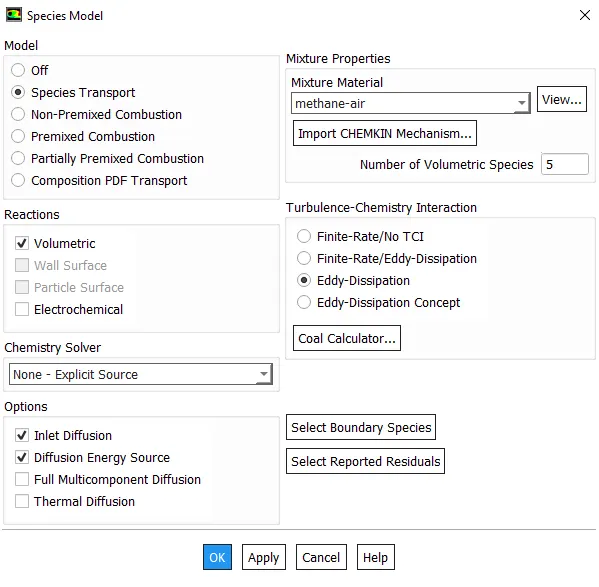
Figure 11. Species Model
Air-inlet was given a velocity of 0.5 m/sec and 0.23 mass fraction of O2 for all cases. For Fuel-inlet velocity given was 80 m/sec for all cases and the mass fraction was varied as per the required percentage of water in fuel for CH4. After these inputs, the simulation was run for around 550 to 750 iteration and results for each case were obtained.
Results- After the simulation, the post-processing was done in CFD-post in which the contours of mass fraction were obtained for CH4, CO2, H2O, N2, O2, NOx, and Soot. Also, line probes at different locations were made to obtain the plot of mass fraction of different constituents of combustion mentioned. Line probes made on the combustor can be observed in Figure 12.
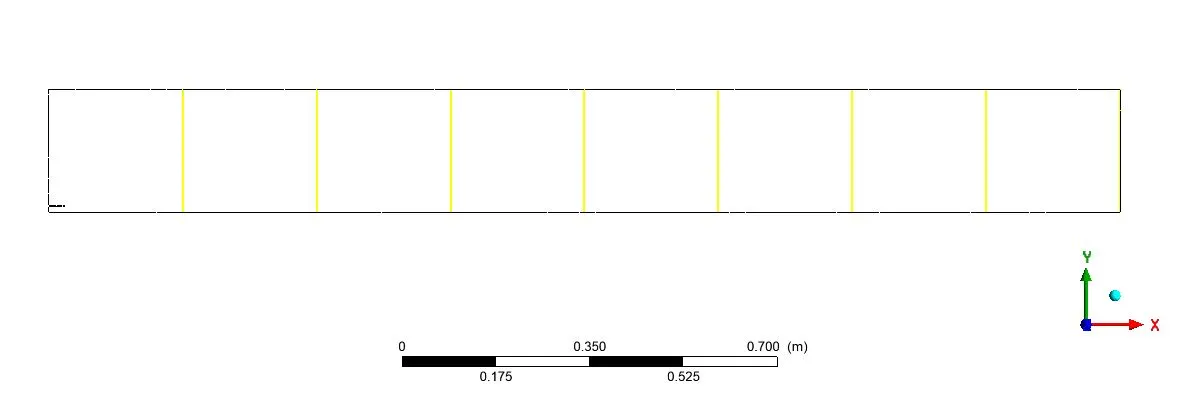
Figure 12. Line Probes at different locations.
Part I- The simulation is performed without adding H2O in the fuel. (Mass Fraction of CH4 for Fuel Inlet = 1)
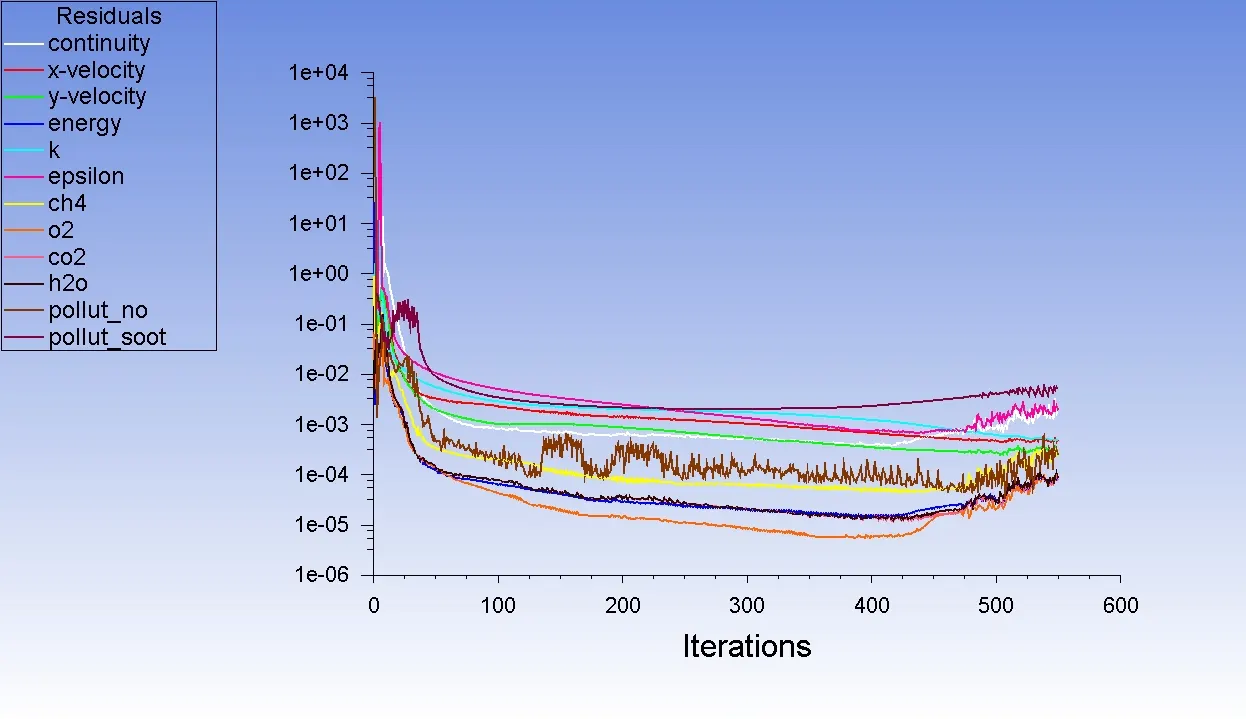
Figure 13. Residuals for 100% Fuel
Animation 1. 100% Fuel
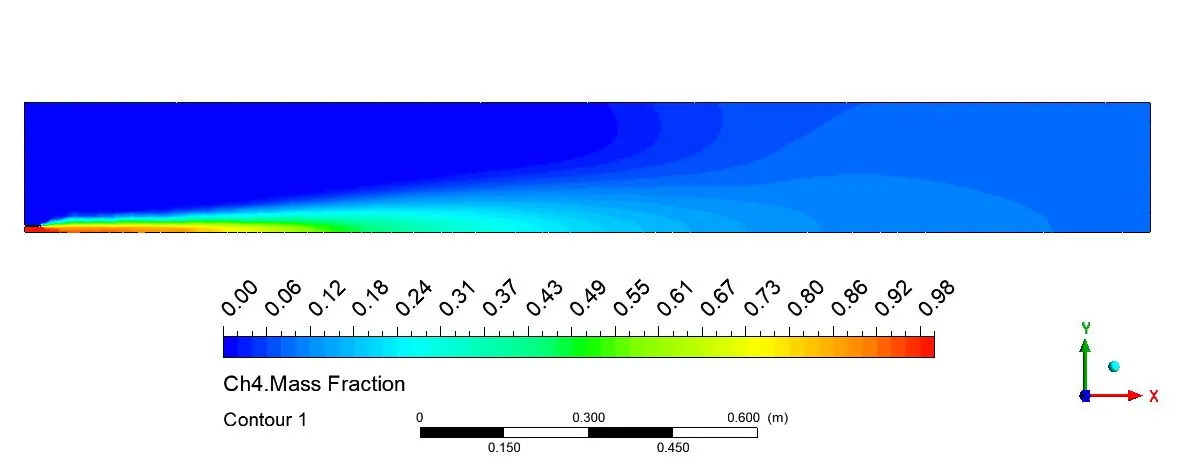
Figure 14. CH4 Mass Fraction
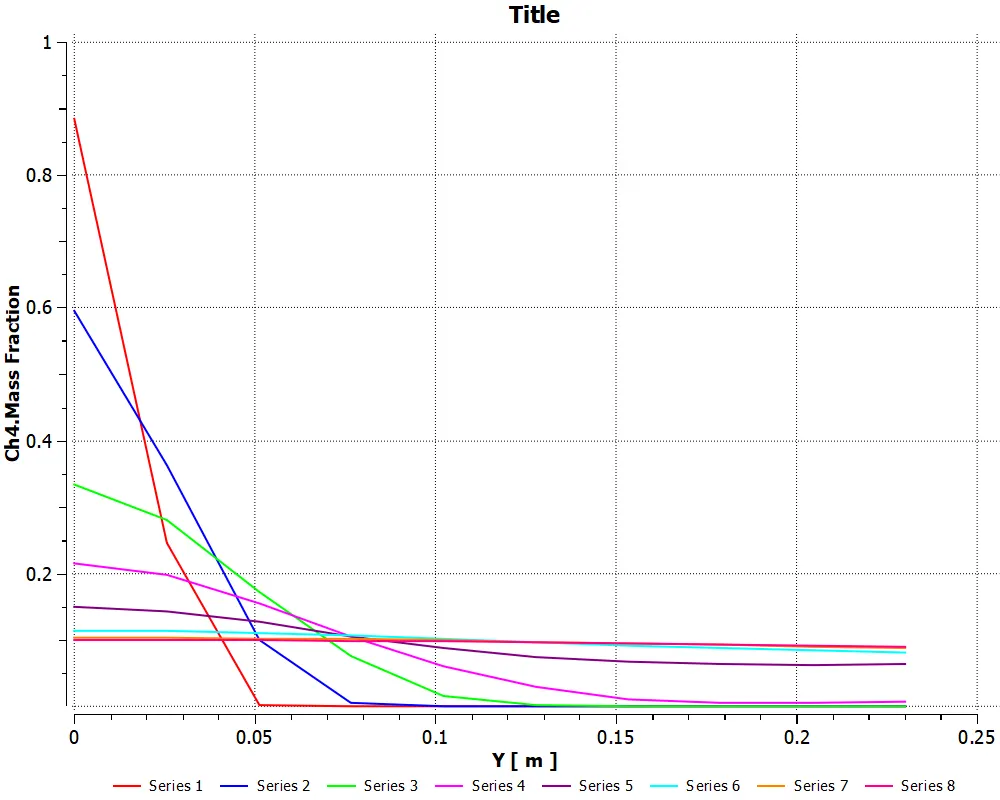
Figure 15. Plot of CH4 Mass Fraction
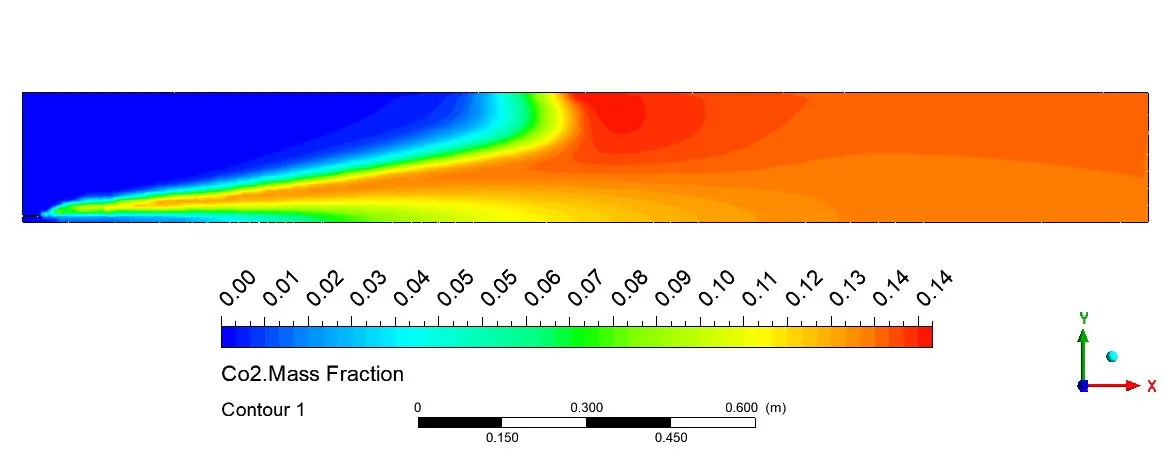
Figure 16. CO2 Mass Fraction
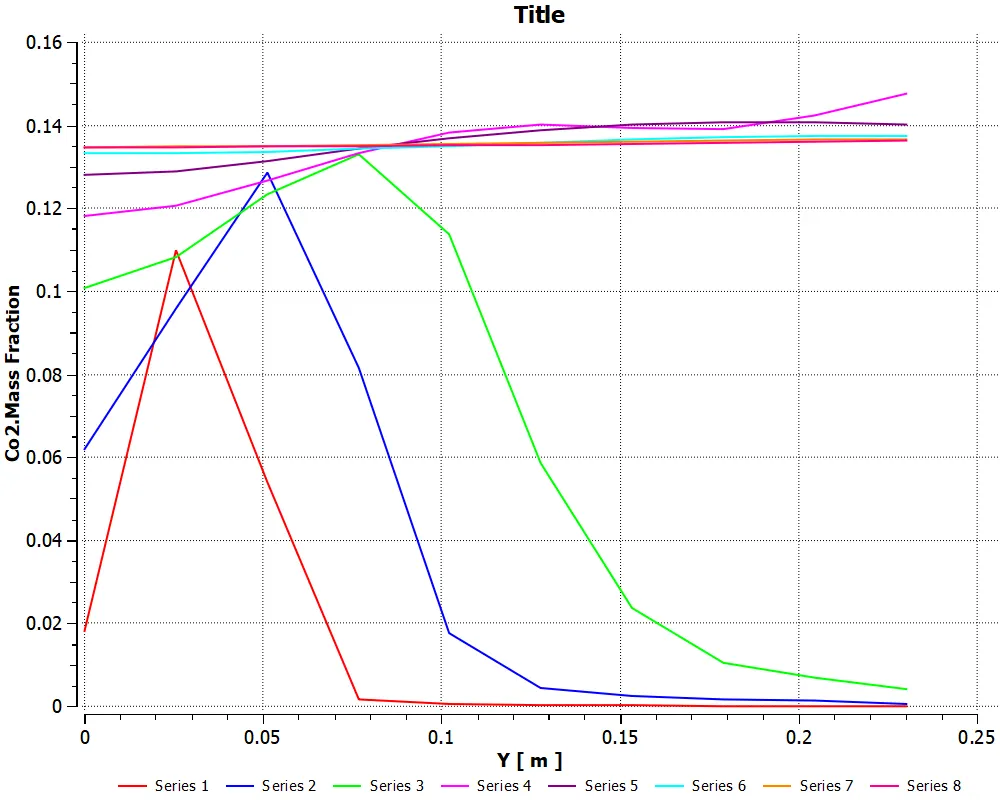
Figure 17. Plot of CO2 Mass Fraction
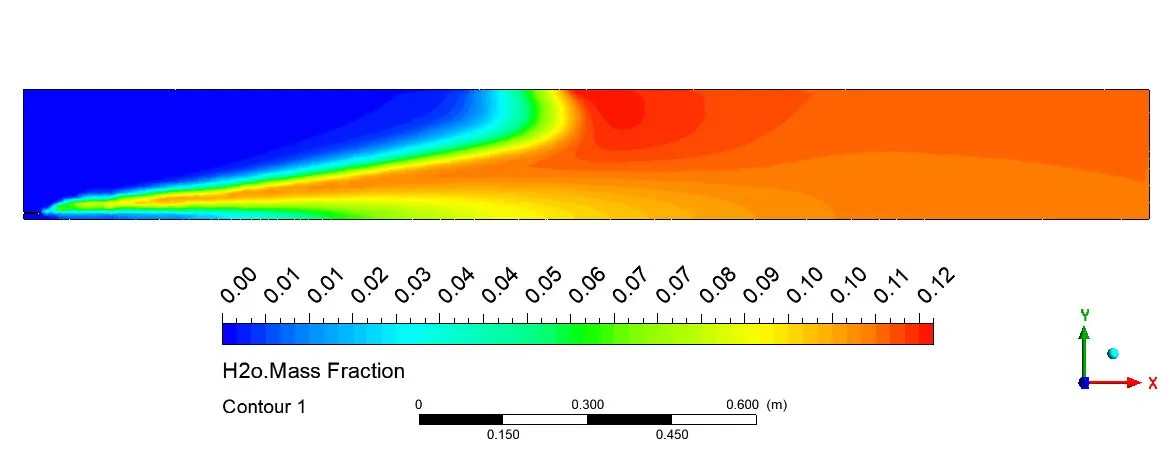
Figure 18. Mass fraction of H2O
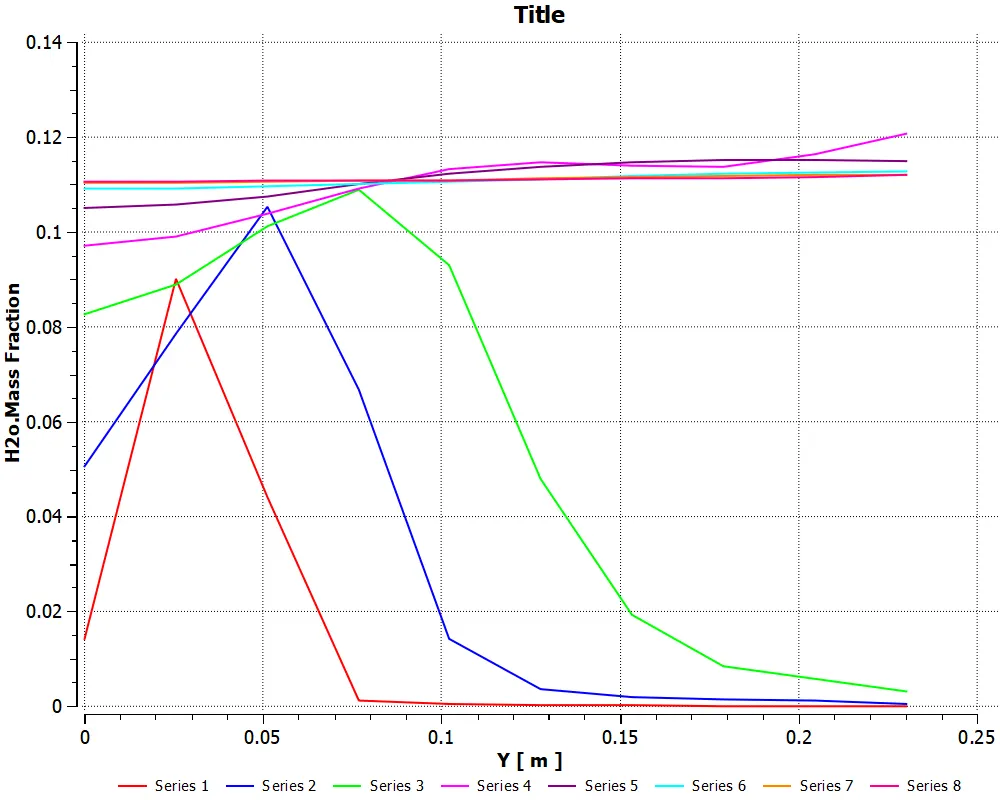
Figure 19. Plot for Mass Fraction of H2O
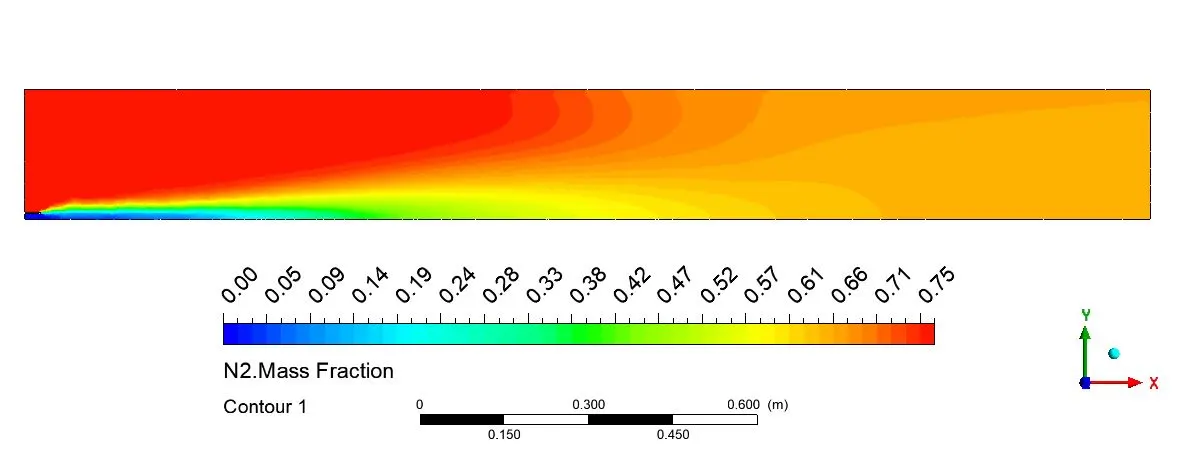
Figure 20. Contours of Mass Fraction of N2
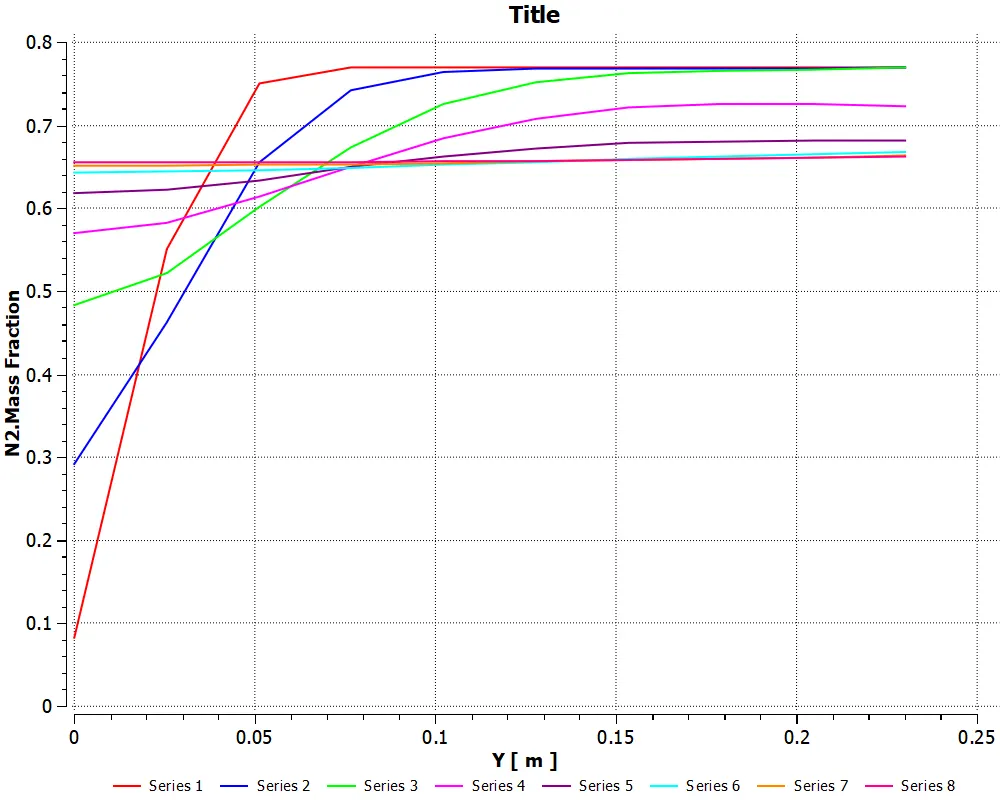
Figure 21. Plot of Mass Fraction of N2
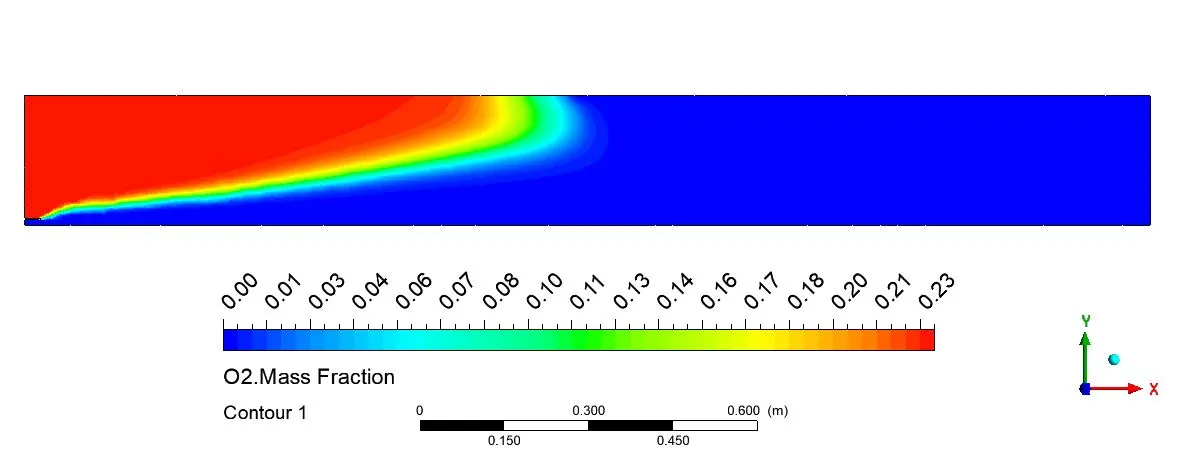
Figure 22. Contours of Mass Fraction of O2
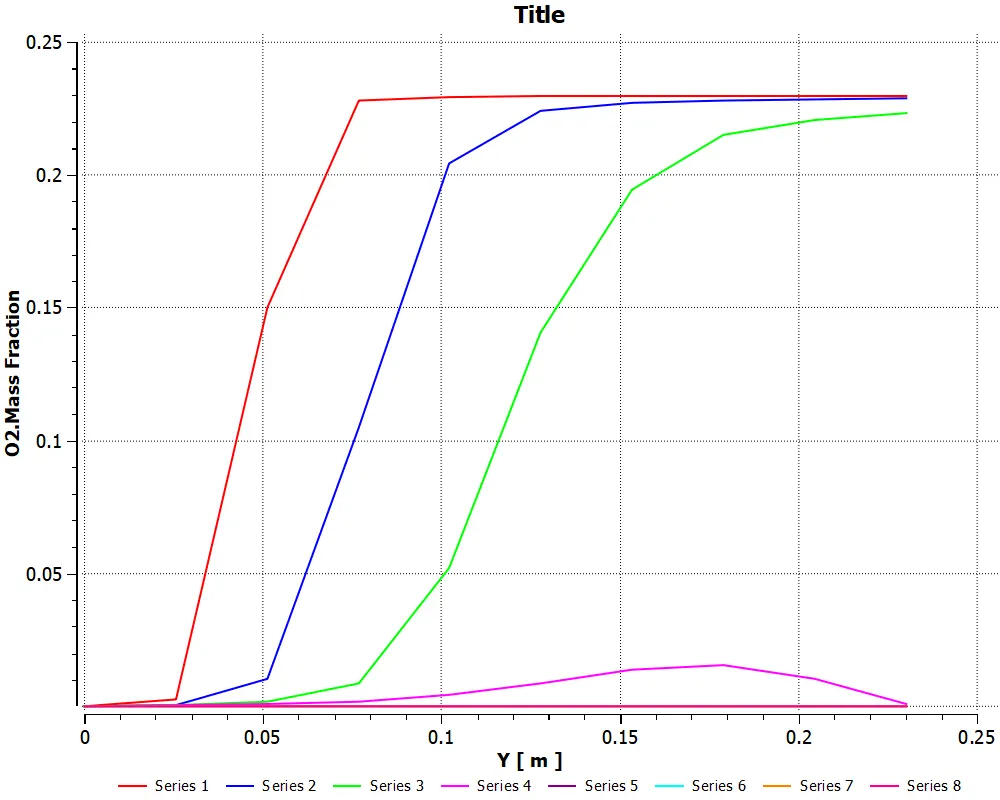
Figure 23. Plot for Mass Fraction of O2
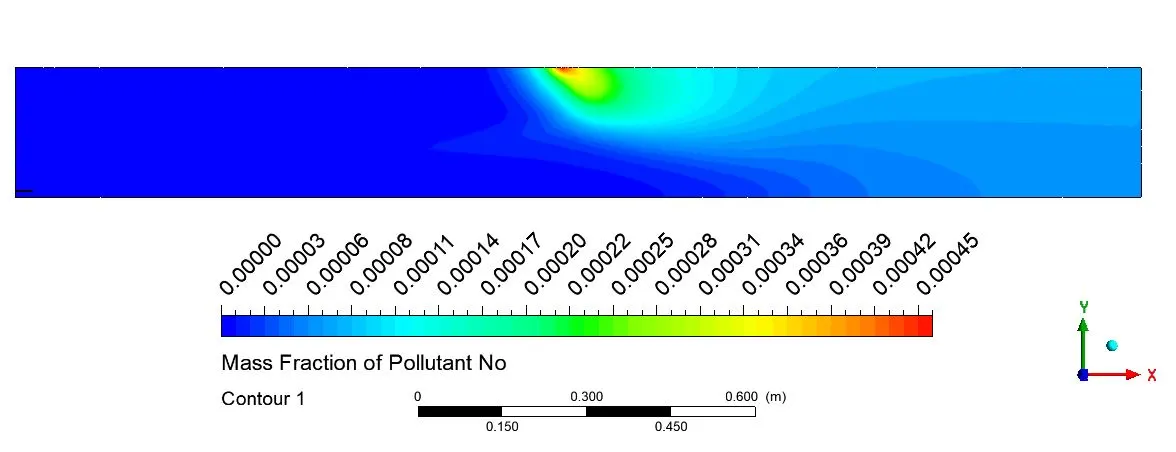
Figure 24. Contours of Mass Fraction of NOx
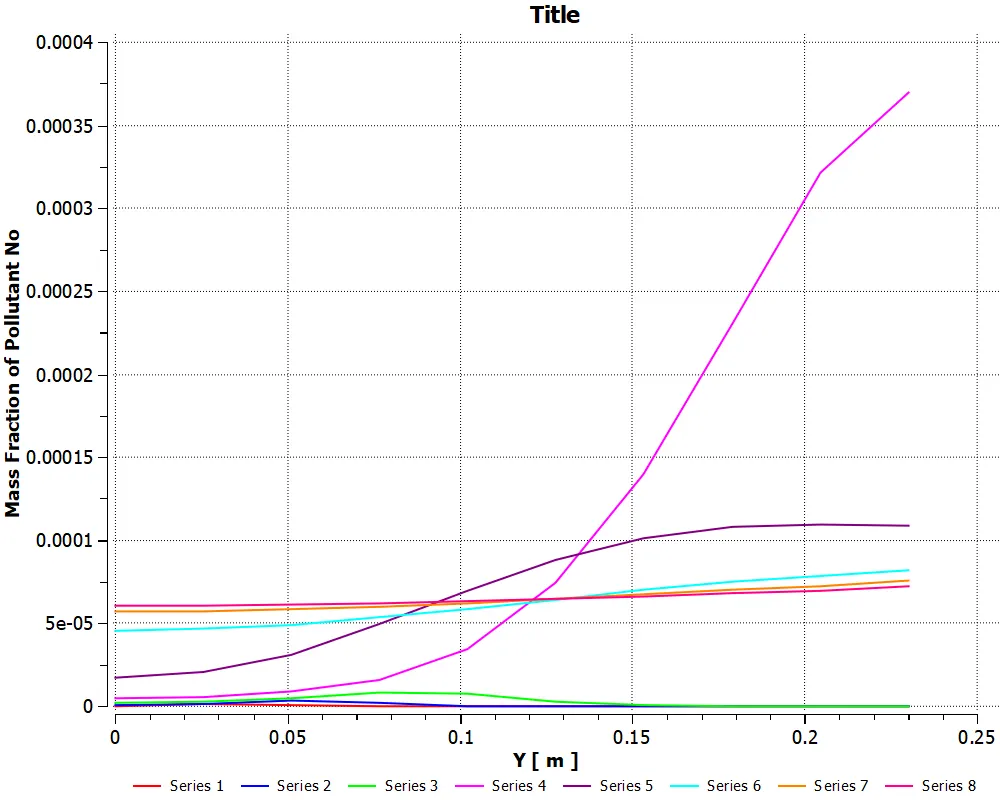
Figure 25. Plot for Mass Fraction of NOx
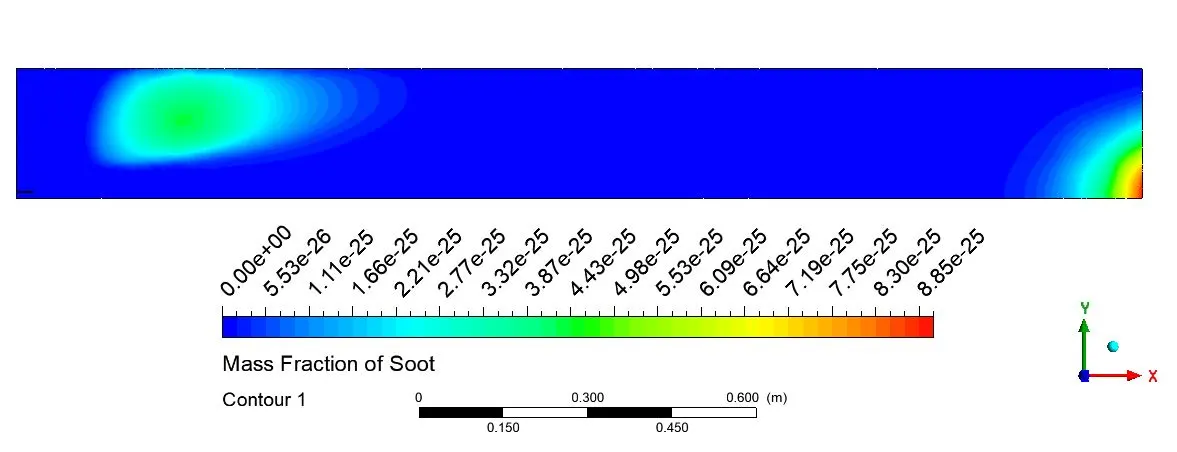
Figure 26. Contours of Mass Fraction of Soot
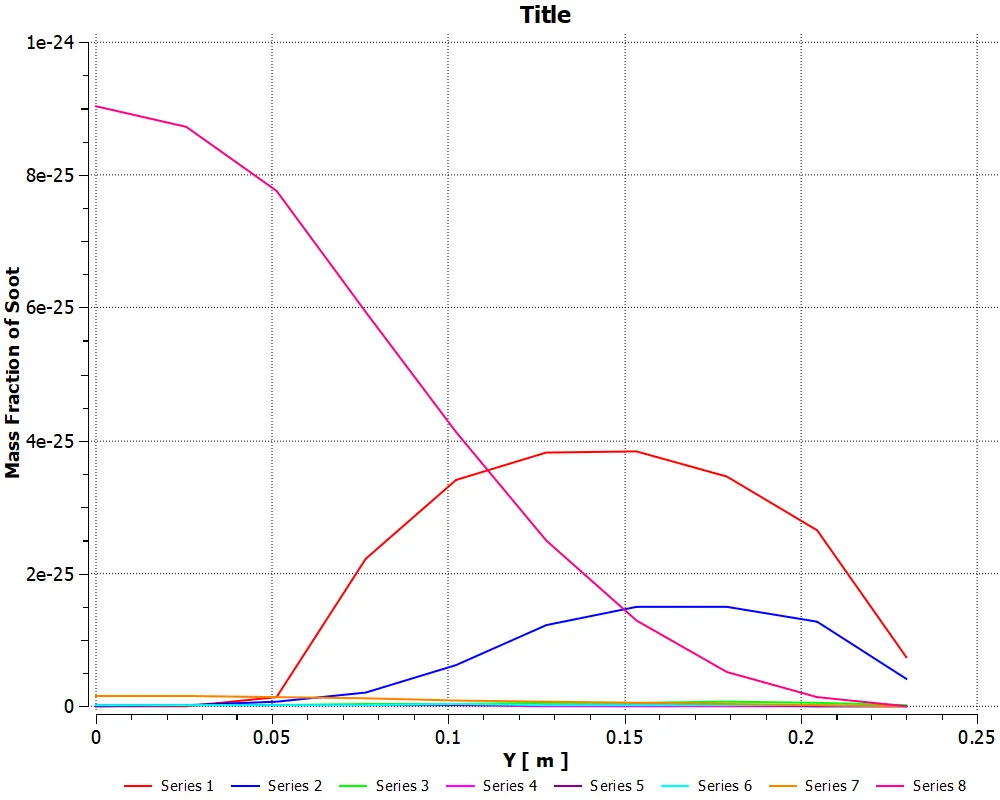
Figure 27. Plot for Mass Fraction of Soot
Part 2- The simulation is performed by varying H2O in the Fuel from 5% to 30%. Following are the simulation results for different percentages of H2O in the Fuel.
a) 5% H2O in Fuel: Fuel inlet (Species:H2O-0.05,CH4-0.95) for the addition of water content (5% by mole)
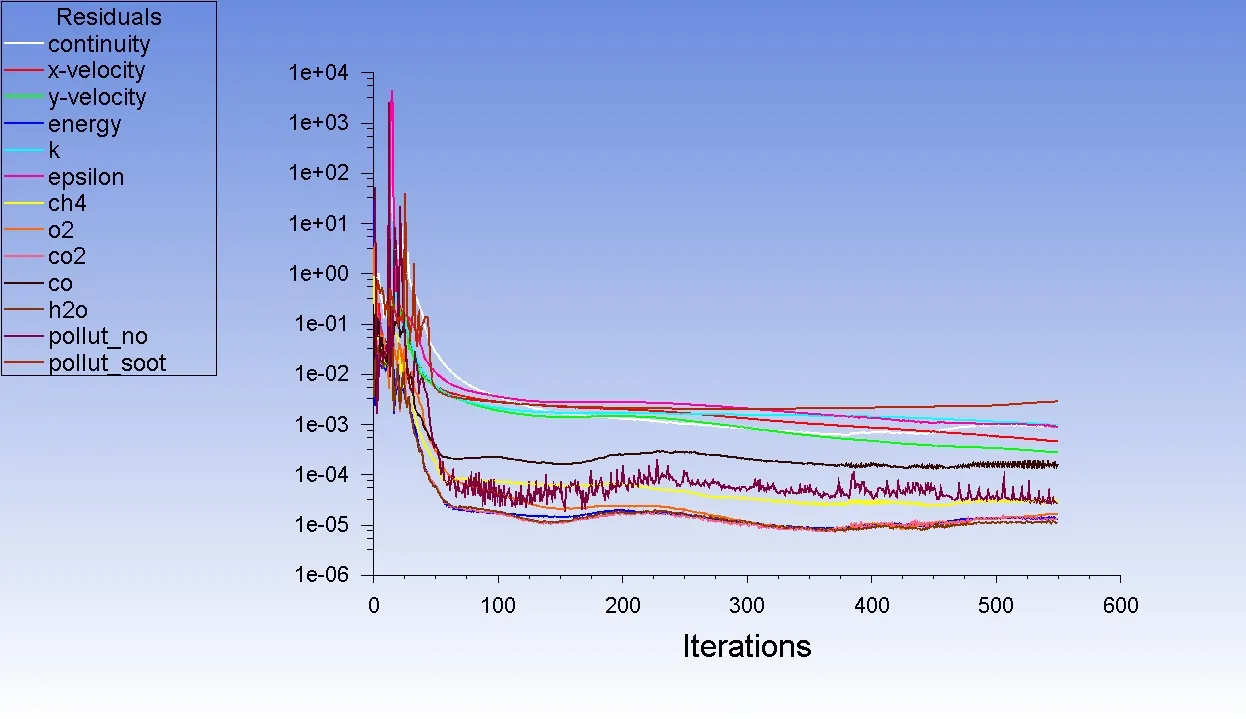
Figure 28. Residuals for 5% H2O in Fuel
Animation 2. 5% H2O in Fuel
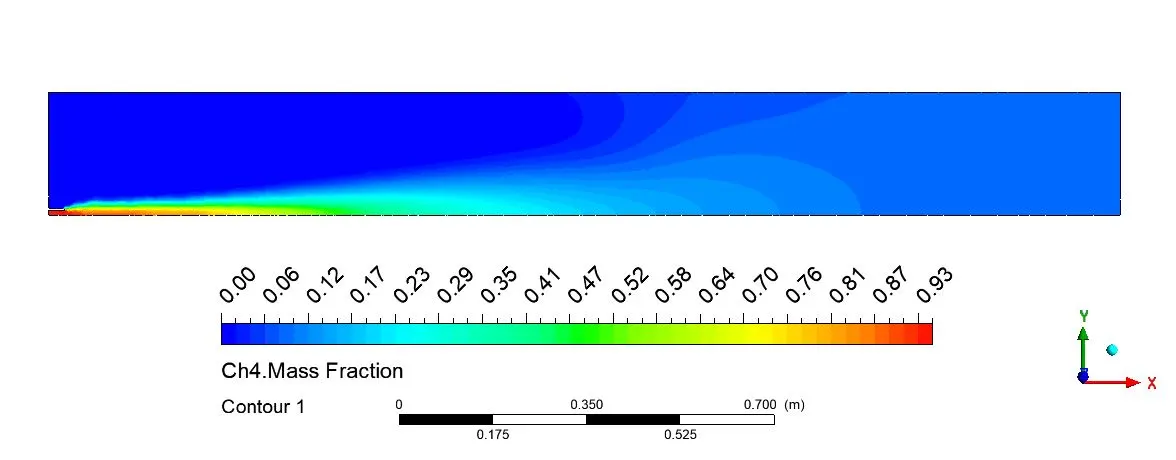
Figure 29. Contours of Mass Fraction of CH4
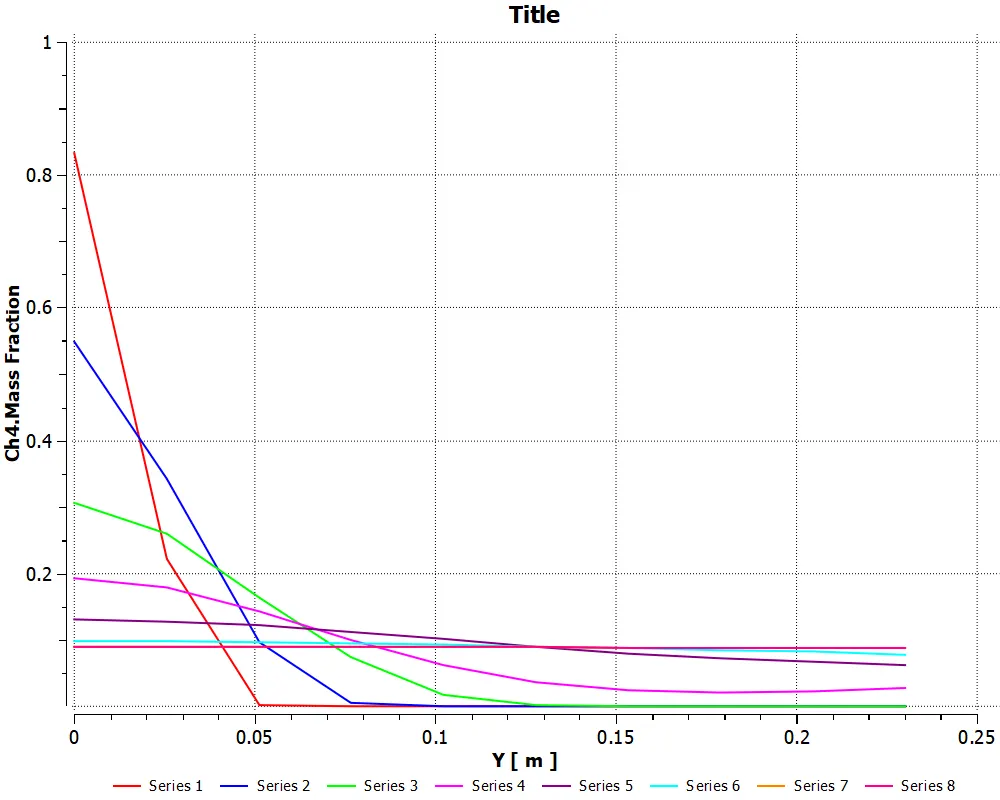
Figure 30. Plot For Mass Fraction of CH4
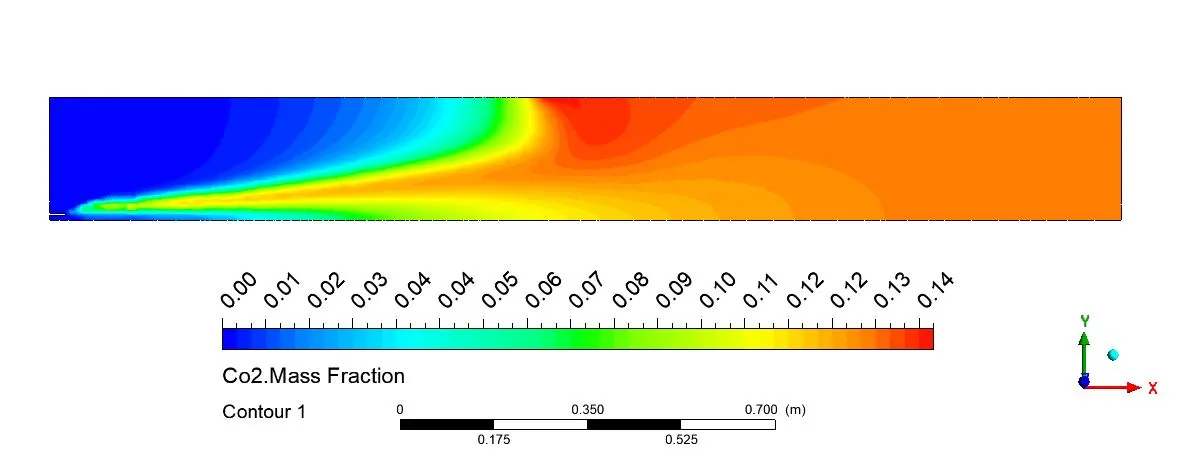
Figure 31. Contours of Mass Fraction of CO2
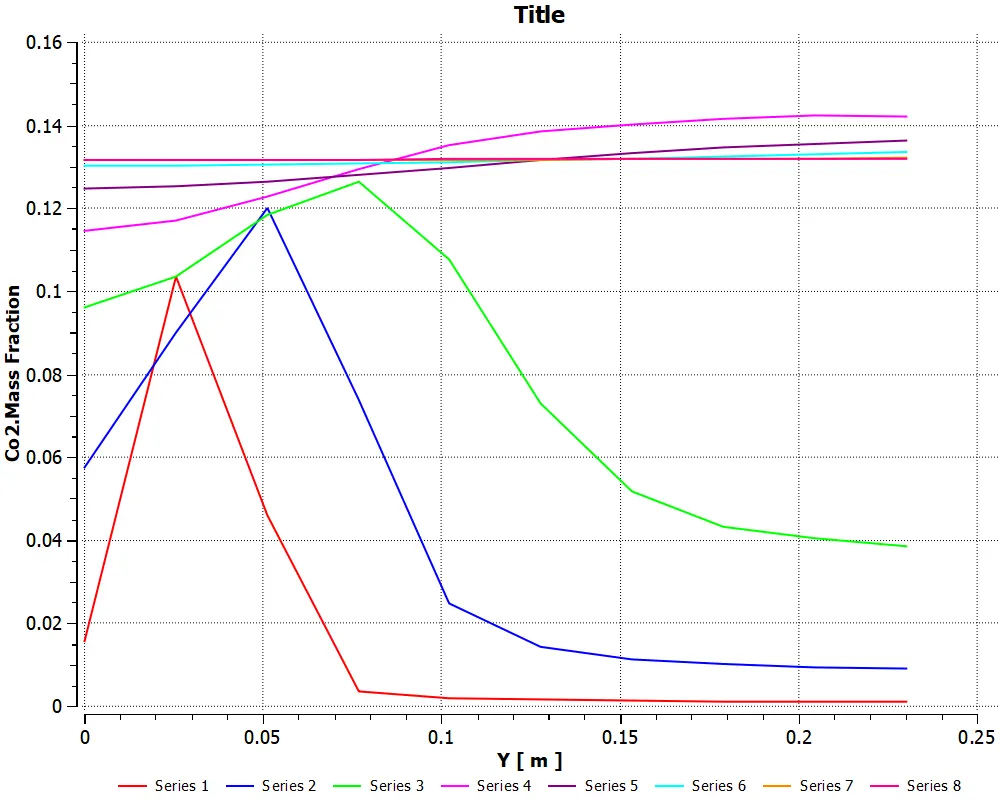
Figure 32. Plot for Mass Fraction of CO2
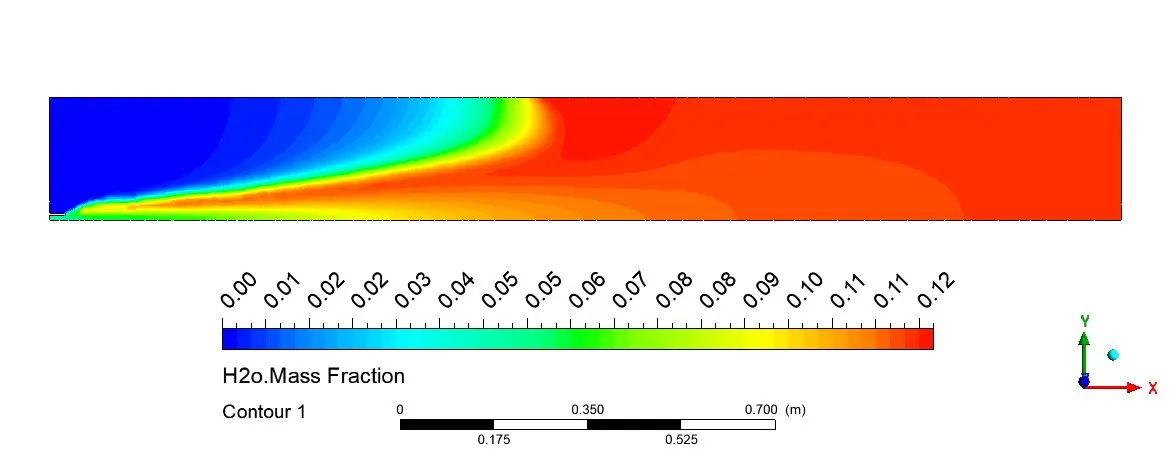
Figure 33. Mass Fraction of H2O
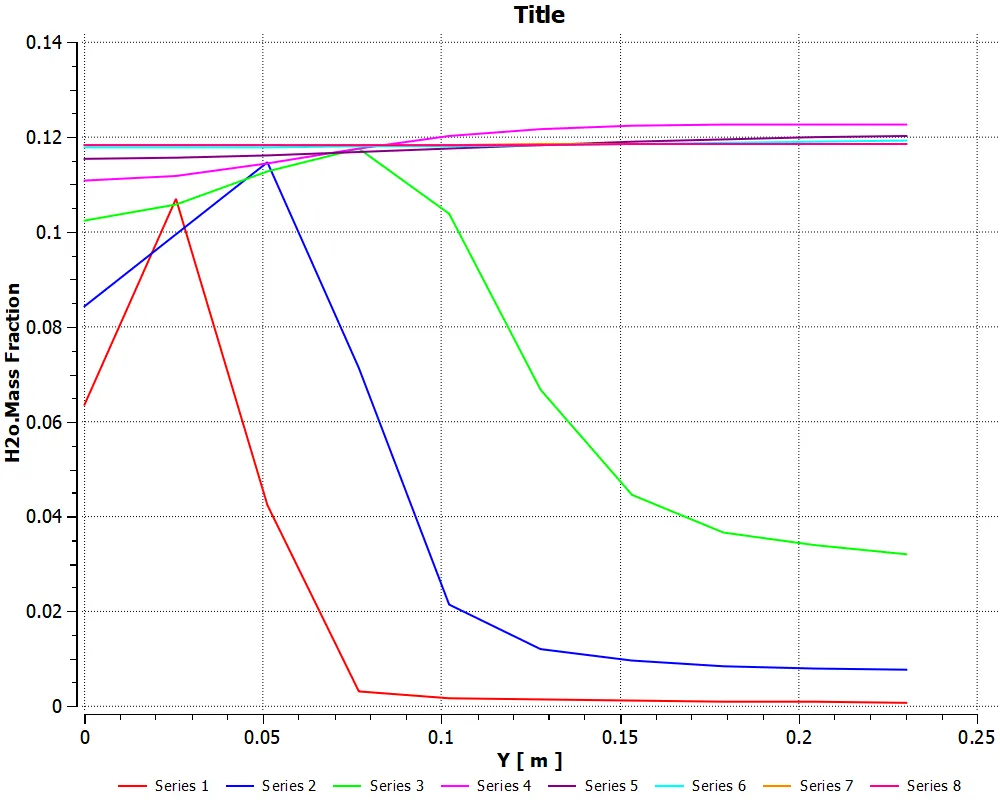
Figure 34. Plot for Mass Fraction of H2O
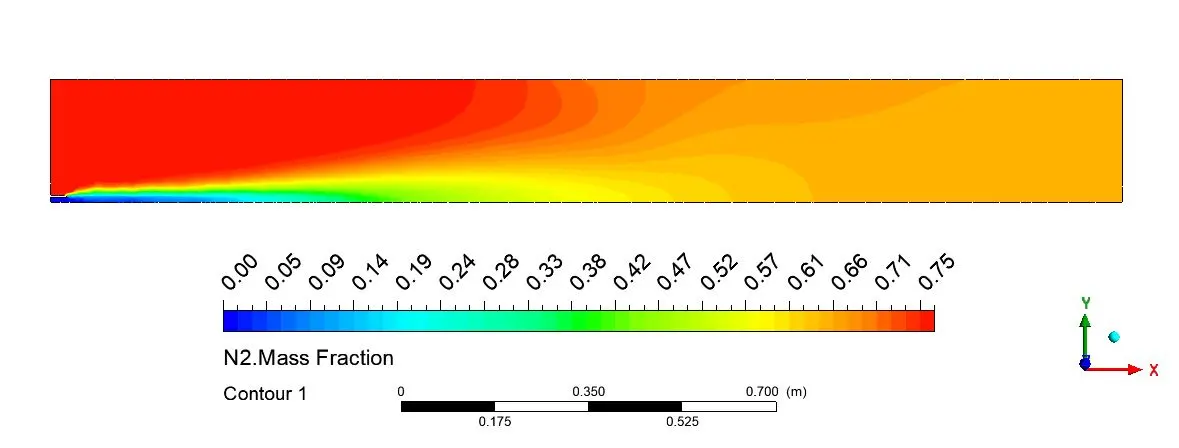
Figure 35. Contours of Mass Fraction of N2
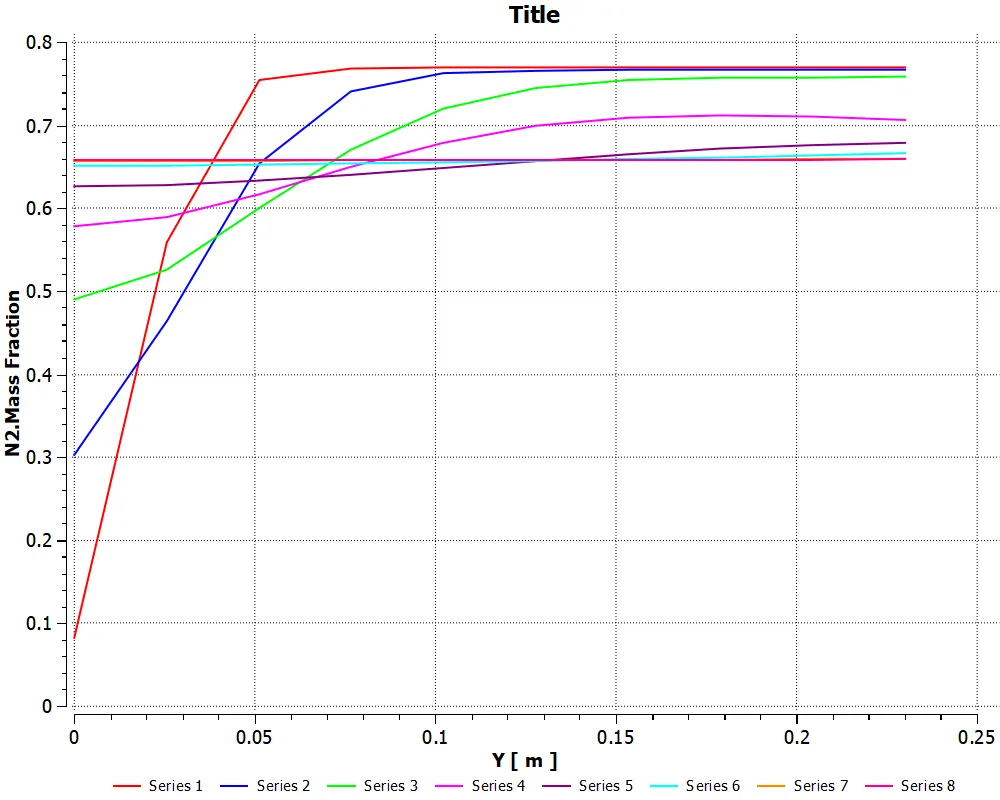
Figure 36. Plot for Mass Fraction of N2
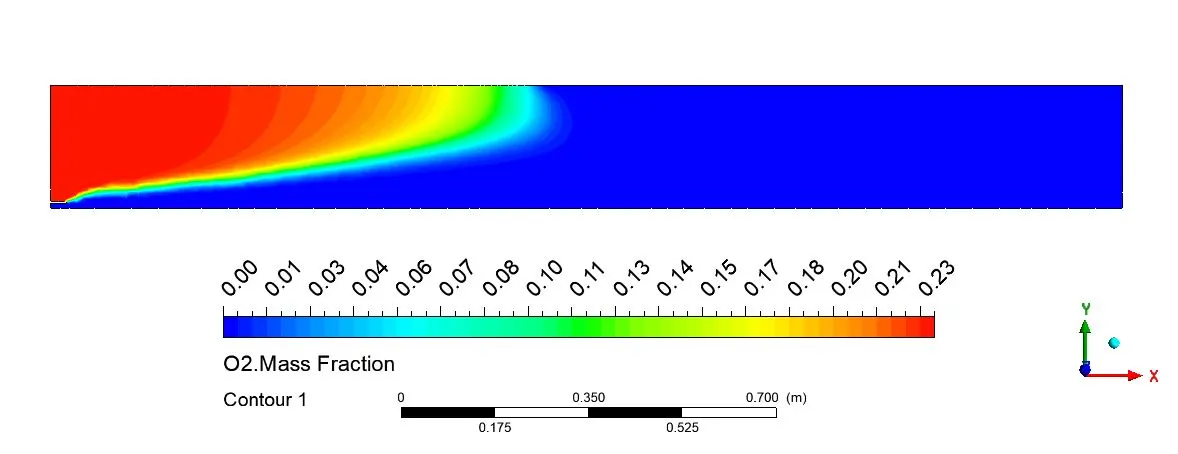
Figure 37. Contours of Mass Fraction of O2
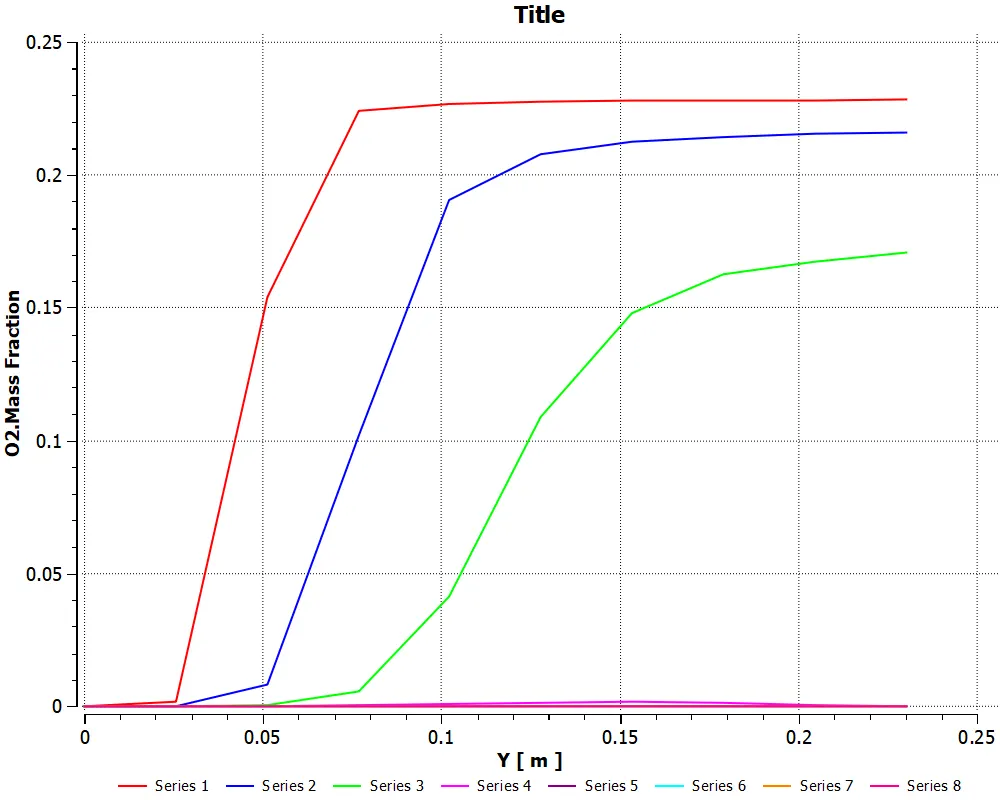
Figure 38. Plot for Mass Fraction of O2
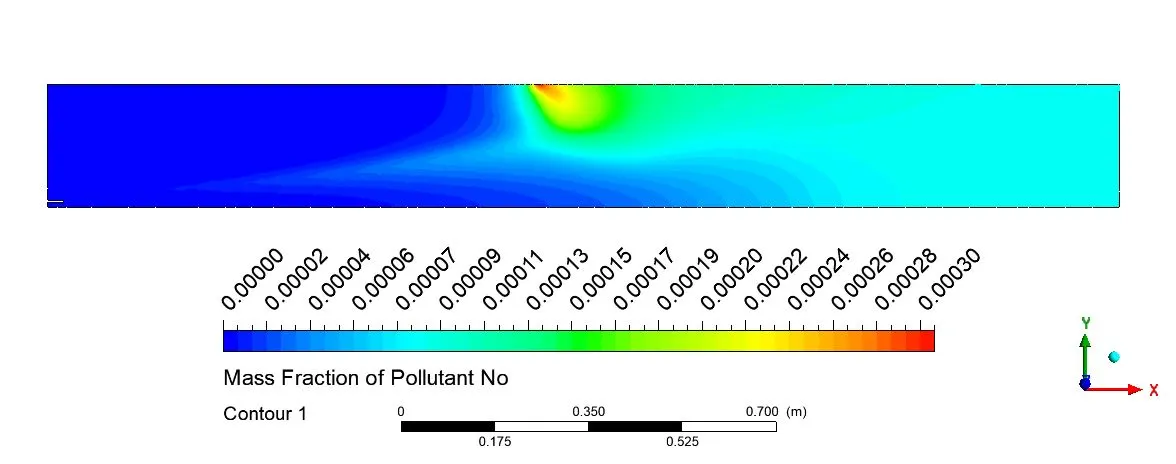
Figure 39. Contours of Mass Fraction of NOx
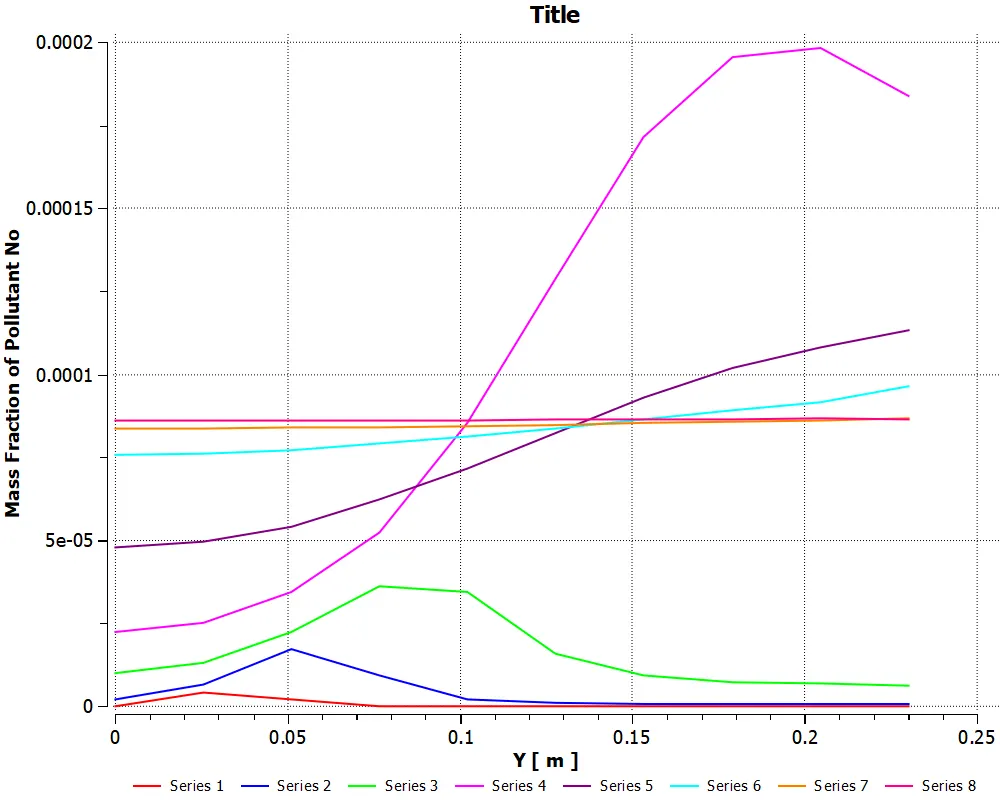
Figure 40. Plot for Mass Fraction of NOx
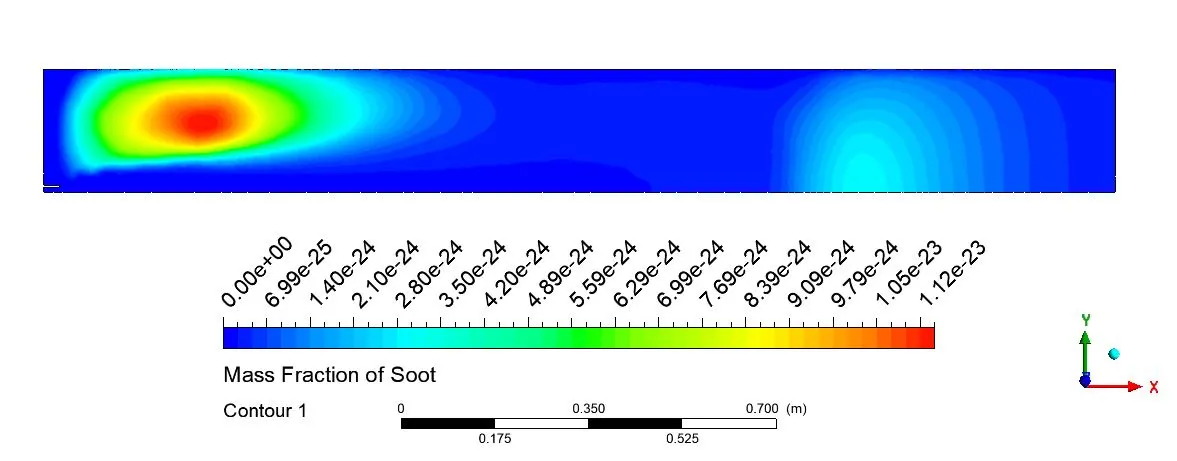
Figure 41. Contours of Mass Fraction of Soot
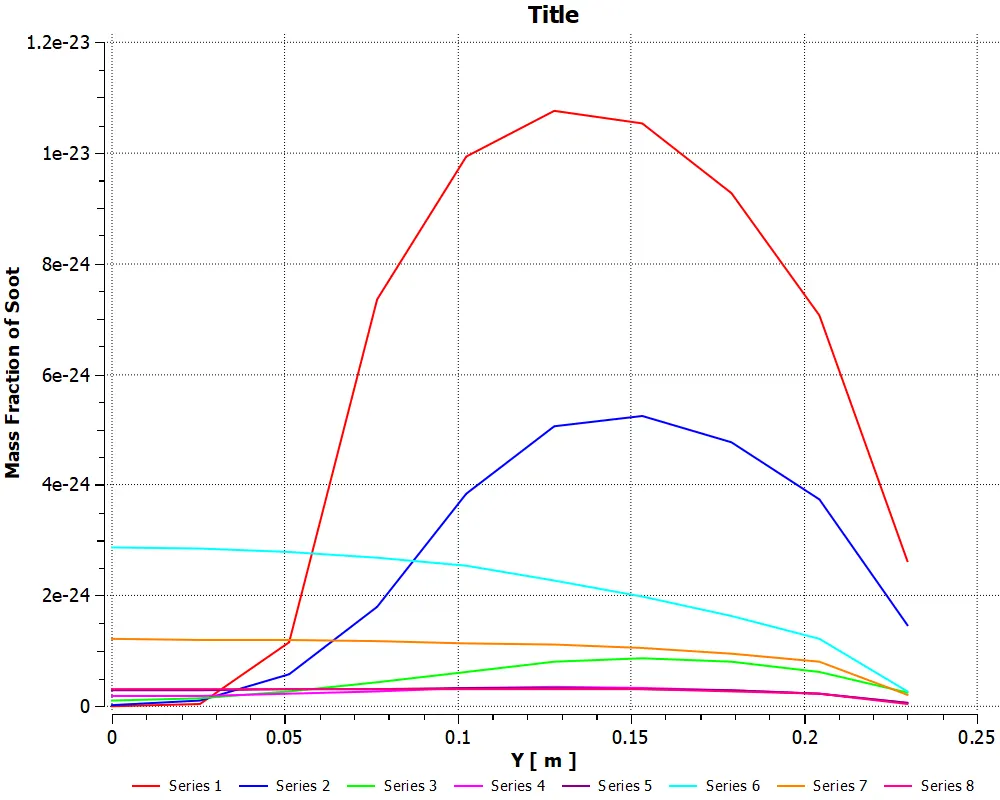
Figure 42. Plot for Mass Fraction of Soot
b) 10% H2O in Fuel: Fuel inlet (Species: H2O-0.1, CH4-0.9) for the addition of water content (10% by mole)
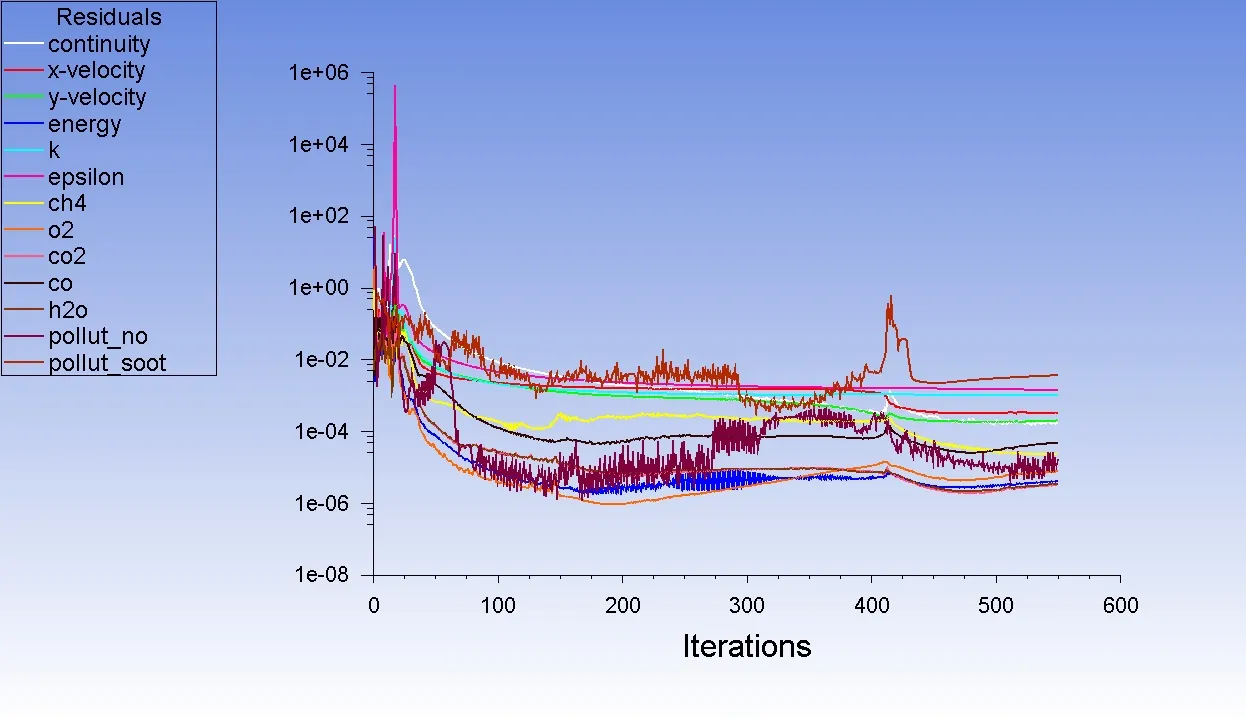
Figure 43. Residuals of 10% H2O in Fuel
Animation 3. 10% H2O in Fuel
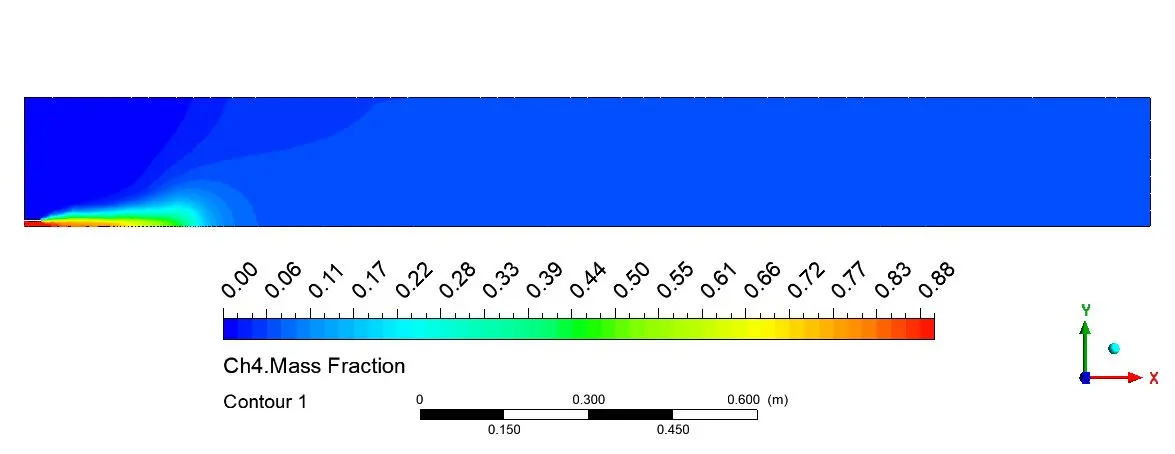
Figure 44. Contours of Mass Fraction of CH4
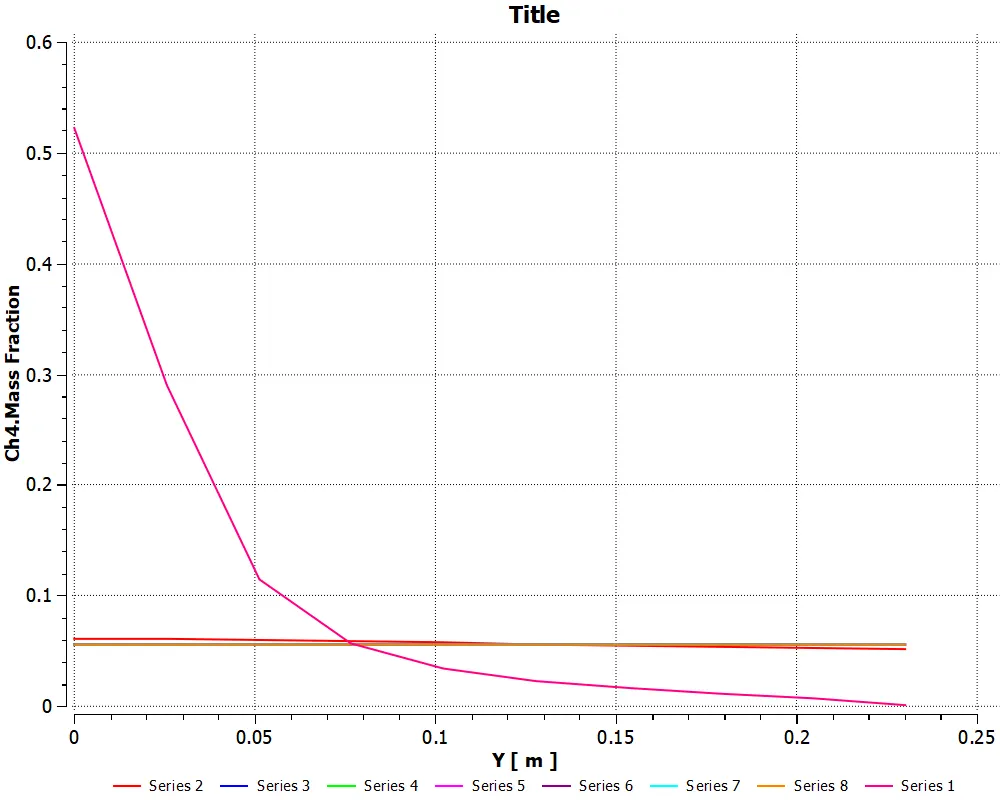
Figure 45. Plot for Mass Fraction of CH4
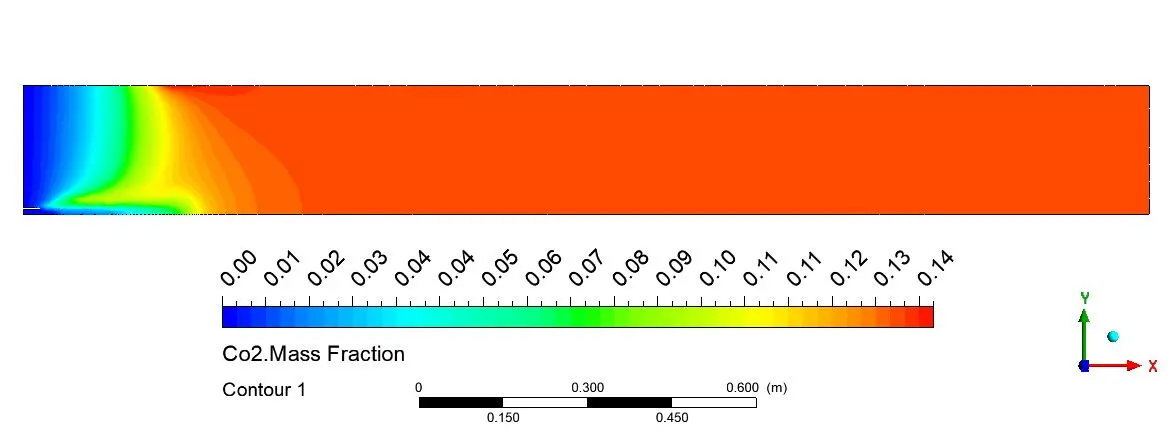
Figure 46. Contours of Mass Fraction of CO2
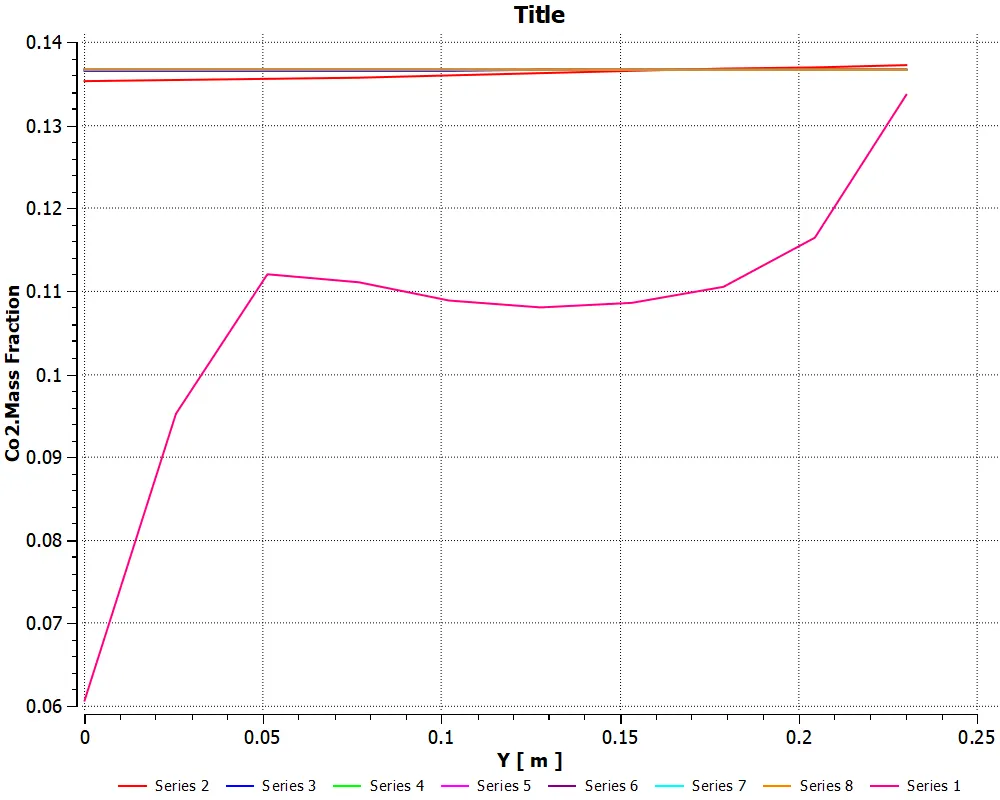
Figure 47. Plot for Mass Fraction of CO2
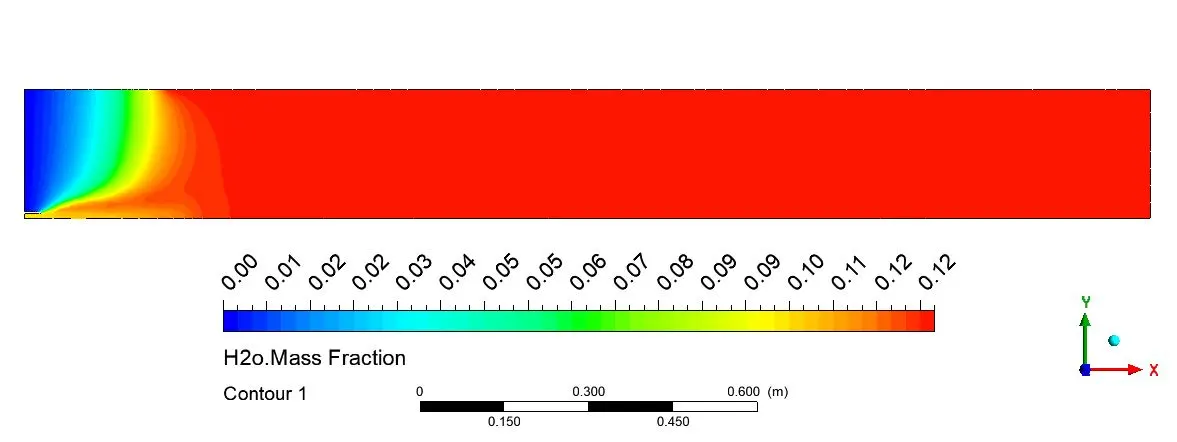
Figure 48. Contours of Mass Fraction of H2O
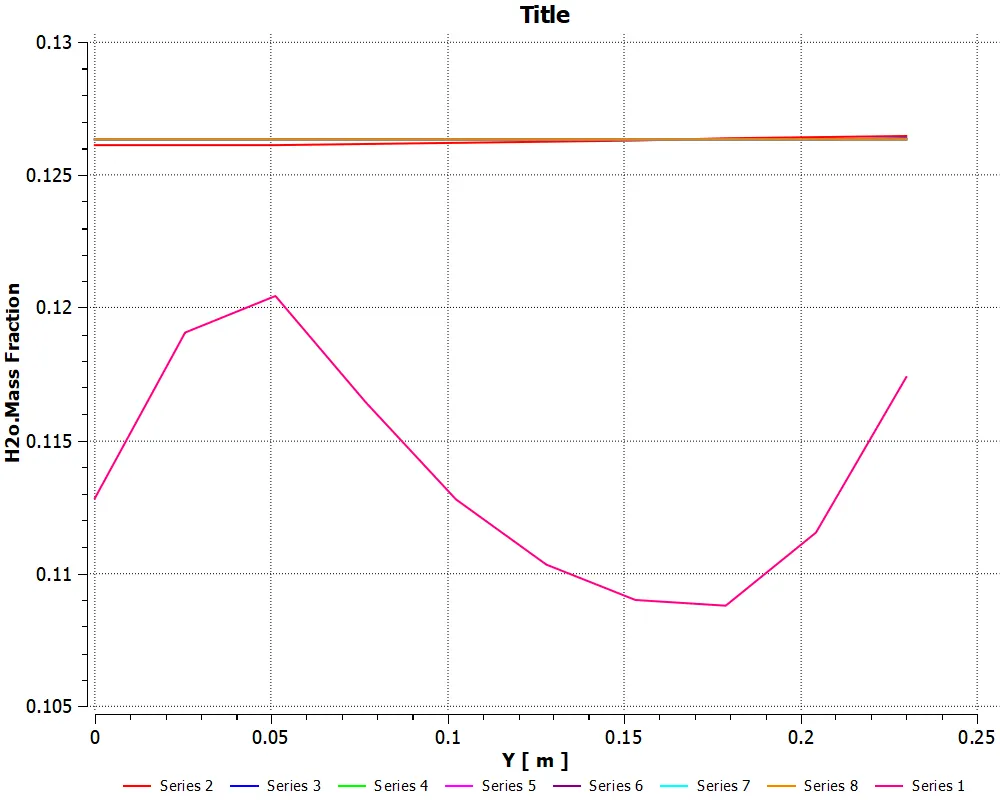
Figure 49. Plot for Mass Fraction of H2O
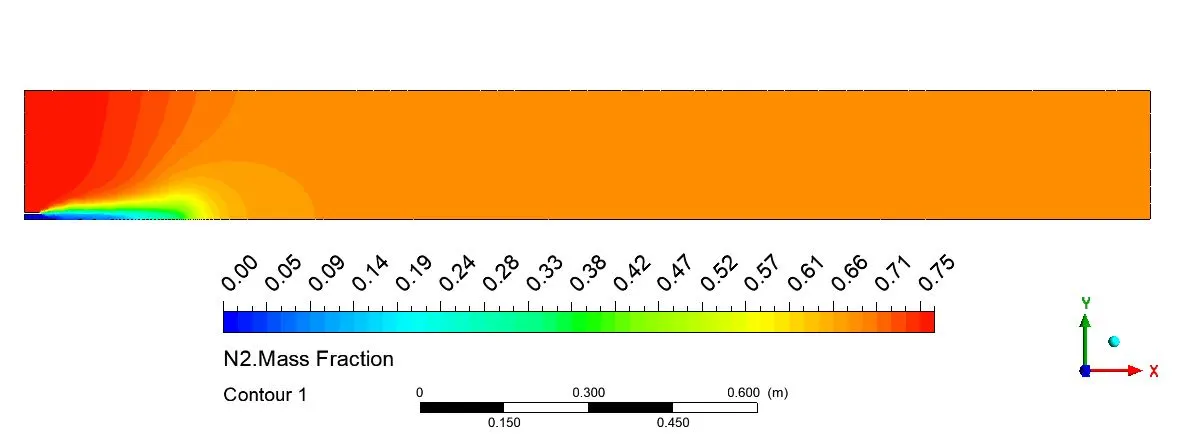
Figure 50. Contours of Mass Fraction of N2
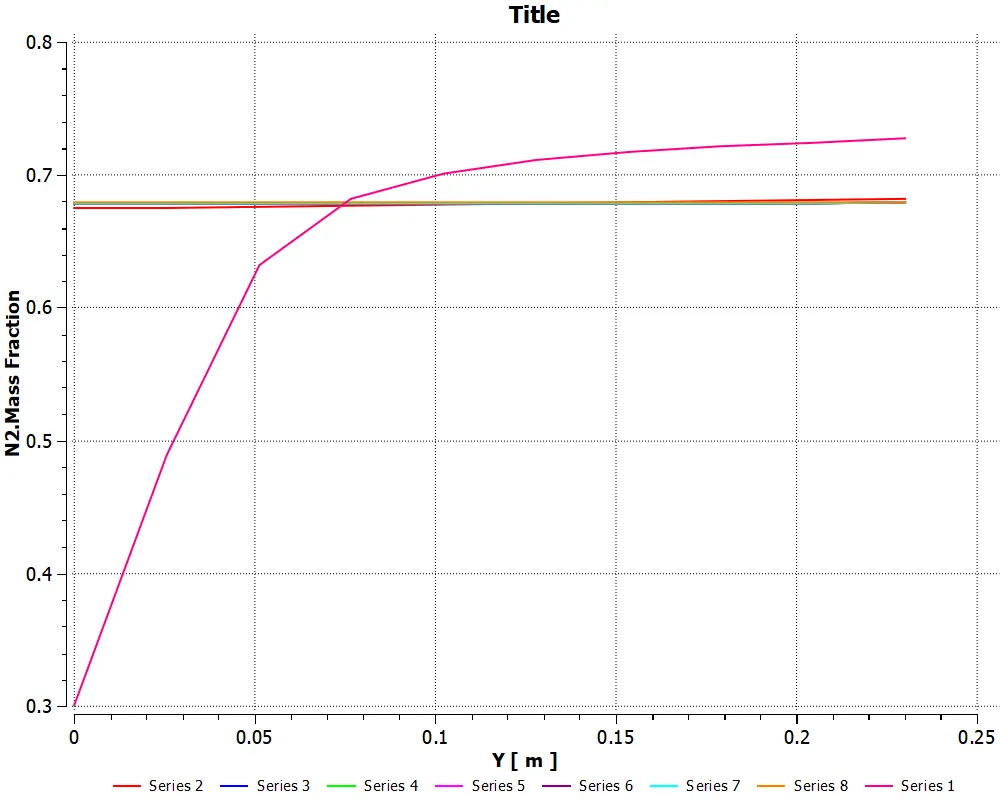
Figure 51. Plot for Mass Fraction of N2
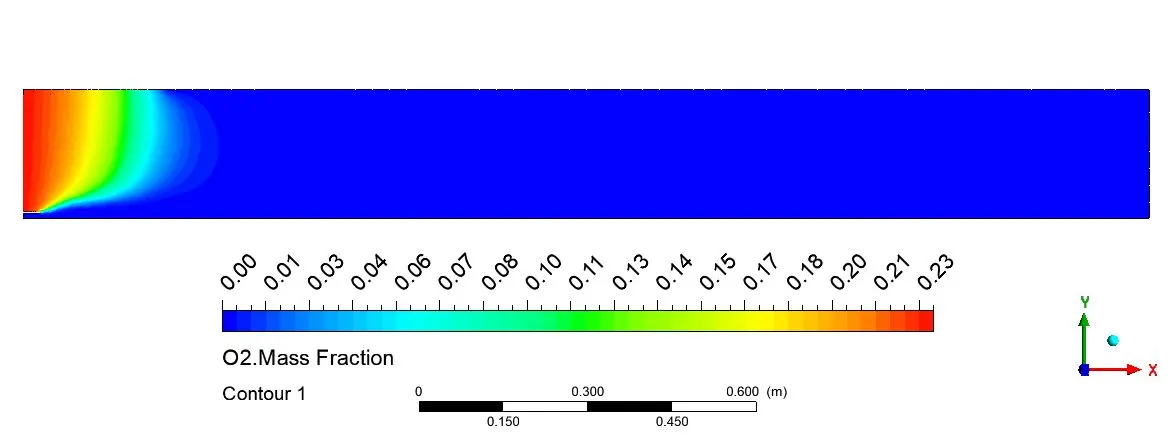
Figure 52. Contours of Mass Fraction of O2
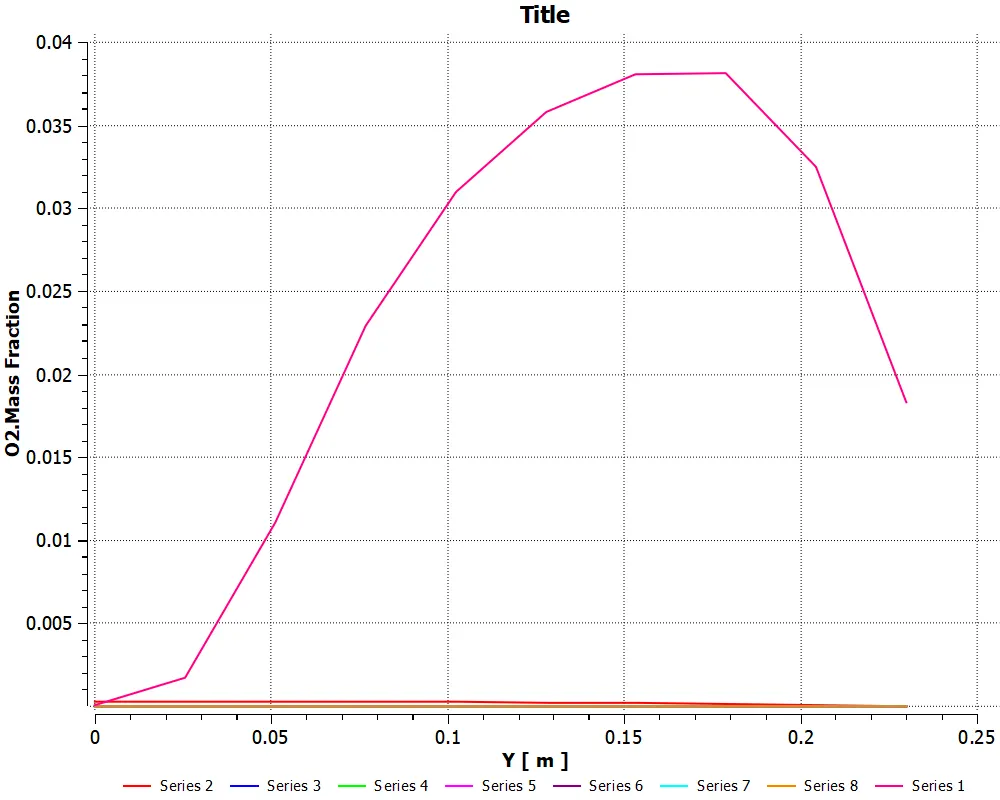
Figure 53. Plot for Mass Fraction of O2
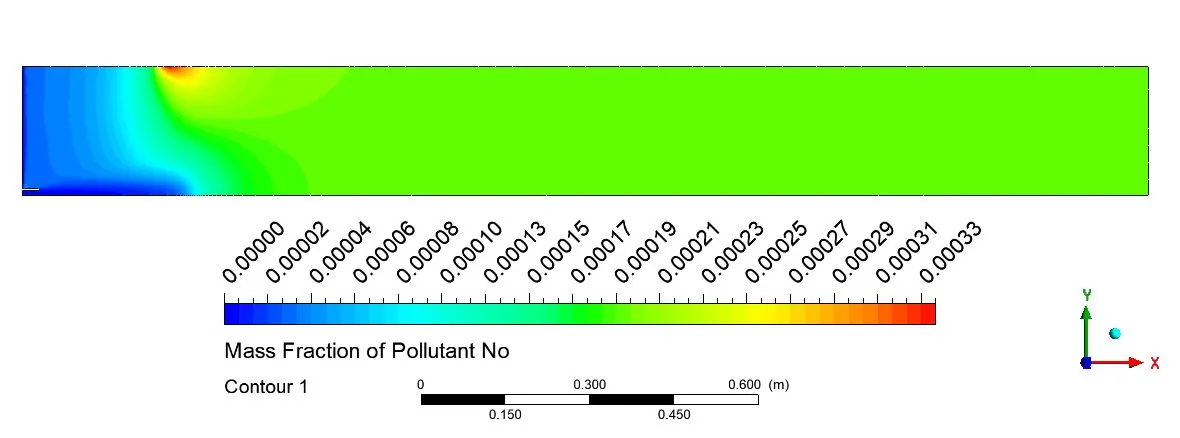
Figure 54. Contours of Mass Fraction of NOx
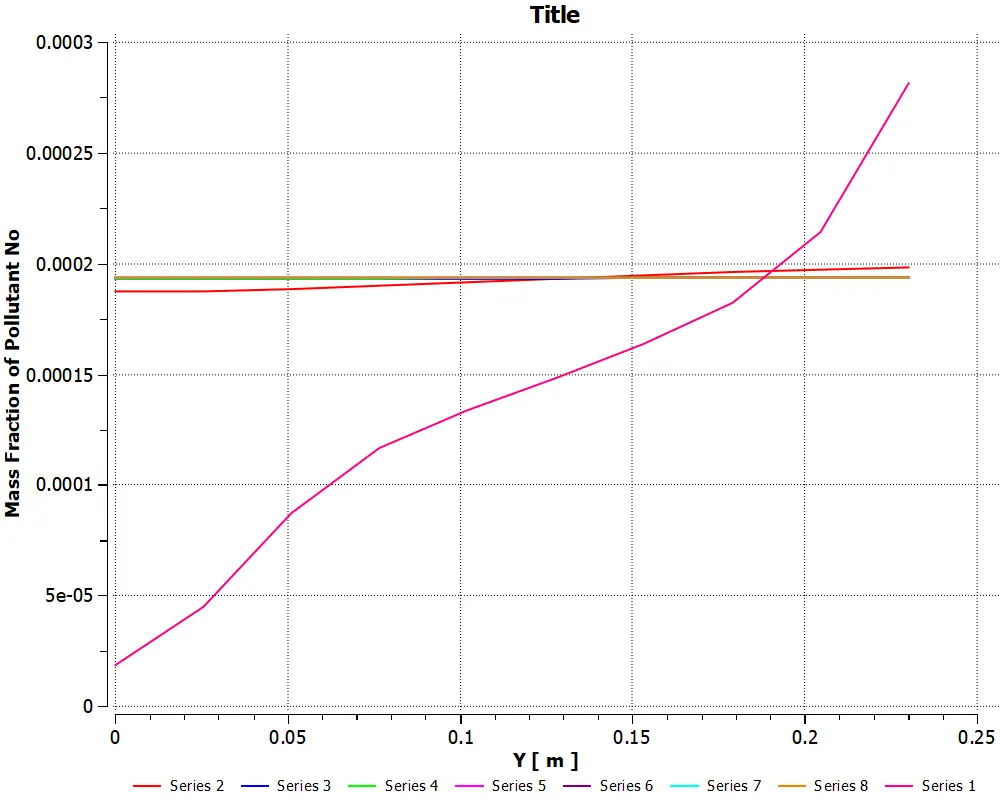
Figure 55. Plot for Mass Fraction of NOx
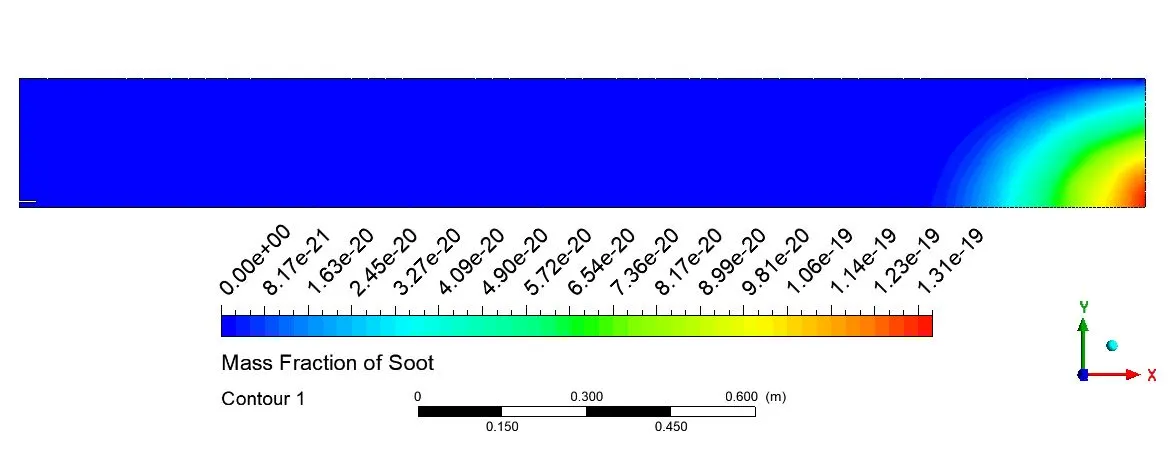
Figure 56. Contours of Mass Fraction of Soot
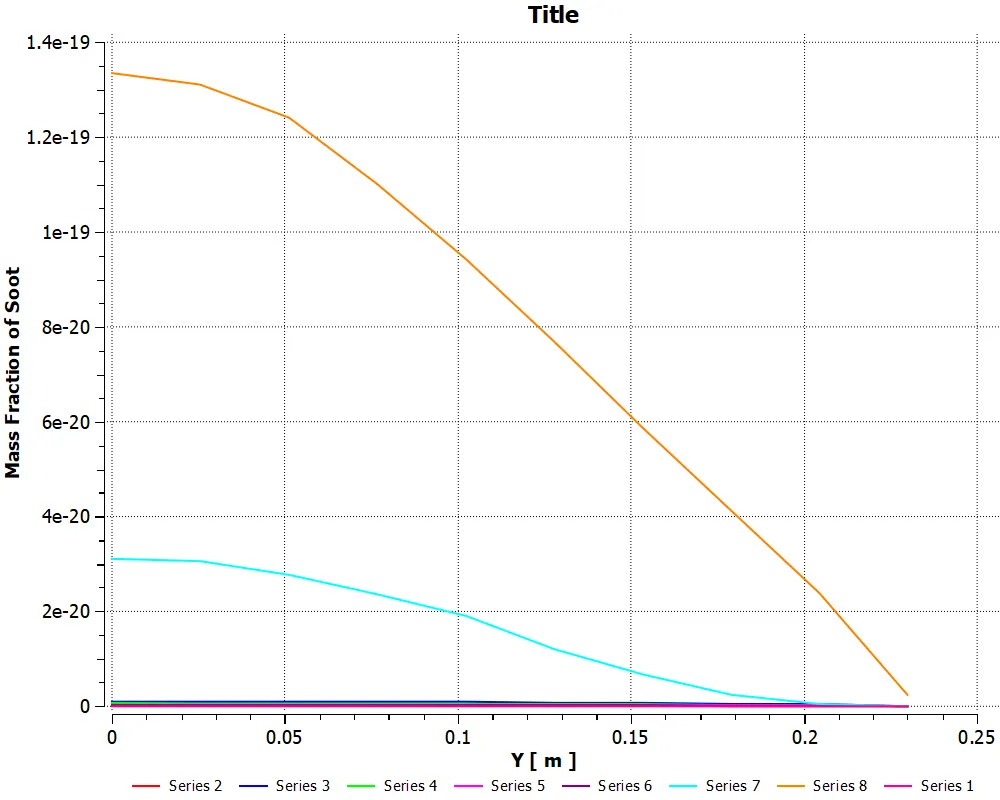
Figure 57. Plot for Mass Fraction of Soot
c) 20% H2O in Fuel: Fuel inlet (Species: H2O-0.2, CH4-0.8) for the addition of water content (20% by mole)
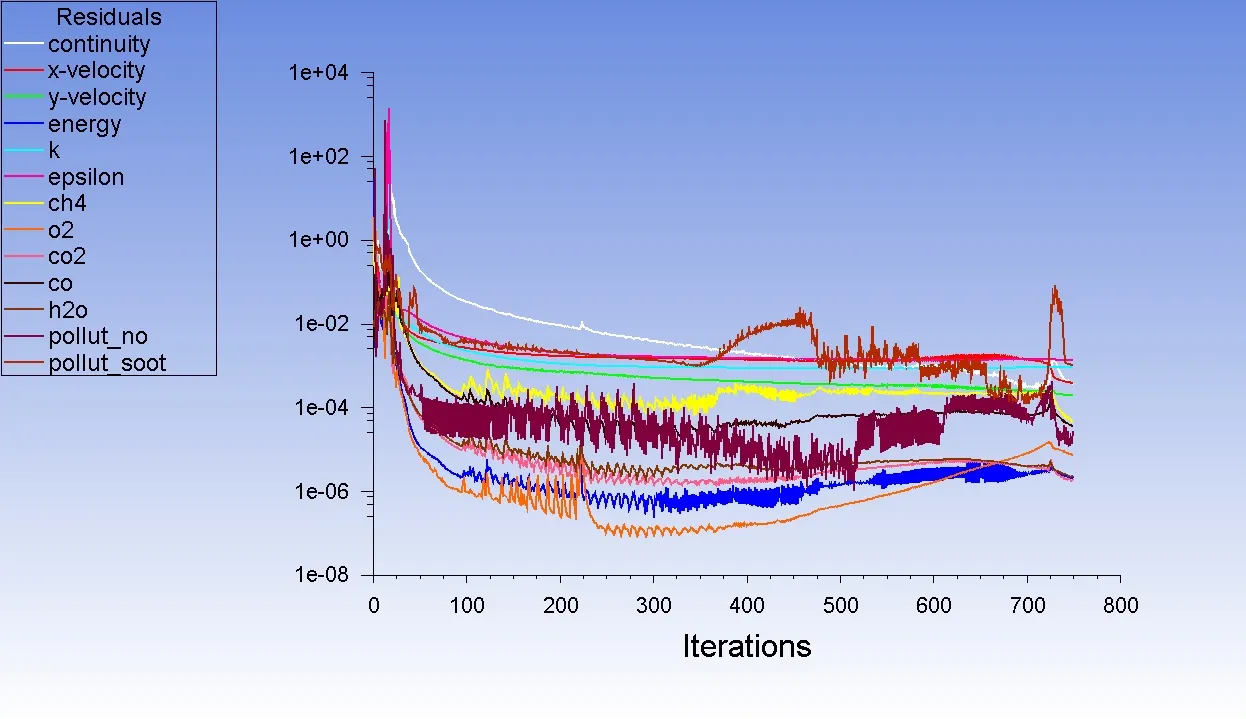
Figure 58. Residuals for 20% H2O in Fuel
Animation 4. 20% H2O in Fuel
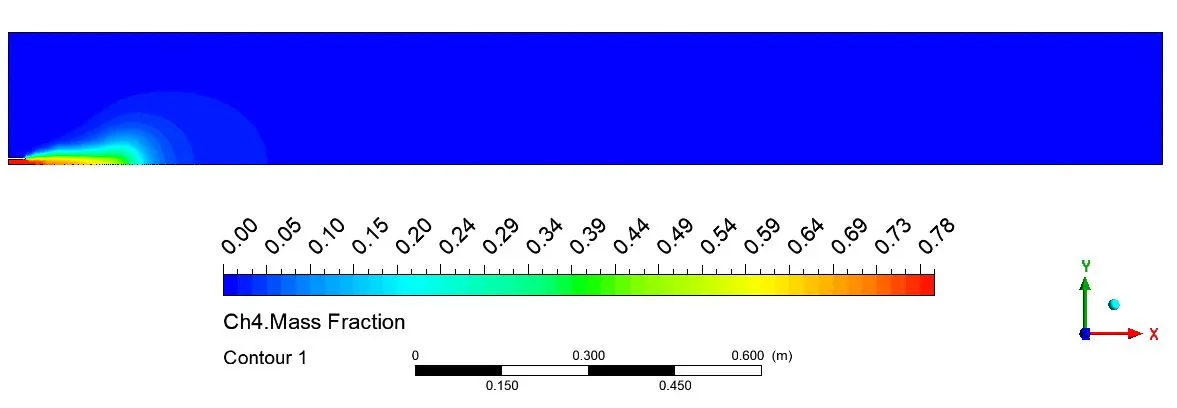
Figure 59. Contours of Mass Fraction of CH4
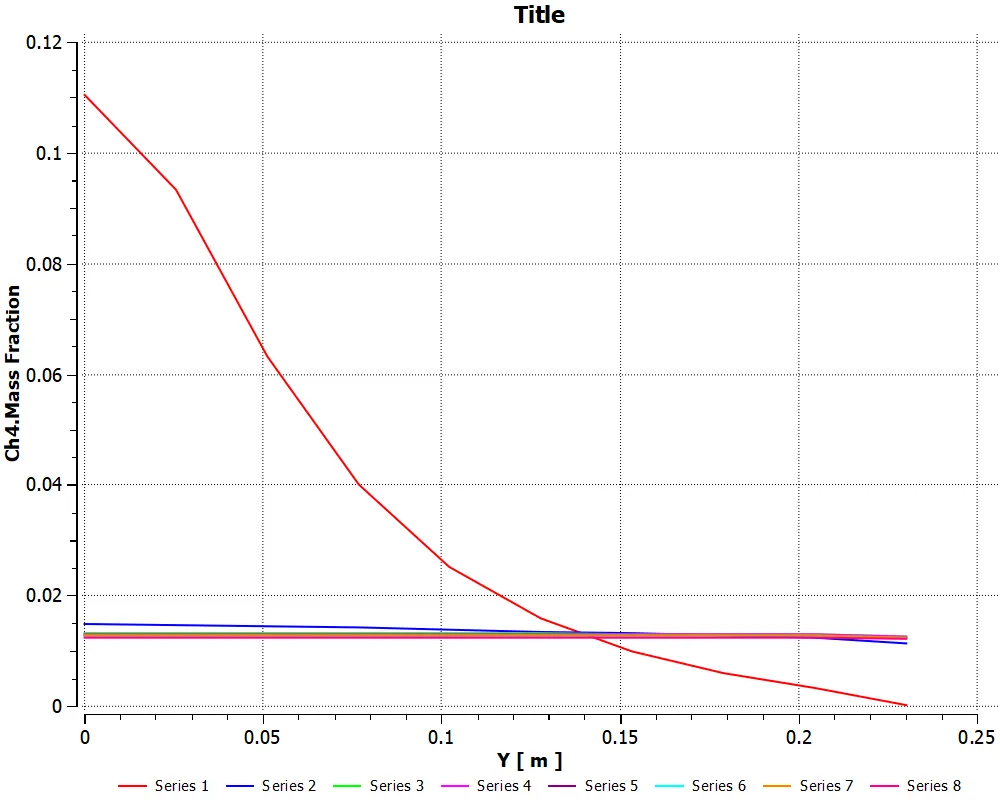
Figure 60. Plot for Mass Fraction of CH4
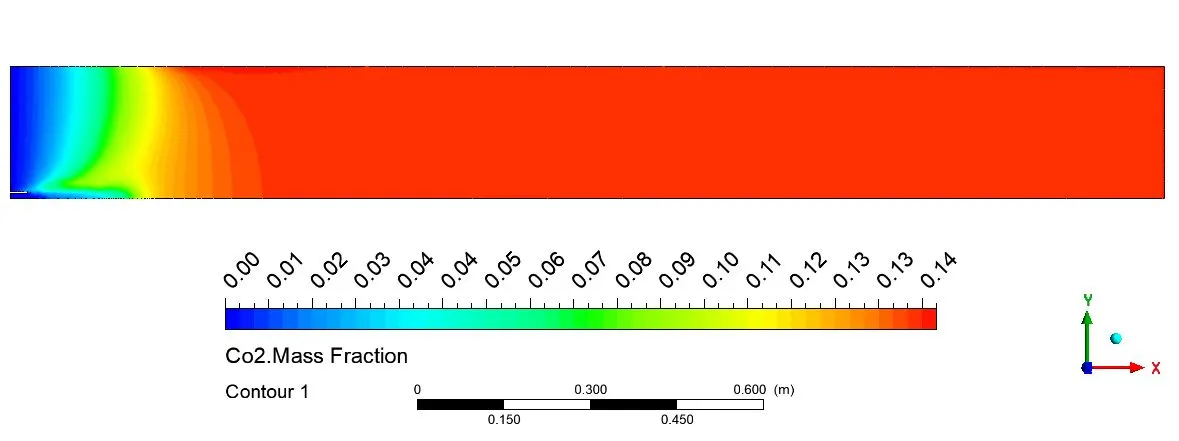
Figure 61. Contours of Mass Fraction of CO2
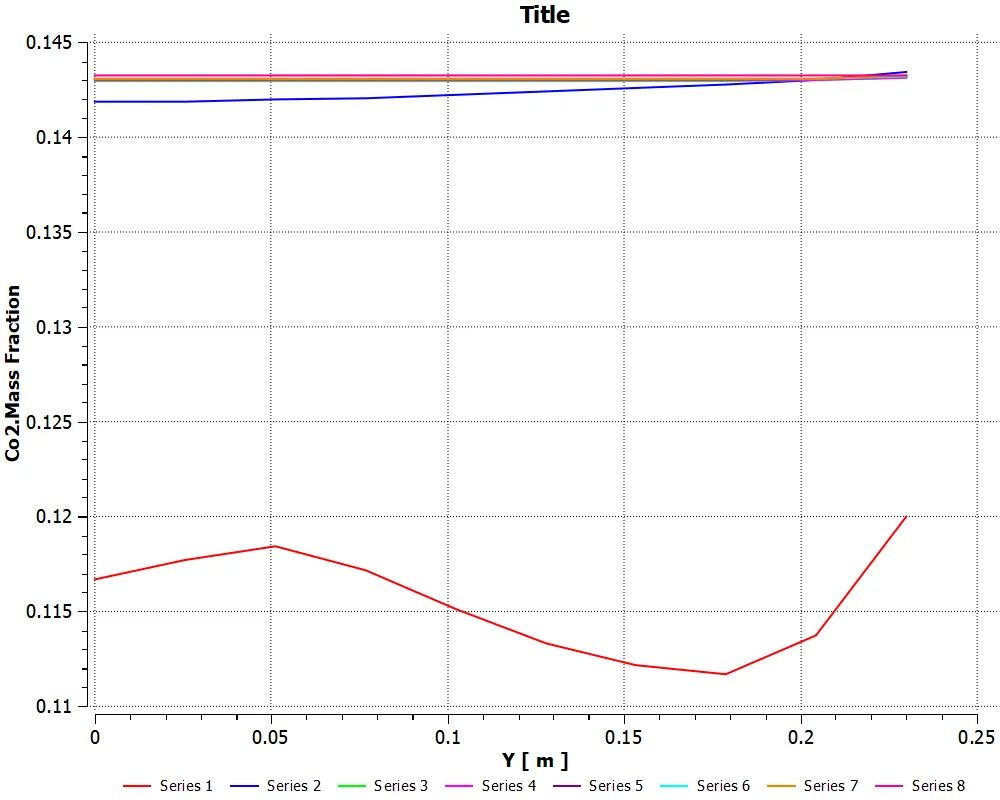
Figure 62. Plot for Mass Fraction of CO2
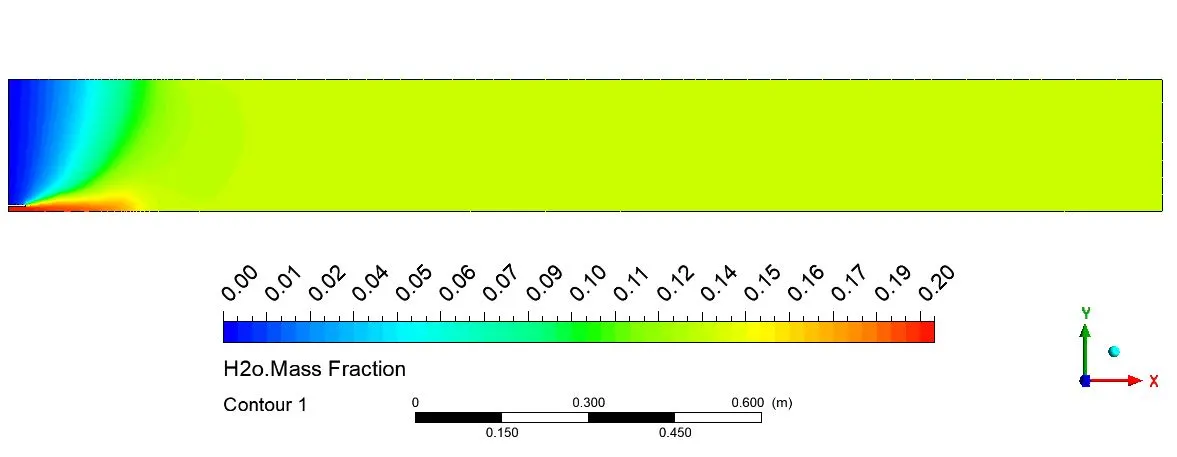
Figure 63. Contours of Mass Fraction of H2O
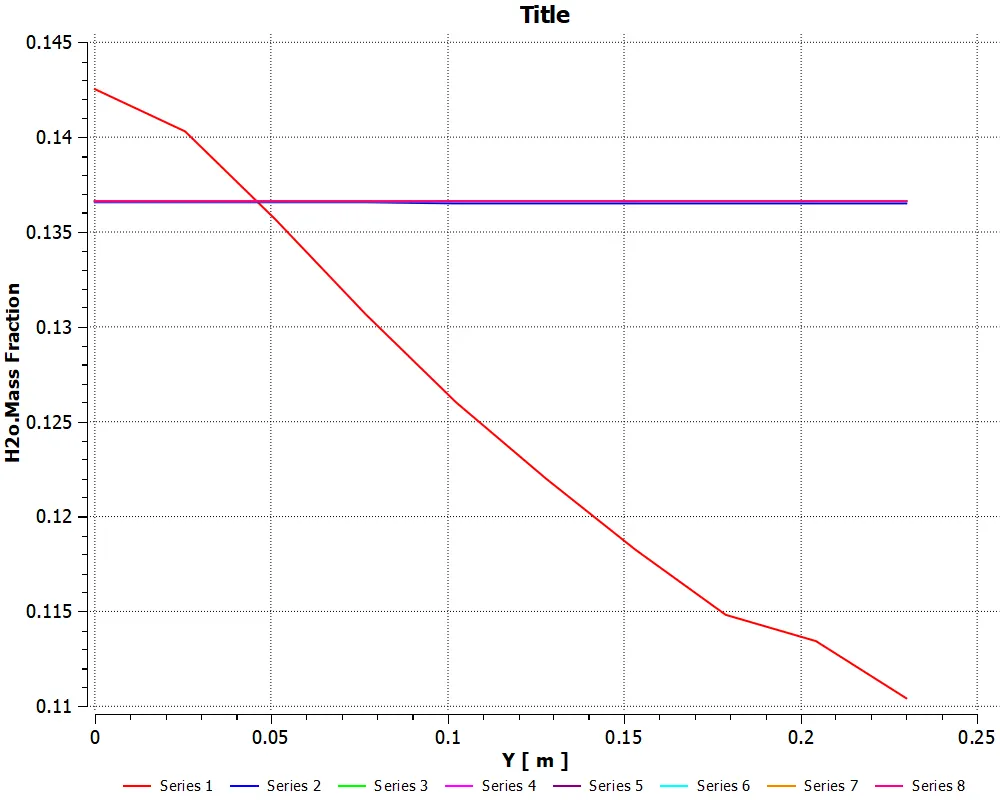
Figure 64. Plot for Mass Fraction of H2O
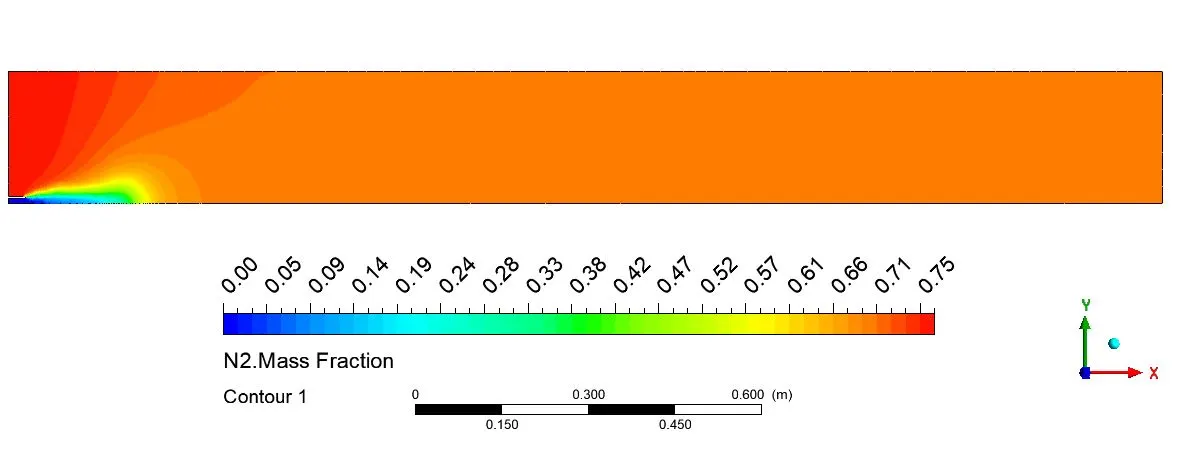
Figure 65. Contours of Mass Fraction of N2
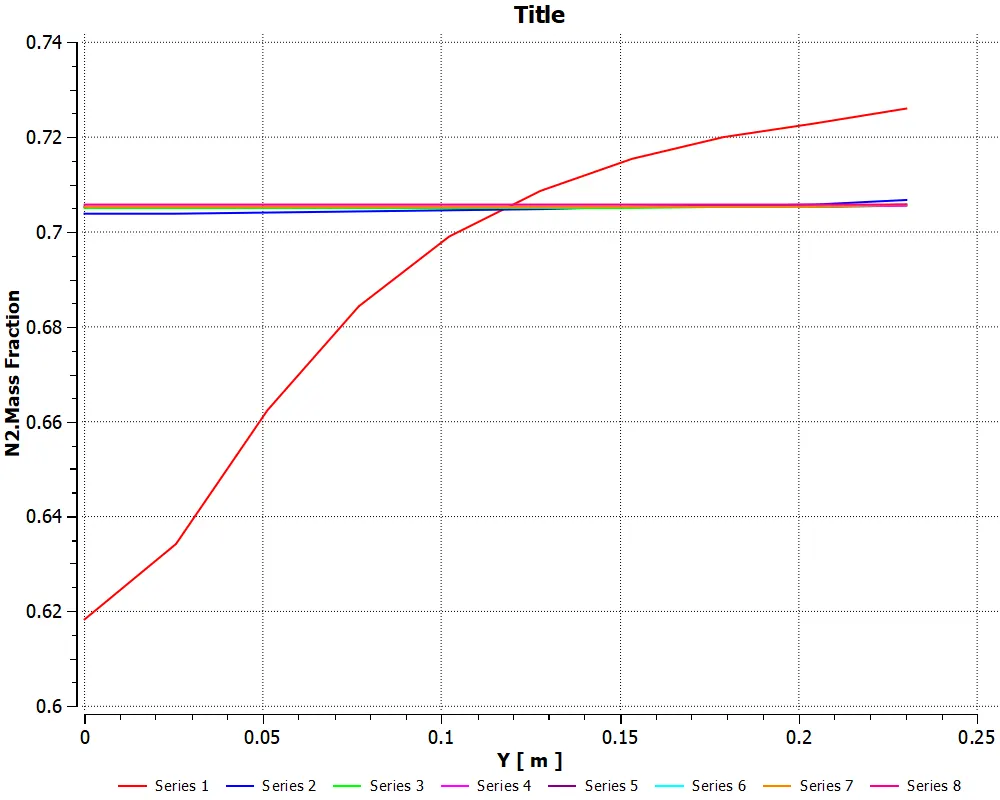
Figure 66. Plot for Mass Fraction of N2
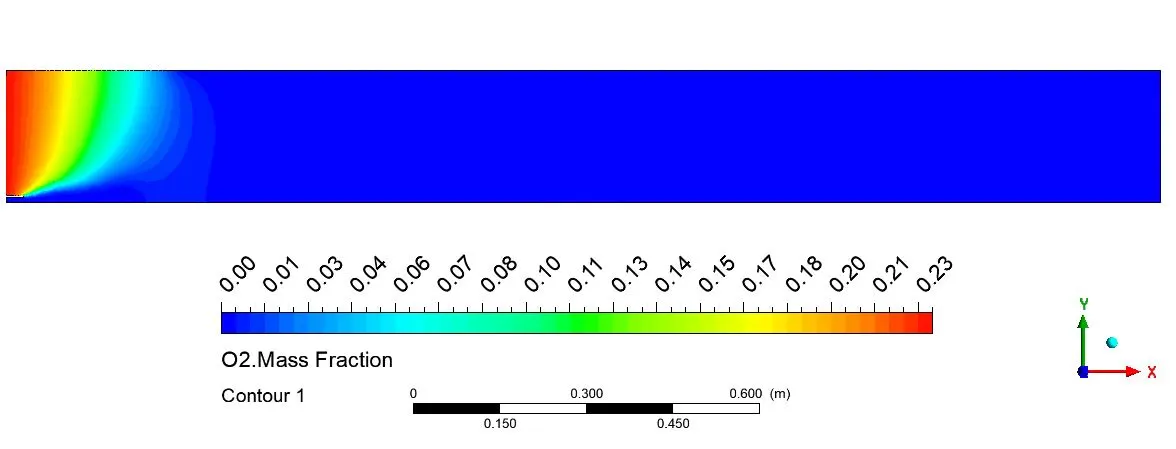
Figure 67. Contours of Mass Fraction of O2
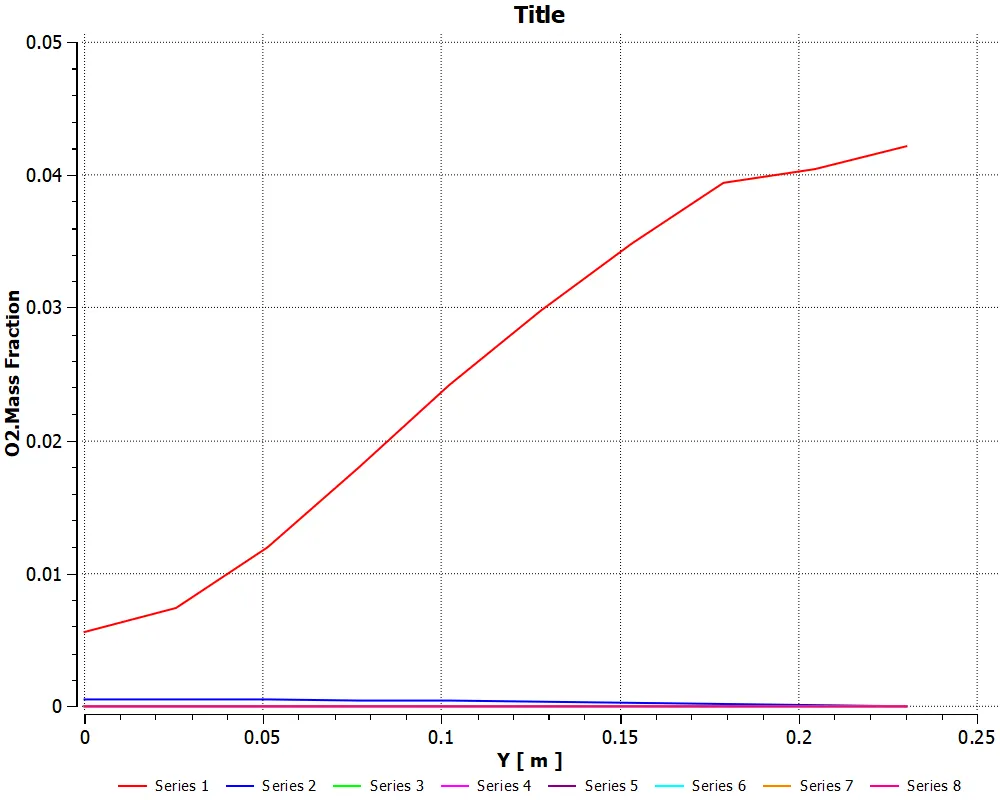
Figure 68. Plot for Mass Fraction of O2
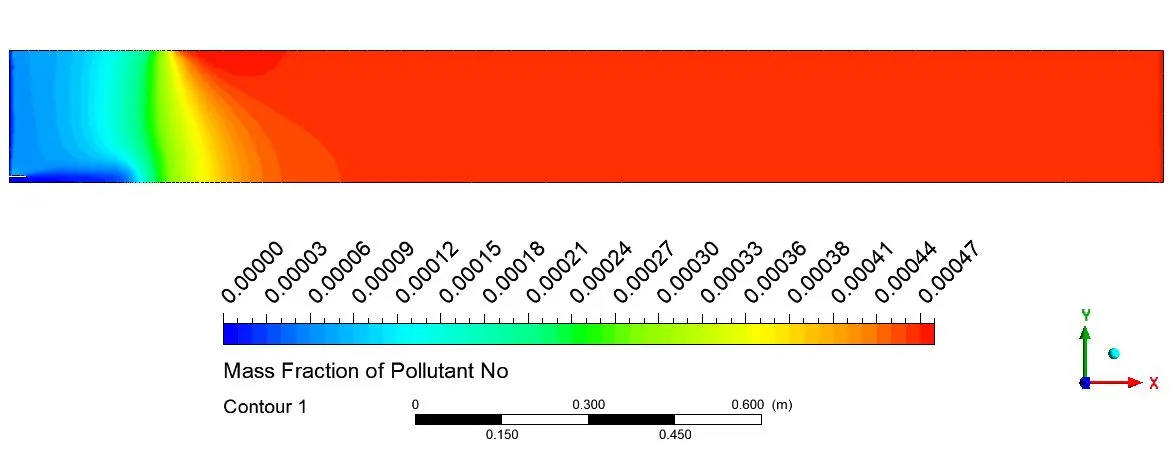
Figure 69. Contours of Mass Fraction of NOx
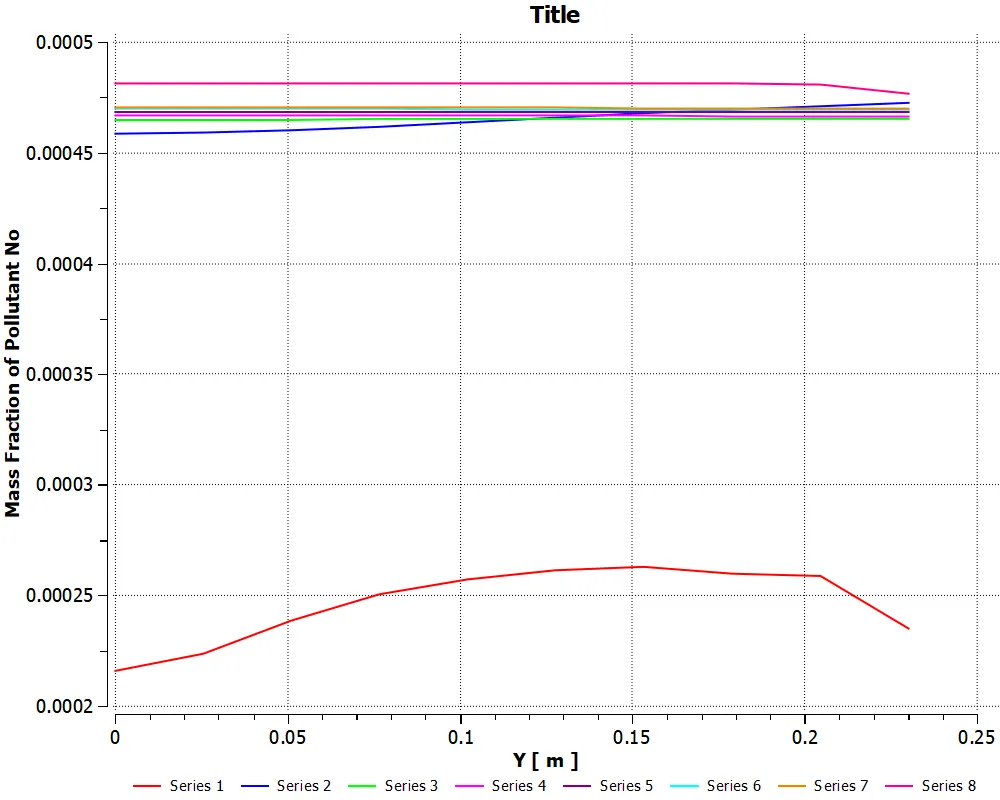
Figure 70. Plot for Mass Fraction of NOx
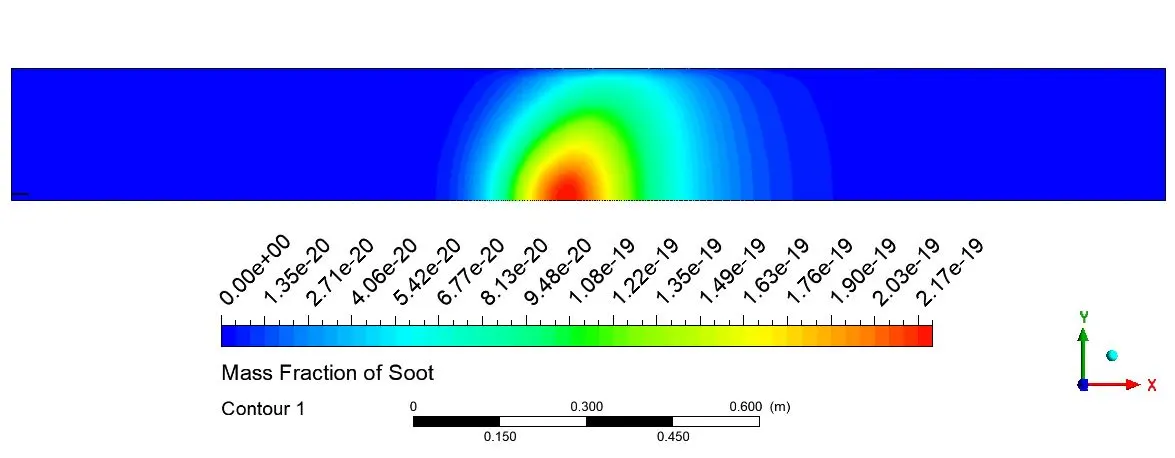
Figure 71. Contours of Mass Fraction of Soot
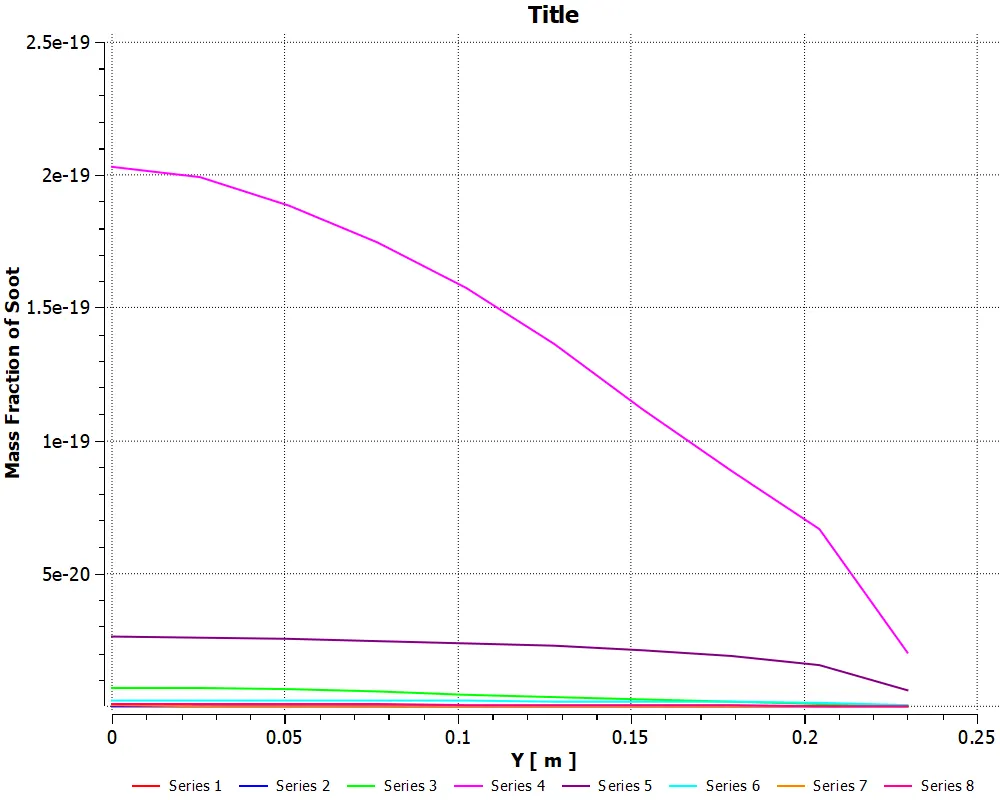
Figure 72. Plot for Mass Fraction of Soot
d) 30% H2O in Fuel: Fuel inlet (Species: H2O-0.2, CH4-0.7) for the addition of water content (30% by mole)
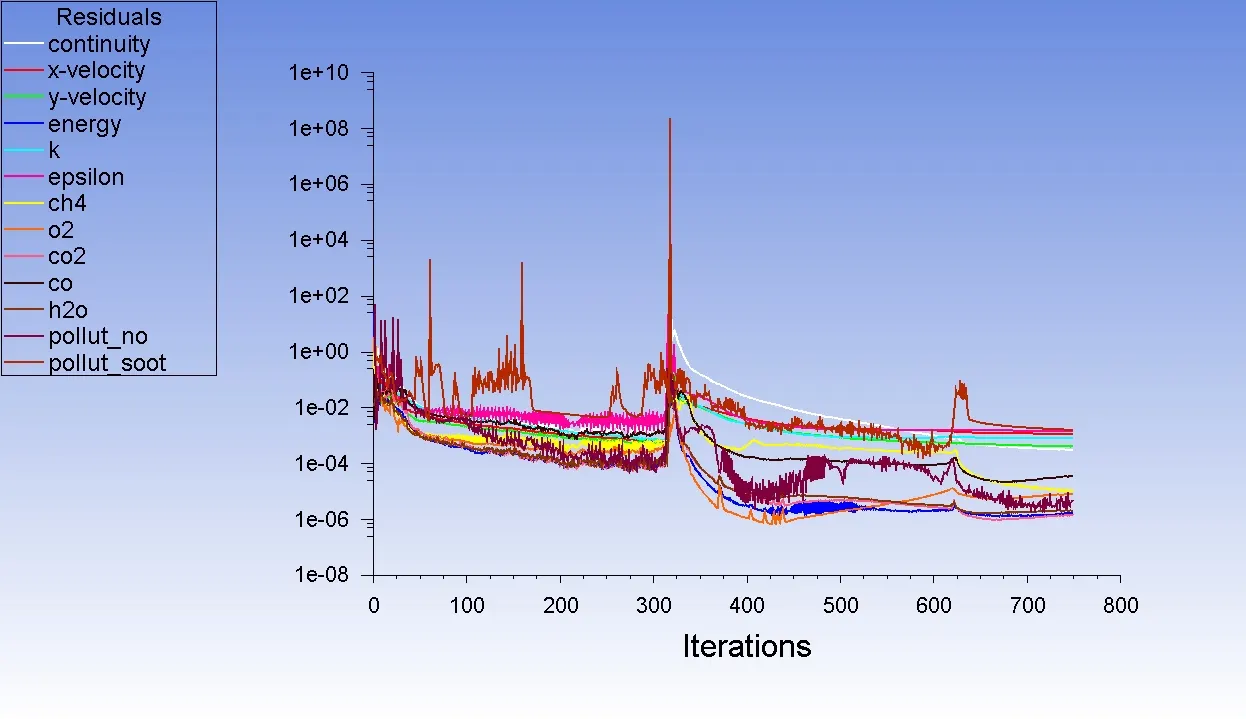
Figure 73. Residuals for 30% H2O in Fuel
Animation 5. 30% H2O in Fuel
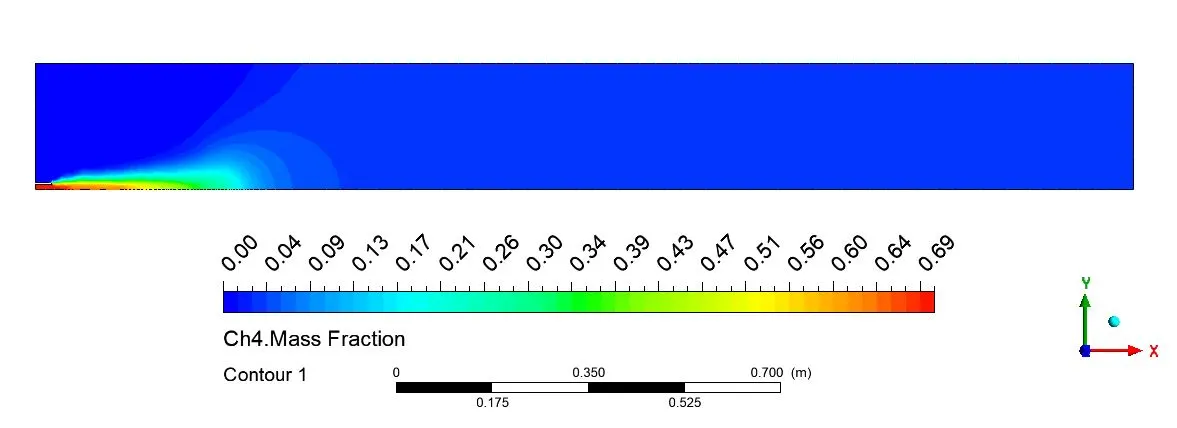
Figure 74. Contours of Mass Fraction of CH4
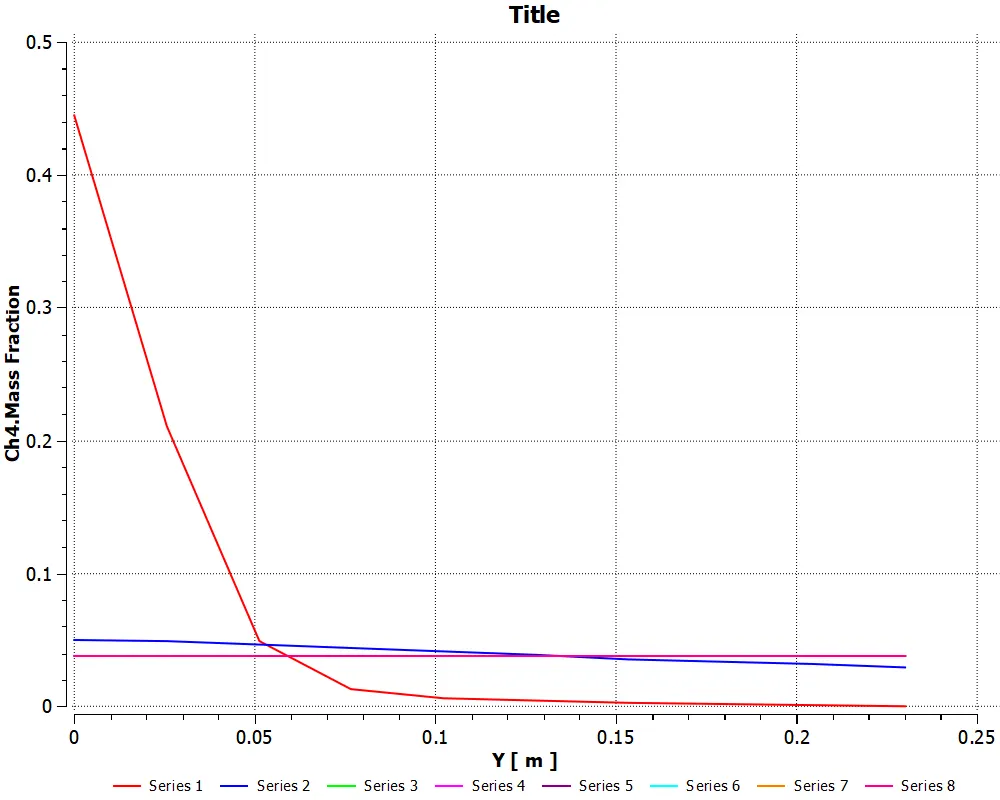
Figure 75. Plot for Mass Fraction of CH4
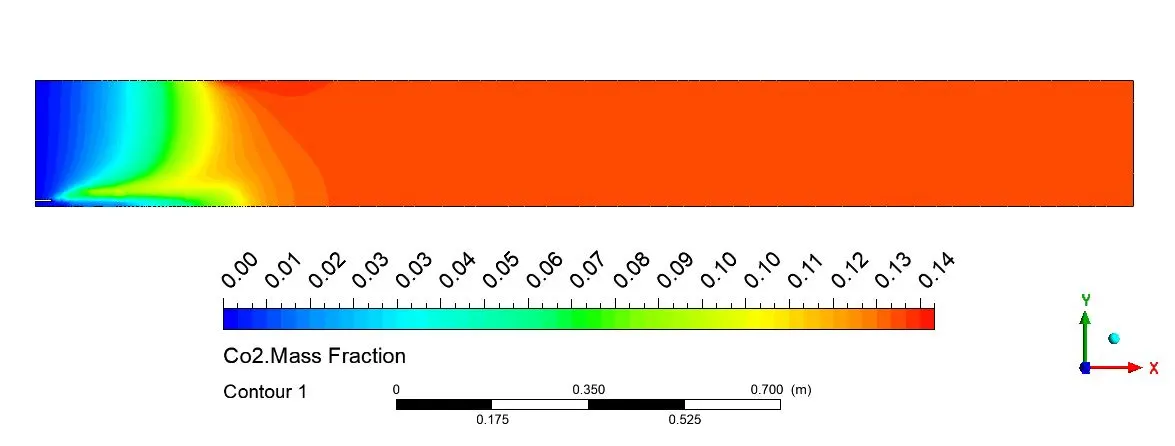
Figure 76. Contours of Mass Fraction of CO2
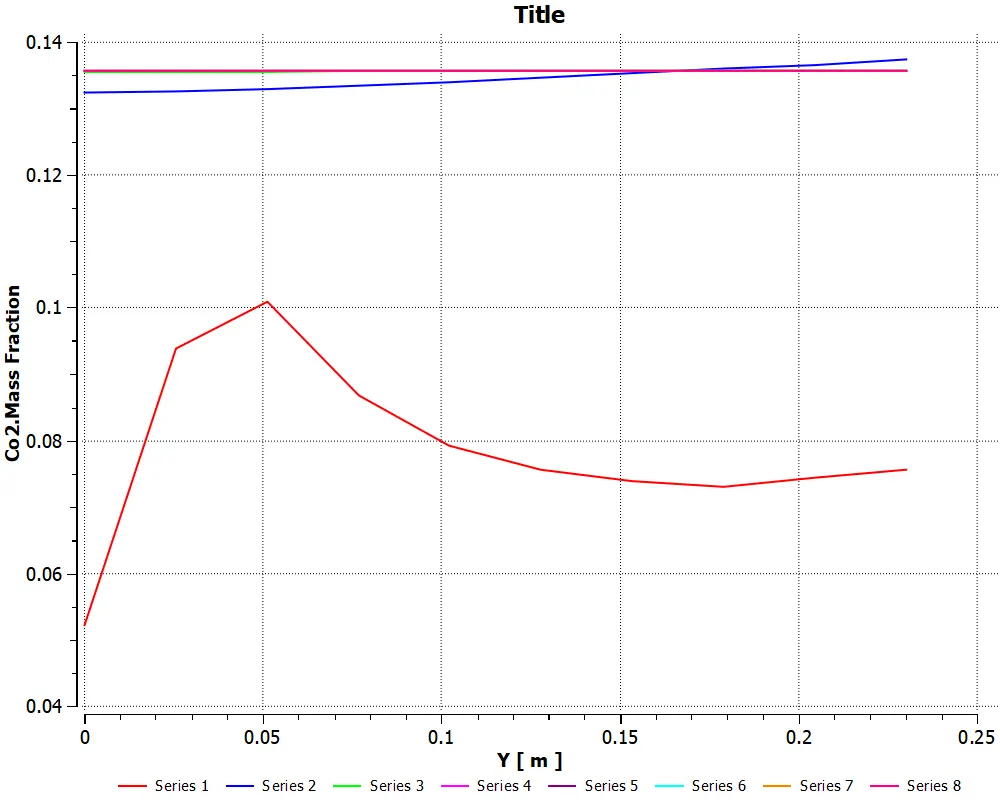
Figure 77. Plot for Mass Fraction of CO2
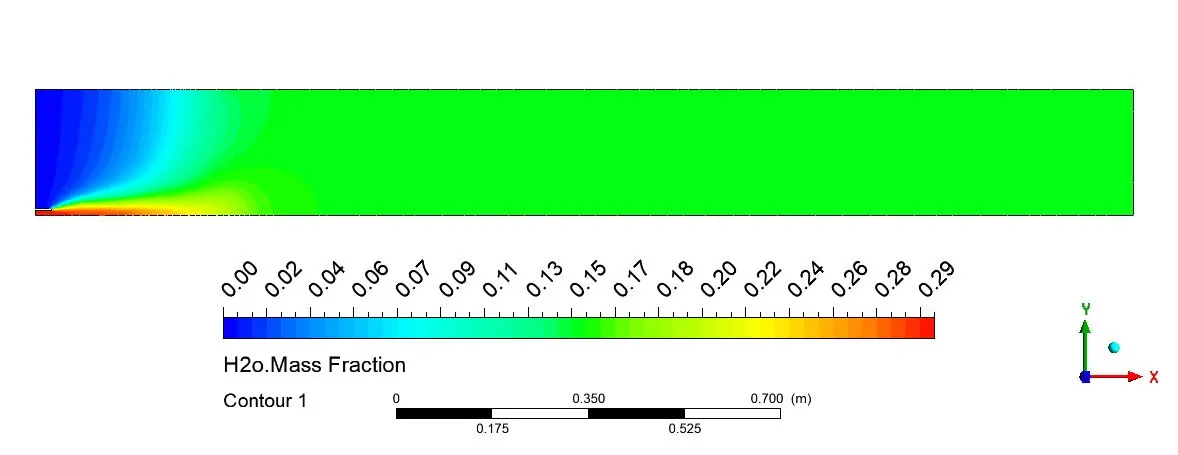
Figure 78. Contours of Mass Fraction of H2O
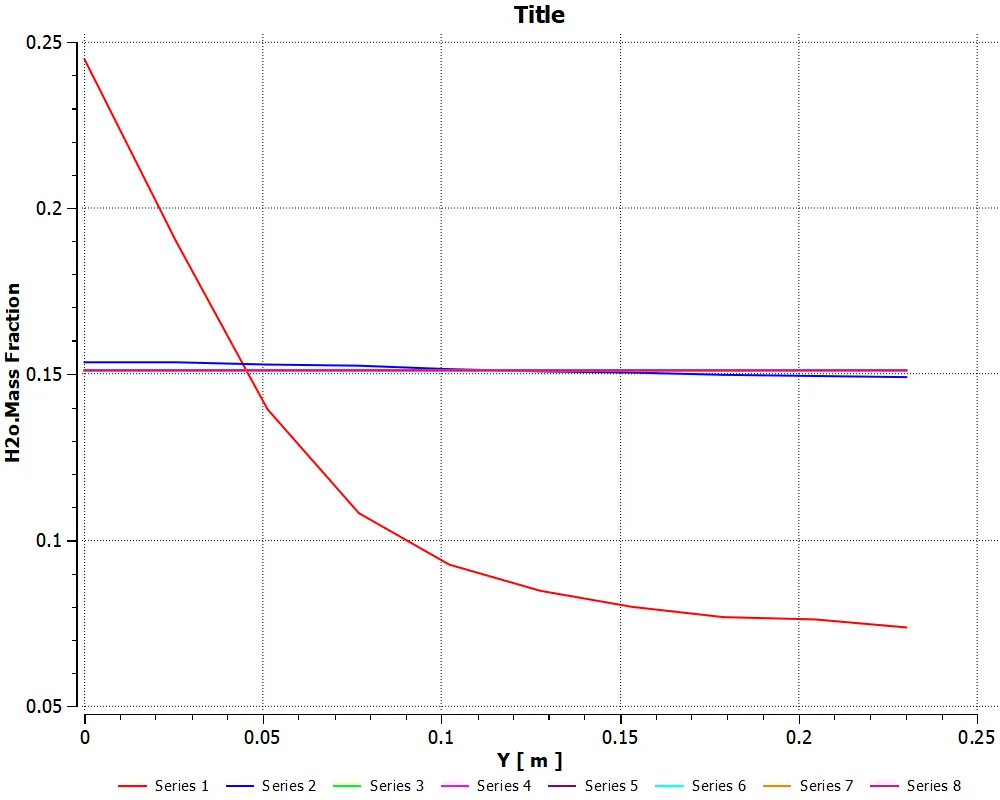
Figure 79. Plot for Mass Fraction of H2O
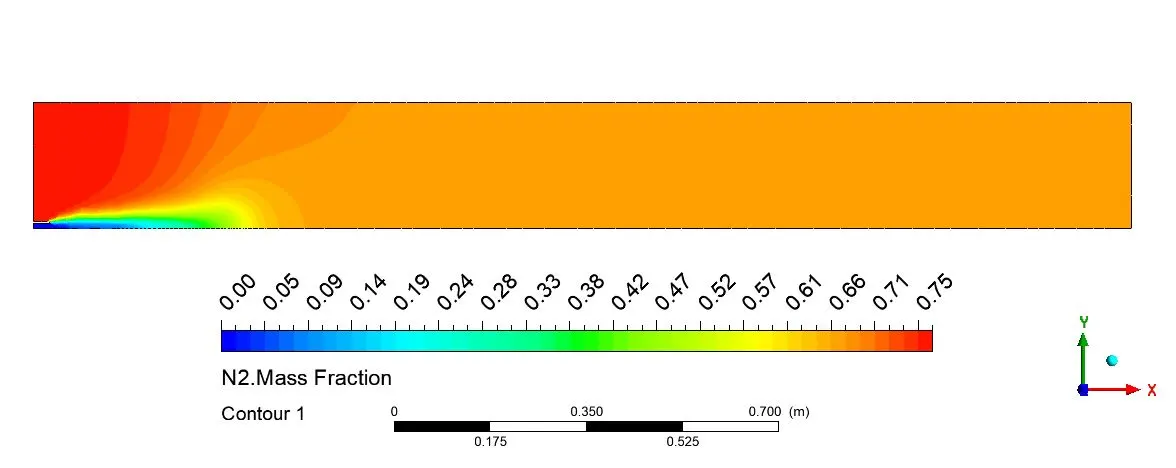
Figure 80. Contours of Mass Fraction of N2
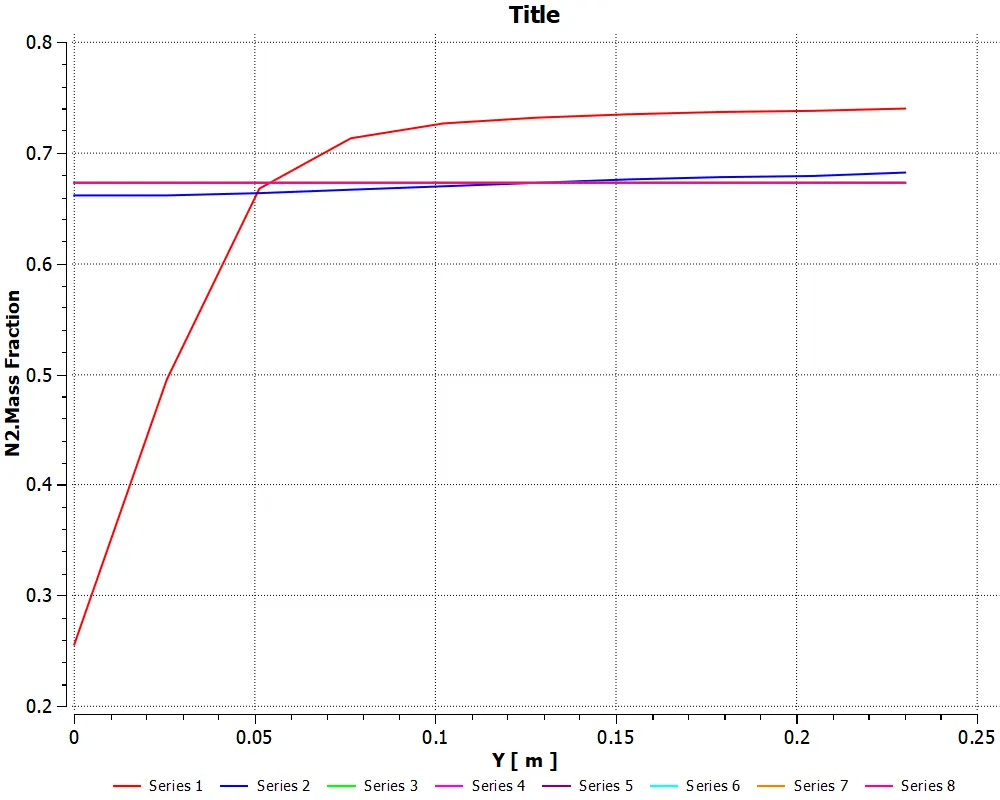
Figure 81. Plot for Mass Fraction of N2
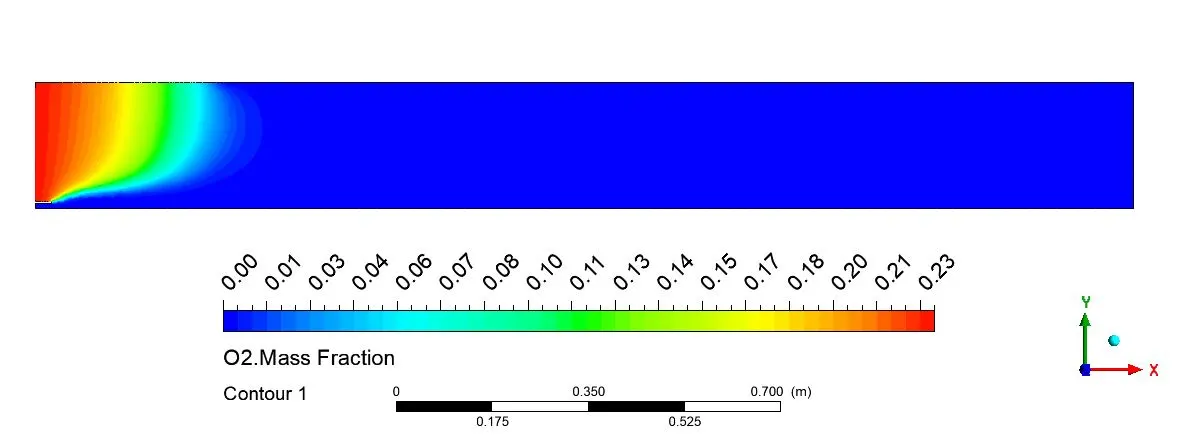
Figure 82. Contours of Mass Fraction of O2
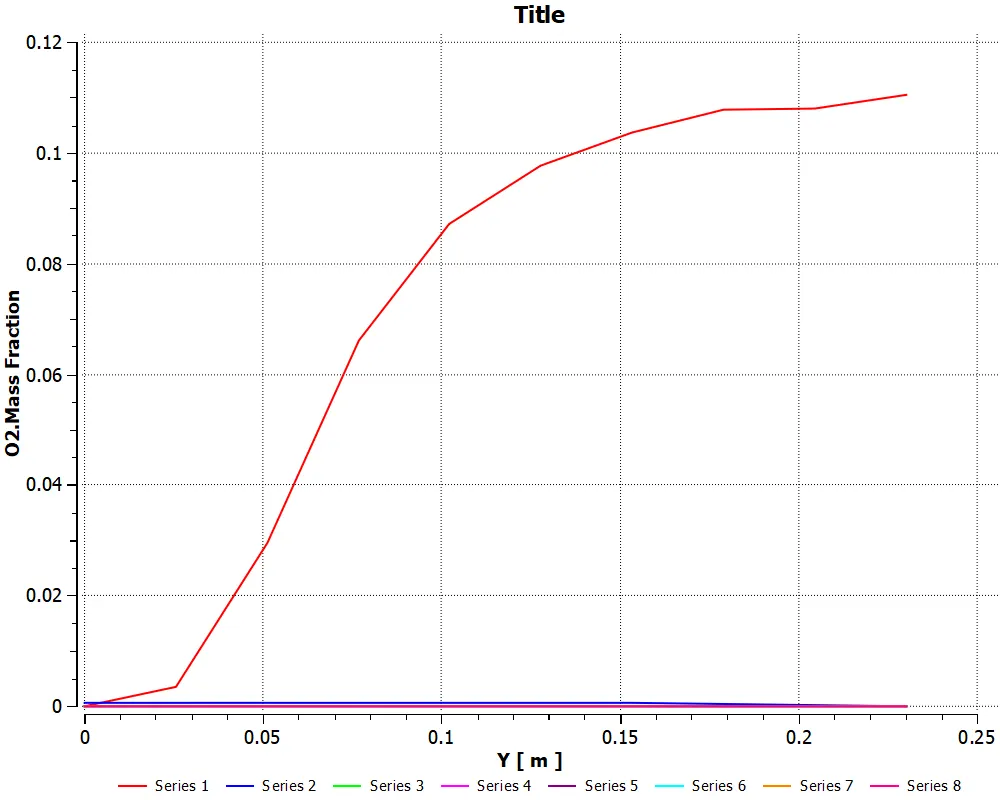
Figure 83. Plot for Mass Fraction of O2
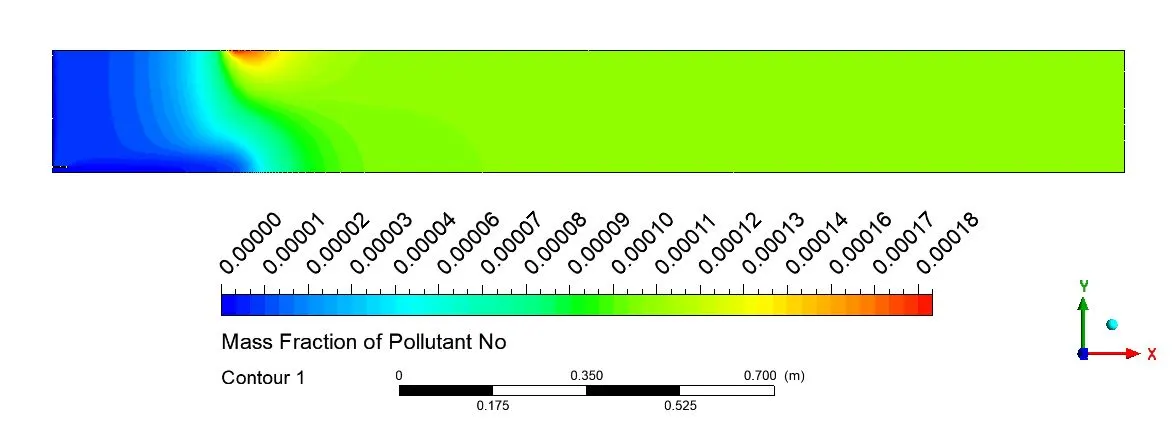
Figure 84. Contours of Mass Fraction of NOx
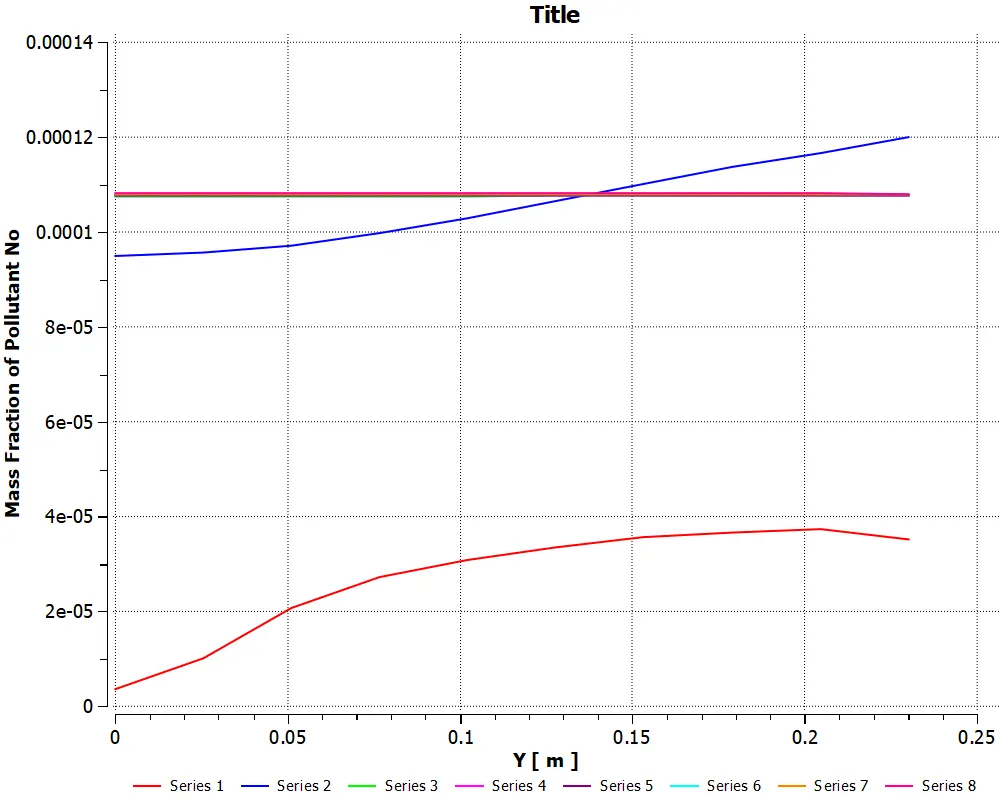
Figure 85. Plot for Mass Fraction of NOx
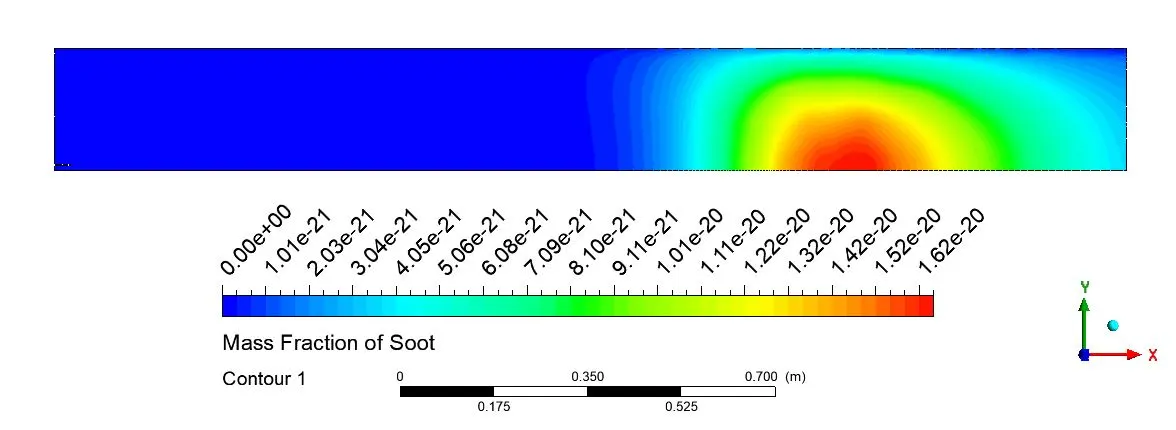
Figure 86. Contours of Mass Fraction of Soot
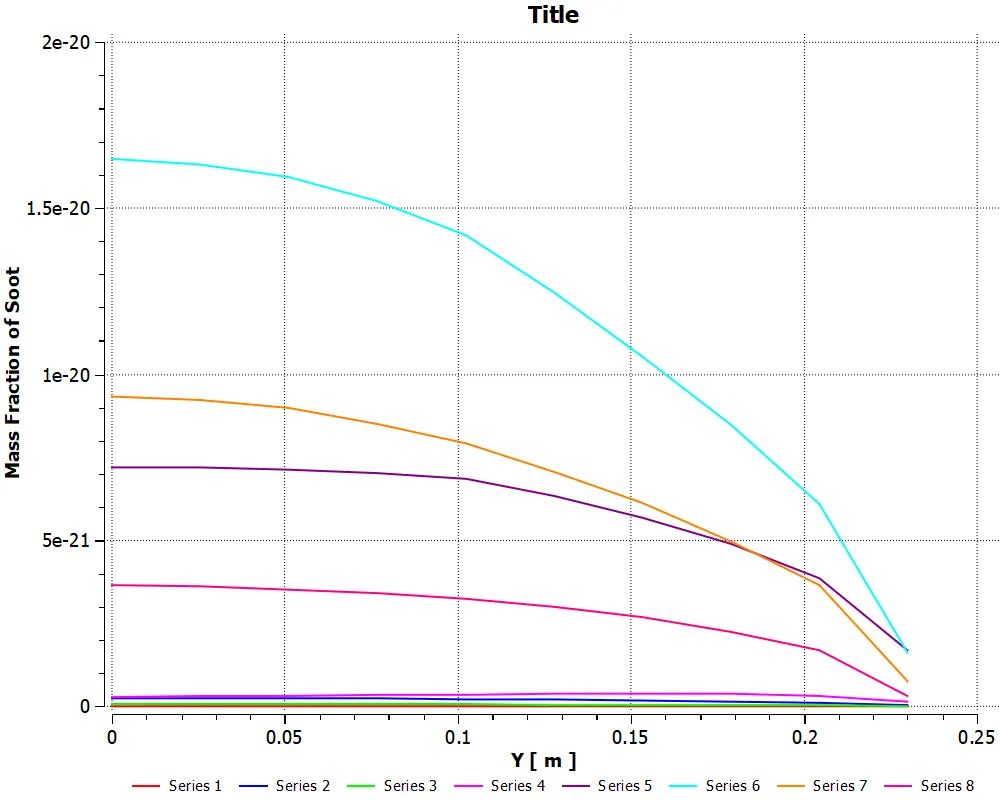
Figure 87. Plot for Mass Fraction of Soot
Conclusion-
- All the combustion simulations are done by the Eddy Dissipation model with the volumetric turned on. The model is used along with the turbulence model.
- NOx and Soot concentrations generated in the combustion are very low. So, it has little influence on the flow field and predictions, temperature, and other combustion products.
- The contour of CO2 and O2 are more or less the same which signifies that the species mass fraction depends on the effective combustion taking place.
- From the contour of CH4 and H2O, it can be observed that the mass fraction of CH4 decreases with an increase in the mass fraction of H2O by mole.