Centrifugal pump design and analysis
Aim:- To simulate the Centrifugal pump and obtain relationship between Pressure ratio and mass flow rate.
Theory:-
Centrifugal pumps are used to transport fluids by the conversion of rotational kinetic energy to the hydrodynamic energy of the fluid flow. The rotational energy typically comes from an engine or electric motor. They are a sub-class of dynamic axisymmetric work-absorbing turbomachinery. Fluid enters axially through the eye of the casing, is caught up in the impeller blades, and is whirled tangentially and radially outward until it leaves through all circumferential parts of the impeller into the diffuser part of the casing. The fluid gains both velocity and pressure while passing through the impeller. The doughnut-shaped diffuser, or scroll, the section of the casing decelerates the flow and further increases the pressure.
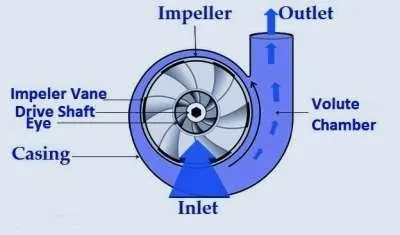
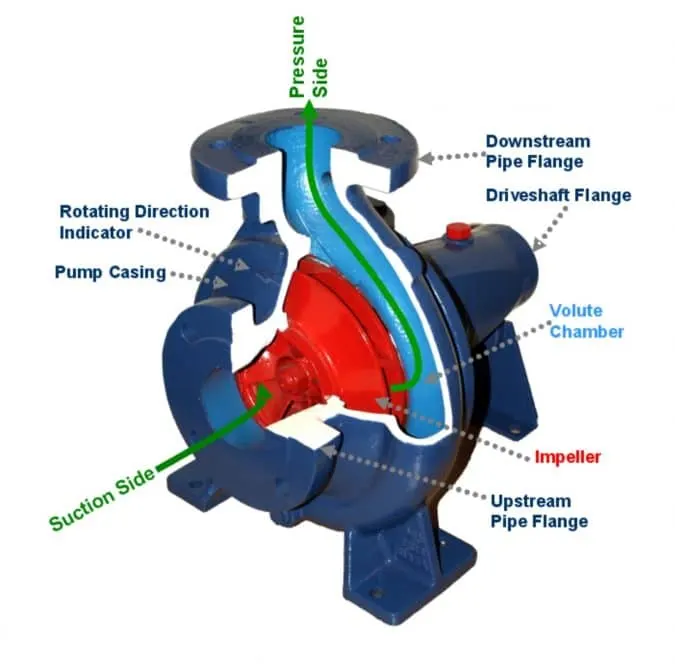
Procedure of simulation:-
1. Modelling of centrifugal pump in solidworks.
| Impeller | Casing | Inlet | Outlet |
| Inner Diameter: 0.04 m | Diameter:0.09 m | Diameter: 0.03 m | Diameter: 0.01 m |
| Outer Diameter: 0.08 m | Thickness: 0.001 m | Thickness: 0.001 m | Thickness: 0.001 m |
2. Creating rotating region.
Since SolidWorks cannot rotate the impeller and calculate the velocities, we define a field enclosing the region where fluid experience the rotation(volume within the casing) and specify its angular velocity. The software will calculate the flow fields outside of the rotating reference frame and then transfer them to the rotating region at the boundary.
3. Boundary conditions, goals are set and mesh is generated.
4. We perform a parametric study to analyse the variation in the outlet pressure by increasing the outlet velocity.
Results:-
Velocity cut plots:
Case 1:- Outlet velocity = 10m/s.
Case 2:- Outlet velocity = 15m/s.
Case 3:- Outlet velocity = 20m/s.
Case 4:- Outlet velocity = 25m/s.
Case 5:- Outlet velocity = 30m/s.
Parametric study:
Mass flow rate is negative indicates mass is leaving the system.
Plots:
Conclusion:-
- From cut plots of velocity, we can observe that the fluid velocity is more at the blade tips.
- From the tabulated result of parametric study, we can conclude that as the outlet velocity increases both the pressures increase first and then decrease. And the mass flow rate increases with velocity.
- The output total pressure decreases rapidly and remains almost constant as the outlet velocity increases.
- The plot between Pressure ratio(Outlet Pressure/ Inlet Pressure) against mass flow rate shows that as the mass flow rate is increased, the pressure ratio decreases first and increases rapidly and again decreases rapldly and then increases again.