Centrifugal pump design and analysis
Aim :
To perform design and simulation over a Centrifugal Pump and to plot the graph between pressure ratio and mass flow rate.
Introduction :
Centrifugal pump is a hydraulic machine which converts mechanical energy into hydraulic energy by the use of centrifugal force acting on the fluid. These are the most popular and commonly used type of pumps for the transfer of fluids from low level to high level.
Its is used in places like agriculture, municipal (water and wastewater plants), industrial, power generation plants, petroleum, mining, chemical, pharmaceutical and many others.
When a certain mass of liquid is made to rotate by an external source, it is thrown away from the centrifugal axis of rotation and a head is impressed which enables it to rise to a higher level. Centrifugal Pumps can be used for viscous and non-viscous liquids and has higher efficiency.
The Main parts of Centrifugal Pump are:
- Impeller
It is a wheel or rotor which is provided with a series of backward curved blades or vanes. It is mounded on the shaft which is coupled to an external source of energy which imparts the liquid energy to the impeller there by making it to rotate.
- Casing
It is a pipe which is connected at the upper end to the inlet of the pump to the centre of impeller which is commonly known as eye.
- Delivery Pipe
It is a pipe which is connected at its lower end to the out let of the pump and it delivers the liquid to the required height.
- Suction Pipe
Suction pipe is connected with the inlet of the impeller and the other end is dipped into the sump of water.
Working of Centrifugal Pump
The first step in the operation of a centrifugal pump is priming. Priming is the operation in which suction pipe casing of the pump and the position of fluid with the liquid which is to be pumped so that all the air from the position of pump is driven out and no air is left. The necessity of priming of a centrifugal pump is due to the fact that the pressure generated at the centrifugal pump impeller is directly proportional to density of fluid that is in contact with it.
After the pump is primed the delivery valve is still kept closed and electric motor is started to rotate the impeller. The delivery valve is kept closed in order to reduce valve is opened the liquid is made to flow in an outward radial direction there by vanes of impeller at the outer circumference with high velocity at outer circumference due to centrifugal action vacuum is created.
This cause liquid from sump to rush through suction pipe to eye of impeller thereby replacing long discharge from center circumference of the impeller is utilized in lifting liquid to required height through delivery pipe.
Procedure :
3D model of a centrifugal pump is created using Solidworks CAD software.
While simulating this project, we can not actually rotate the impeller so we have to create a boss extrude just to give this controlled volume of rotation. ( This is just to make Solidworks understand that this much volume is rotating. So additional volume is created for the rotational effect of the pump.
Starting with Solidworks simulation –
- New wizard –
- Keep the unit system default.
- Flow – Internal fluid flow with rotation.
- Working fluid – water
- Make sure the rotating controlled volume is not taken into consideration as a wall. This is done by unchecking the box which can found in component control under input data.
- Boundary Conditions –
- Inlet boundary condition – environmental pressure
- Outlet boundary condition – outlet volume (10m/s)
- Meshing – automatic level -3
- We are going for 500 iterations because the values can be converge below 100 iterations too and sometimes those can give us the wrong results.
- Goal created –
Surface goal=
- Outlet average pressure (Pa)
- Inlet average pressure (Pa)
- Mass flow rate at the outlet.
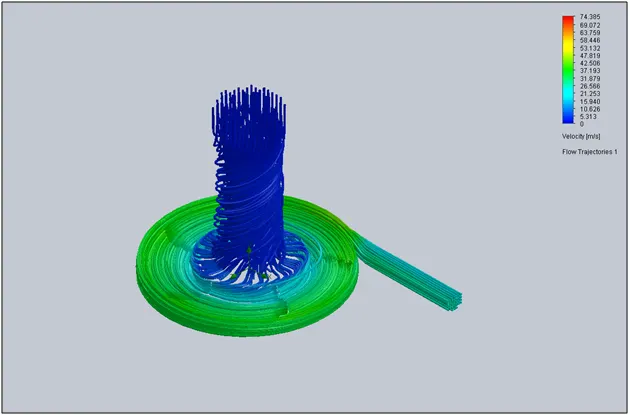
- Insert flow trajectories to see water flow movement.
Results :
Case 1.
Outlet velocity 10 m/s
Velocity plot –
Pressure plot –
Flow trajectory –
Case 2 –
Outlet velocity 15 m/s
Velocity plot-
Pressure plot –
Flow trajectory –
Case 3.
Outlet velocity 20 m/s
Velocity plot –
Pressure plot –
Flow trajectory –
Case 4.
Outlet velocity 25 m/s
Velocity plot-
Pressure plot –
Flow trajectory –
Graphs :
Pressure ratio =
Mass flow rate(kg/s) –
Inlet average total pressure –
Outlet average total pressure –
Plot of Pressure ratio vs Mass flow rate –
Conclusion :
- Pressure decreases as the velocity at outlet increases.
- Parametric study helped in understanding the flow behavior for various outlet condition.
- With increase in outlet velocity the mass flow rate showed a linear variation in the negative direction.