Centrifugal pump design and analysis
Aim: Design and analysis on a centrifugal pump using SOLIDWORKS.
Objective:
- To create a 3D model of a centrifugal pump in SolidWorks.
- To perform a flow simulation project on centrifugal pump
- To perform a parametric study to understand the performance characteristics of the designed pump.
- To plot a graph of pressure ratio and mass flow rate.
Theory:
Centrifugal pump is a hydraulic machine which converts mechanical energy into hydraulic energy by the use of centrifugal force acting on the fluid. These are the most popular and commonly used type of pumps for the transfer of fluids from low level to high level. It is used in places like agriculture, municipal (water and wastewater plants), industrial, power generation plants, petroleum, mining, chemical, pharmaceutical and many others.
When a certain mass of liquid is made to rotate by an external source, it is thrown away from the centrifugal axis of rotation and a head is impressed which enables it to rise to a higher level. Centrifugal Pumps can be used for viscous and non-viscous liquids and has higher efficiency.
Main Parts of Centrifugal Pump
The Main parts of Centrifugal Pump are:
- Impeller
It is a wheel or rotor which is provided with a series of backward curved blades or vanes. It is mounded on the shaft which is coupled to an external source of energy which imparts the liquid energy to the impeller there by making it to rotate.
Impellers are divided into 3 types, which are shown above
- Open Impeller
- Semi enclosed Impeller
- Enclosed Impeller
- Casing
It is a pipe which is connected at the upper end to the inlet of the pump to the centre of impeller which is commonly known as eye. The double end reaction pump consists of two suction pipes connected to the eye from both sides. The lower end dips into liquid in to lift. The lower end is fitted in to foot valve and strainer.
Commonly three types of casing are used in centrifugal pump,
- Volute Casing
- Vortex Casing
- Casing with Guide Blades
- Delivery Pipe
It is a pipe which is connected at its lower end to the out let of the pump and it delivers the liquid to the required height. Near the outlet of the pump on the delivery pipe, a valve is provided which controls the flow from the pump into delivery pipe.
- Suction Pipe with Foot Valve and Strainer
suction pipe is connected with the inlet of the impeller and the other end is dipped into the sump of water. At the water end, it consists of foot value and strainer. The foot valve is a one-way valve that opens in the upward direction. The strainer is used to filter the unwanted particle present in the water to prevent the centrifugal pump from blockage.
Working of Centrifugal Pump
The first step in the operation of a centrifugal pump is priming. Priming is the operation in which suction pipe casing of the pump and the position of fluid with the liquid which is to be pumped so that all the air from the position of pump is driven out and no air is left. The necessity of priming of a centrifugal pump is due to the fact that the pressure generated at the centrifugal pump impeller is directly proportional to density of fluid that is in contact with it.
After the pump is primed the delivery valve is still kept closed and electric motor is started to rotate the impeller. The delivery valve is kept closed in order to reduce valve is opened the liquid is made to flow in an outward radial direction there by vanes of impeller at the outer circumference with high velocity at outer circumference due to centrifugal action vacuum is created.
This cause liquid from sump to rush through suction pipe to eye of impeller thereby replacing long discharge from centre circumference of the impeller is utilized in lifting liquid to required height through delivery pipe. ref[ 1]
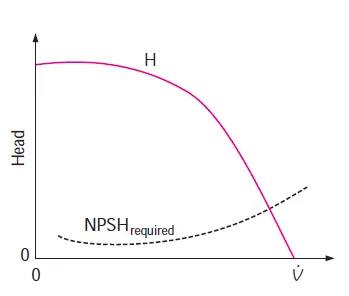
Pump manufacturers test their pumps for cavitation in a pump test facility by varying the volume flow rate and inlet pressure in a controlled manner. Specifically, at a given flow rate and liquid temperature, the pressure at the pump inlet is slowly lowered until cavitation occurs somewhere inside the pump. The value of NPSH is calculated using curve shown below and is recorded at this operating condition. this cuve is known as performance curve.
Modelling of centrifugal pump in SolidWorks
3 D geometry of centrifugal pump was made as shown below
Flow simulation of Centrifugal pump
- SolidWorks flow simulation add-in was activated, but before that lids were created in order to make the component water tight.
- After creating Lids, the geometry was checked for leaks, using check geometry tool on Flow Simulation toolbar.
- Then by clicking Wizard tool, the necessary parameters were set that included Internal Flow with rotation having Local region(s) (Averaging)
- Default fluid was set to water while the rest settings were kept unchanged.
- By clicking Finish button computational domain was set over the model.
- As the geometry contained a rotating region which was made externally in the model, for analysis that component was excluded from the study. This was done by right clicking the input data from the feature manager and that component was unchecked. (this method has been shown with the image below).
- The component, which was excluded from flow simulation was now set in the rotating region by specifying an input of 1200 rad/sec.
- Then the boundary conditions were set to environmental pressure at inlet and outlet velocity of 18m/s at the outlet for the baseline simulation.
- The surface goals were also added at the outlet lids which were total pressure and mass flow rate.
- The mesh settings were set to 4 with active advanced channel refinement.
- Finally, the setup was allowed to run and after it was complete, the plots of pressure, velocity, flow trajectories and the surface goals were inspected.
- Some of the snaps of the steps explained so far have been shown below.
Results
Pressure Plot
From the plots of pressure, following conclusions were extracted:
- The pressure is maximum at the outlet.
- At the inlet of the pipe, there was minimum pressure which was as expected which leads to suck the fluid inside of it.
- Although having higher pressure at the outlet there was recirculation of the flow trajectories at that region. One other reason for having recirculation was because of faulty designs at the outlet.
Velocity Plot
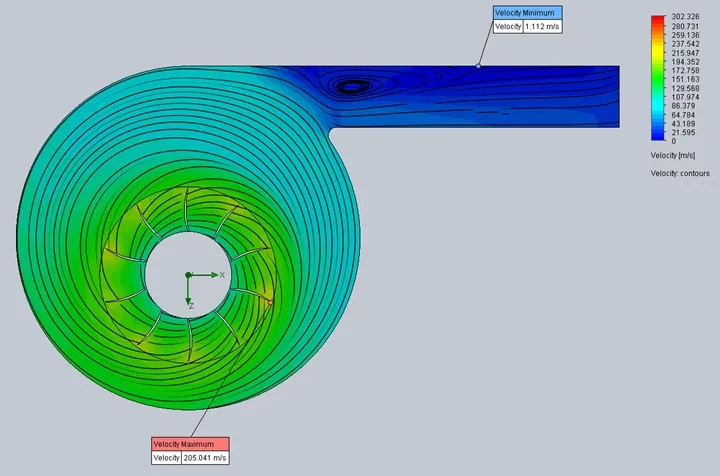
From the plots of velocity, following conclusions were extracted:
- The velocity is maximum at the edges of the blade whose value is about 205 m/sec which is very high.
- At the outlet of the pipe, there was minimum velocity which was as expected due to higher pressure at the outlet.
- This led to recirculation of the flow trajectories at that region. One other reason for having recirculation was because of faulty designs at the outlet.
Flow trajectories
Parametric Study
In order to get to know the performance curve for the above made model, the outlet velocity was varied from 10 m/sec to 46 m/sec and the set surface goals were plotted.
10 different scenarios were developed which are listed as below:
|
Goal (Value) |
Design Point 1 |
Design Point 2 |
Design Point 3 |
Design Point 4 |
Design Point 5 |
Design Point 6 |
Design Point 7 |
Design Point 8 |
Design Point 9 |
Design Point 10 |
|
Velocity normal to face (Outlet Velocity 2) [m/s] |
10 |
14 |
18 |
22 |
26 |
30 |
34 |
38 |
42 |
46 |
|
SG Average Total Pressure 1 [Pa] |
25113700.17 |
25730437.26 |
31764211.78 |
31751421.33 |
29937140.63 |
26019217.27 |
26197677.8 |
25719988.59 |
24220709.83 |
22857715.56 |
- Initially, there was an increase in pressure. This may be because of very low velocities at the outlet as compared to hat generated at the eye of the pump.
- There is an increase in pressure upto 320 bar beyond which the pressure reduces. And follows the performance curve.
- Also, there was a slight increase in the middle which I believe was because of some improper design of the pump.
The figures below show the variation of pressure and velocity for all these ten scenarios. One important thing to note down here is that as the velocity at the outlet was increased, the recirculation which was formed was reduced and was completely removed at the last scenario.
The flow trajectories for the last scenario are as follows:
Plot of Pressure ratio v/s Mass flow rate
As the total pressure at the inlet was equal to the atmospheric, the plot of pressure ratio w.r.to mass flow rate resembled close to that of pressure v/s outlet velocity. This is due to the uniform cross section of the pipe at the outlet and inlet
Conclusion:
- Centrifugal pump was made and simulated in solid works
- Parametric study helped in understanding the flow behaviour for various outlet condition, it also helped in eliminating the recirculation which was being developed due to pressure gradient.
- Parametric study also resulted in a close behaviour of pressure heat with the outlet velocity.
- Pressure ratio and mass flow rate plot also resembled close to the performance curve.
References