Centrifugal pump design and analysis
CENTRIFUGAL PUMP DESIGN AND ANALYSIS
AIM:
- To design and analyze the centrifugal pump at different outlet velocities.
- To obtain the relationship between the pressure ratio and mass flow rate and explain your results.
- To obtain the following plots:
- Pressure ratio [Pa]
- SG Mass flow rate [Kg/s]
- Pressure ratio [Pa] vs mass flow rate [Kg/s]
FORMULA:
Pressure ratio = Outlet total pressure/ Inlet total pressure
THEORY:
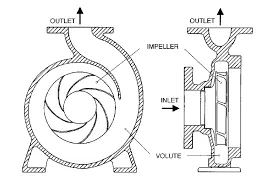
Centrifugal pumps are used to induce flow or raise a liquid from a low level to a high level. These pumps work on a very simple mechanism. A centrifugal pump converts rotational energy, often from a motor, to energy in a moving fluid.
The two main parts that are responsible for the conversion of energy are the impeller and the casing. The impeller is the rotating part of the pump and the casing is the airtight passage that surrounds the impeller. In a centrifugal pump, fluid enters into the casing, falls on the impeller blades at the eye of the impeller, and is whirled tangentially and radially outward until it leaves the impeller into the diffuser part of the casing. While passing through the impeller, the fluid is gaining both velocity and pressure.
SPECIFICATION:
The diameter of the volute casing - 90mm
The thickness of the volute casing - 15mm
Rotary blade diameter - 40 to 80mm
Number of blades - 5
The diameter of the inlet suction cylinder - 30mm
The Length of the inlet suction cylinder - 70mm
The diameter of the delivery pipe - 12mm
The length of the delivery pipe - 88mm
The shell thickness - 1mm
Rotational domain diameter - 85mm
Domain thickness - 12mm
CHARACTERISTICS:
Working Fluid - Water
Surface Roughness is zero.
Gravity - Not considered
Simulation - Internal
A domain is created for the rotational motion over the rotor.
BOUNDARY CONDITIONS:
Environmental pressure at the inlet - 101325 [Pa]
Outlet velocity at different conditions - 10, 20, and 30 m/s.
The rotational speed of the domain - 1000 rad/sec.
Mesh iteration [Automatic mesh at 4] - 500
3D MODEL DESIGN OF CENTRIFUGAL PUMP
To create the 3D model of the centrifugal pump with the above-mentioned dimension.
Change in transparency makes the rotor and domain visible inside the volute casing.
PARAMETRIC STUDY TO ANALYZE THE CENTRIFUGAL PUMP AT DIFFERENT OUTLET VELOCITIES
A parametric study is taken for different outlet velocities to measure and analyze the pressure ratio and mass flow rate between the inlet and outlet of the centrifugal pump.
| Goal (Value) | Design Point 1 | Design Point 2 | Design Point 3 |
| Velocity normal to face (Outlet Velocity 1) [m/s] | 10 | 20 | 30 |
| SG Av Total Pressure at outlet [Pa] | 4443388.037 | 2789206.014 | 2787455.084 |
| SG Av Total Pressure at inlet [Pa] | 417166.0633 | 280322.5071 | 310295.794 |
| SG Mass Flow Rate 1 [kg/s] | -0.49519379 | -0.99212555 | -1.482161014 |
| Pressure ratio [Pa] | 10.65136507 | 9.949989542 | 8.983219037 |
RESULTS AND PLOTS:
COMPARISON PLOT FOR PRESSURE RATIO [Pa] VS OUTLET VELOCITY [Kg/s]
| Velocity normal to face (Outlet Velocity 1) [m/s] | 10 | 20 | 30 |
| Pressure ratio [Pa] | 10.65136507 | 9.949989542 | 8.983219037 |
When the outlet velocity increases the pressure ratio decreases as shown in the resulting plot.
COMPARISON PLOT FOR MASS FLOW RATE [Kg/s] VS OUTLET VELOCITY [Kg/s]
| Velocity normal to face (Outlet Velocity 1) [m/s] | 10 | 20 | 30 |
| SG Mass Flow Rate 1 [kg/s] | -0.49519379 | -0.99212555 | -1.482161014 |
When the outlet velocity increases the mass flow rate increases as shown in the resulting plot.
PLOT THE RELATIONSHIP BETWEEN PRESSURE RATIO VS MASS FLOW RATE.
| Pressure ratio [Pa] | 10.65136507 | 9.949989542 | 8.983219037 |
| SG Mass Flow Rate 1 [kg/s] | 0.49519379 | 0.99212555 | 1.482161014 |
From the relationship between pressure ratio and mass flow rate, We conclude that as pressure ratio decreases the mass flow rate increases as shown in the resulting plot.
VELOCITY AND PRESSURE VARIATION PLOT FOR VARIOUS VALUES OF OUTLET VELOCITIES FROM PARAMETRIC STUDY
- At 10m/s
- At 20 m/s
- At 30 m/s
FLOW TRAJECTORIES VARIATIONS FOR VARIOUS VALUES OF OUTLET VELOCITIES.
- At 10 m/s
- At 20 m/s
- At 30 m/s
From the flow trajectory, we can observe that as the velocity increases the mass flow rate increases rapidly with a decrease in pressure ratio.