Centrifugal pump design and analysis
Centrifugal Pump Design and Analysis
Aim
To create 3D model of centrifugal pump and perform a baseline flow simulation. Also, create parametric study for different velocities and compare the results with showing performance diagram. Obtain graphs of mass flow rate, pressure ratio, and show the relationship between them.
Objective
- Create 3D model of centrifugal pump
- Initialize the simulation with providing lids
- Assign boundary conditions and goals to the design
- Run the simulation for 500 iterations with basic mesh with advance refinement
- Obtain the results and compare it
Geometry and Modelling
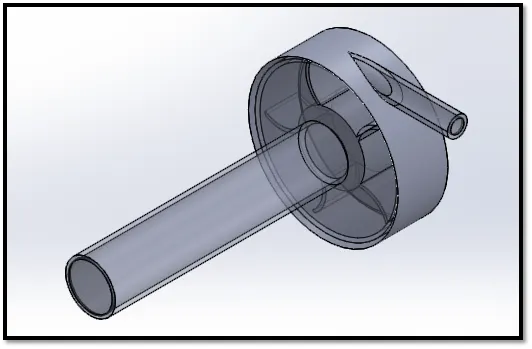
The impeller is designed with five blades and a casing is provided to it with an inlet and out flow pipe.
Parameters for Simulation
Type of Simulation = Static Simulation
Analysis type = Internal flow
Fluid used = Water
Type of Flow = Laminar and turbulent
Rotation type = Local Region Averaging
Inlet Boundary Conditions = Pressure of 1bar
Outlet boundary Conditions = Velocity of 10m/s
Procedure
- Design a 3D model of centrifugal pump with specific dimensions.
- Start the simulation with providing lids on both the openings for proper simulation.
- Select the above mentioned parameters for Simulation
- Insert boundary conditions for inlet as Environmental pressure of 1 bar and outlet as Exit Velocity of 10 m/s
- Surface goals are set at inlet and outlet faces
- Surface goals at outlet face is selected for mass flow rate
- Mesh is created for model at level 3 and advance channel refinement is selected
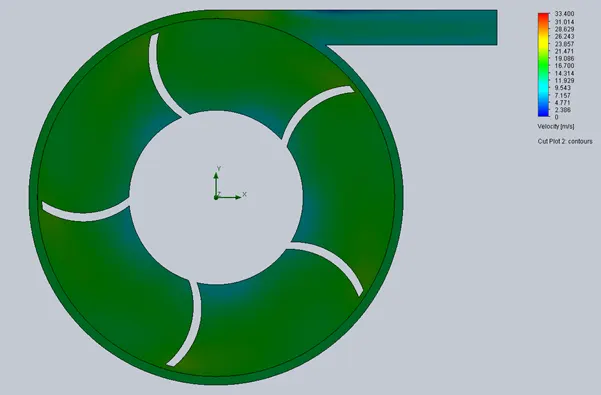
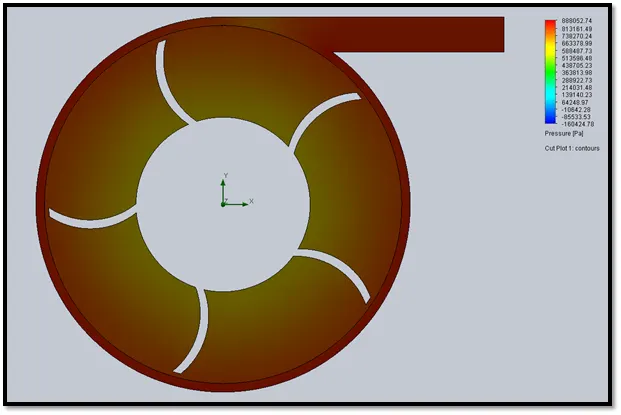
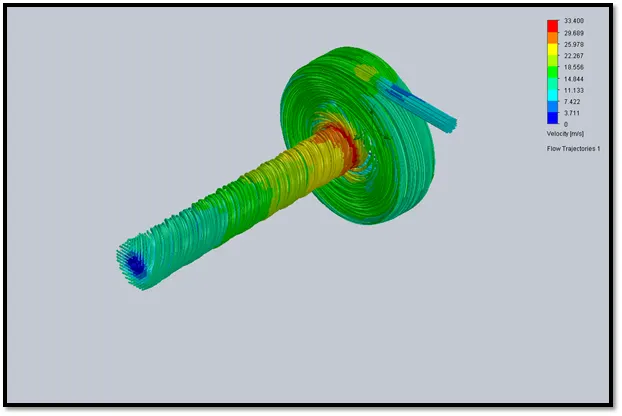
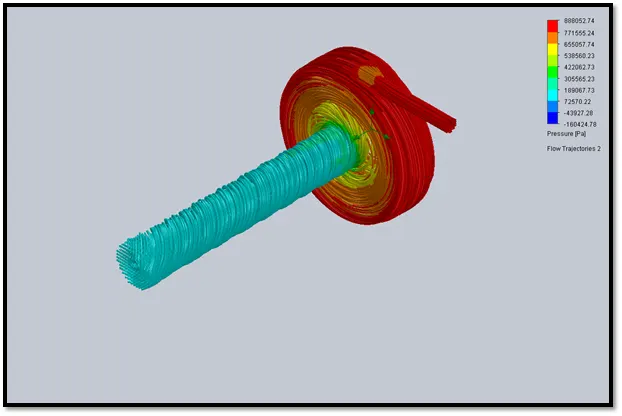
- Run the simulation for 500 iterations for cut plots of Velocity and pressure and flow trajectories
Parametric Study
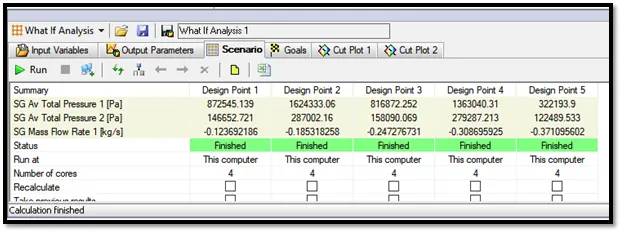
- Set the input variables as the outlet Velocity with discrete values of 10m/s, 15m/s, 20m/s, 25m/s, 30m/s
- The outlet variables are set to surface goals at inlet and outlet and mass glow rate
- Cut plots of Velocity and pressure can be created
Results
Cut plot of velocity at 10 m/s:
Cut plot of pressure at 1bar:
Flow trajectory of Velocity
Flow trajectory of pressure
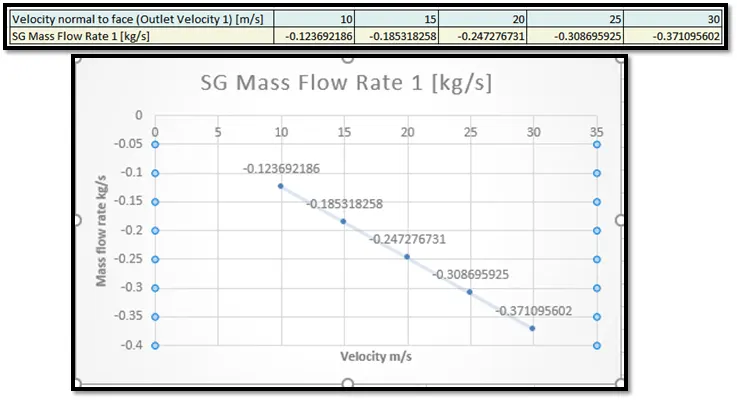
Mass flow rate graph
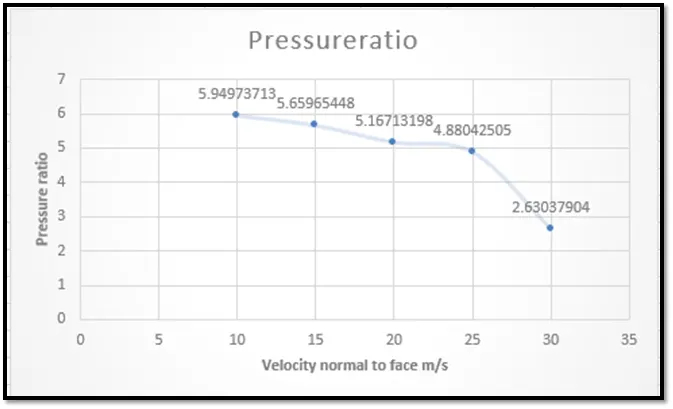
Pressure ratio graph

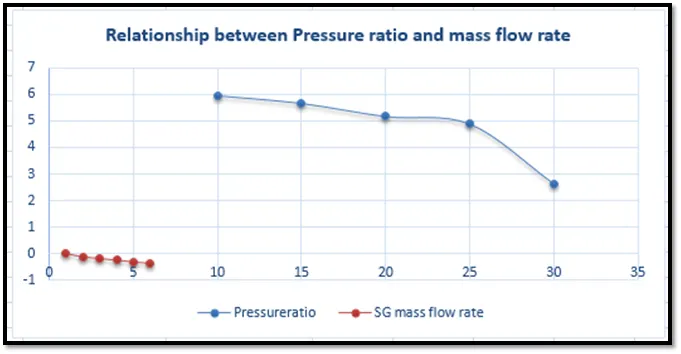
Relationship between Pressure ratio and mass flow rate
Conclusion
- From the mass flow rate graph we conclude that as the velocity increases the mass flow rate decreases.
- The pressure ratio is calculated by Outlet pressure/ Inlet pressure.
- The pressure ratio vs Velocity graph concludes that as the velocity increases the pressure ratio decreases.
- The relationship between mass flow rate and pressure ratio says that it is inversely proportional as the mass flow rate increases pressure ratio decreases and vice versa