Calculation of Drag Force for flow against a bicycle
AIM
To calculate drag force against a cyclist.
GOVERNING EQUATIONS
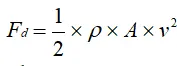
where
Fd=Drag Force,
ρ =Density of the fluid which the body is resisting,
A =Frontal area,
v =Velocity
OBJECTIVES
ØTo plot Velocity vs Drag force (taking Drag coefficient as constant)
ØTo plot Drag co-efficient vs Drag force (taking velocity as constant)
INPUT DATA ASSUMED
Density of air(fluid against which body is resisting) is taken to be 1.225 kg/m3.
Frontal area of the cyclist is assumed to be 0.3 m2.
Velocity is assumed to vary from 1 m/s to 50 m/s.
The Velocity vs Drag Force plot is plotted taking Drag coefficient as 0.5.
The Drag co-efficient vs Drag force plot is plotted taking velocity = 1 m/s.
CODE
Programming Language used- MATLAB
%Calculation of Drag Force against a cyclist
clear all
close all
clc

%Drag coefficient(unitless)
c_d=0.5;
%Drag coefficient for different shapes for same frontal area
%sphere=0.5 flat plate=1.28 prism=1.14 airfoil=0.045 bullet=0.295
c_d_diff=[0.5 1.28 1.14 0.045 0.295];
%Density(kg/m^3)
rho=1.225;
%Frontal area(m^2)
A=0.3;
%Velocity(m/s)
v=[1:50];

%Drag force for a particular drag coefficient for different velocities
F_d=0.5*c_d*rho*A*v.^2 ;
%Plot between Velocity and Drag Force
subplot(1,2,1)
plot(v,F_d)
title('Velocity vs Drag Force');
xlabel('Velocity');
ylabel('Drag Force');
grid 'on';

%Taking a single velocity for different drag coefficients
v1=1;
%Drag force for a particular velocity for different drag coefficient
F_d1=0.5.*c_d_diff*rho*A*v1^2 ;

%Plotting graph between Drag coefficient and Drag Force
subplot(1,2,2)
plot(c_d_diff,F_d1)
title('Drag coefficient vs Drag Force');
xlabel('Drag coefficient');
ylabel('Drag Force');
grid 'on';
OUTPUT
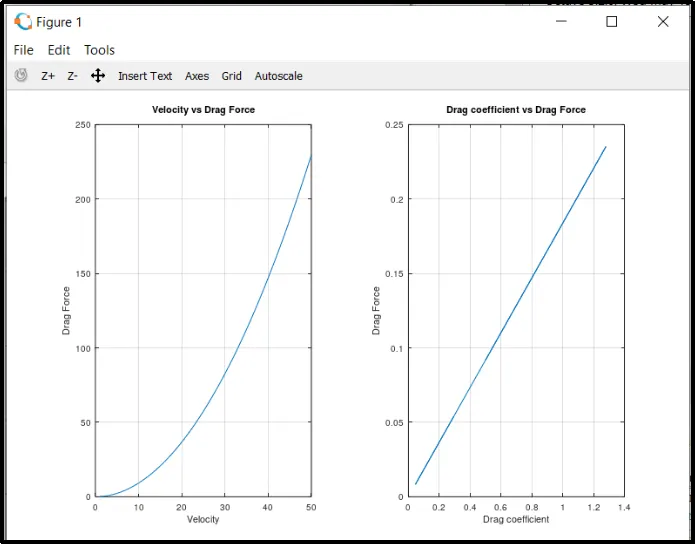
EXPLANATION
Code-
The drag force is calculated by taking the input values of Drag coefficient, density of fluid which body is resisting(in this case,air), Frontal area and velocity.
The drag force is calculated by the governing equation for different values of velocity varying from 1 to 50 m/s taking drag coefficient as 0.5.
Then these values are plotted using the ‘plot’ command taking Velocity along x-axis and Drag Force along y-axis.
Similarly, Drag Force is calculated taking a constant value of velocity as 1 m/s and varying the values of Drag coefficient for different shapes. Then the Drag Force vs Drag coefficient is plotted.
Output-
It was found out from the plots that ‘Drag Force vs Velocity’ is a parabolic curve while ‘Drag Force vs Drag coefficient’ is a linear one.
ERRORS ENCOUNTERED

Direct exponent (v^2) used instead of element-wise(v.^2).
CONCLUSION
From the program we can find the variation of Drag Force with Drag coefficient as well as Velocity.