Basics of Probability and Statistics Week 1 Challenge
1. The variance is calculated to express how the data points deviate from the mean.
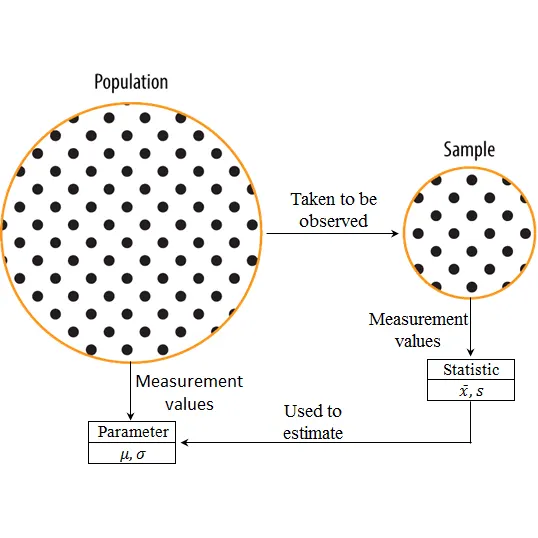
The sample is a subset of the population. For example, if we are analyzing students' results in a school. The population variance is associated with the mark of the entire students in the school, whereas the sample variance is associated with the mark of the students of a particular class in that school. The latter may give an overview of the entire school's results.
The population variance is given by the equation
`sigma^2=frac{sum(x_i -mu_x)^2}{N}`
sample variance is given by the equation
`S^2=frac{sum(x_i -mu_x)^2}{N-1}`
The difference lies only within the denominator. This is known as Bessel's correction. It is done to compensate for the information which is lacking in case of sample variance. It is clear from the equation that sample variance has a value larger than population variance as the denominator is N-1 and N for sample and population variance respectively. Sample Variance will get more and more closer to the population variance as we increase the sample size.
2.
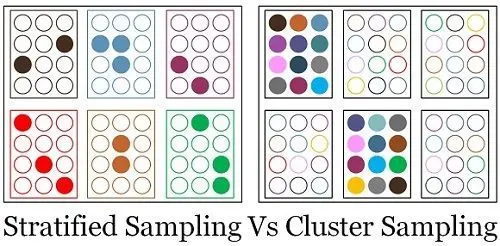
From the above figure, it is evident that in stratified sampling all the elements in strata are the same (homogenous). In cluster sampling, elements in each cluster will be a true representation of the population. In stratified sampling, we are randomly choosing n number of samples from each group. In cluster sampling, choosing n number of random clusters and a survey is conducted on all the elements.
| Stratified sampling | Cluster Sampling |
| In stratified sampling, each strata is the sub-group of the population that is divided based on some common characteristics. | In cluster sampling, each cluster will be the true representative of the whole population. |
| Here, the groups are homogenous i.e., in each strata, all the elements are alike. | Here, elements in each cluster are different or it can be said that they are not homogenous. |
| Simple random sampling is used to draw samples from each strata. | Simple random sampling is used to draw a complete cluster as the sample. |
| The sample should be drawn from all the strata. | Each cluster acts as a sampling unit.Only a few clusters are selected as samples and each element of the cluster is included in the study. |
3. Let's say the population size is 3 (A,B,C). Since the sample size is not specified, it can vary from 1 to 3. So the samples are {A},{B},{C},{A,B},{B,A},{B,C},{C,B},{A,C},{C,A},{A,B,C},{A,C,B}{B,C,A},{B,A,C}{C,A,B},{C,B,A}.
So the total number = 3+ 3 permutation 2 + 3 factorial
Therfore a population of size n
`n+ ^n P _(n-1) + ^n P _(n-2)...+^n P _(n-(n-2)) + n!`
4. The total number of outcomes = 6*6 = 36.
Out of which both having same number on the two dice =6. {1,1},{2,2},{3,3},{4,4},{5,5},{6,6}.
Therefore the probability that both the numbers on dice are the same while rolling 2 dice = 6/36 =1/6.
5. Standard deviation is the square root of the variance. Variance is a measure that tells the dispersion of the data points. They are getting squared, because some points may deviate negatively on the other hand some points deviate positively. As a result, the overall deviation gets nullified if we just summed it. Finding the square and then adding the result will tell the dispersion.
As a result, the units of the points (if we are taking the speed, then m/s) also get squared (m^2/s^2). In order to express the dispersion in the same unit of that as the data, it is mandatory to find the root.