Basics of Probability and Statistics Week 1 Challenge
1. Why there is a difference in the formula of variance for population and sample?
(σ2)=∑(X−μ)2/N , Variance of a population
(s2)=∑(X−μ)2/(N-1), Variance of a sample
μ is the mean value of corresponding sample or population.
N is the number of elements in the data set.
The purpose of using n-1 in denominator of the sample variance formula is so that our estimate is "unbiased" in the long run. What this means is that if we take a second sample, we'll get a different value of s². If we take a third sample, we'll get a third value of s², and so on. We use n-1 so that the average of all these values of s² is equal to σ².
In others words using "n-1" instead of "n" gives a more accurate representation of the population variance.
If we use n, then in long run, we'd be generally (but not always) underestimating σ². If we used n-2 or n-3, etc, then we'd be generally overestimating σ². Using n-1 is the sweet spot.
The above statement can also be Mathematically proved using Expectation theorems and a few relations.
(Please refer the attached proof in PDF format or link below for the same)
https://drive.google.com/file/d/1QijFukmjozF_NlvIFbrw6CXhXus46sMz/view?usp=sharing
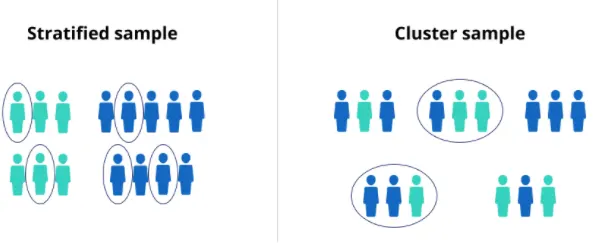
2. Difference between stratified and clustered sampling
|
Stratified Sampling |
Clustered Sampling |
|
Stratified sampling is one, in which the population is divided into homogeneous segments, and then the sample is randomly taken from each group. |
Cluster sampling refers to a sampling method wherein the members of the population are selected at random, from naturally occurring groups called 'cluster'. |
| Randomly selected individuals are taken from all the strata. | All the individuals are taken from randomly selected clusters. |
| Selection of population elements are done "individually". | Selection of population elements are done "collectively". |
| The main objective is to increase precision and representation. | The main objective is to reduce cost and improve efficiency. |
| Sample consists of atleast one element from each group or strata. | Sample might not contain elements from all the groups. |
| In stratified sampling the population elements are selected individually from each stratum. | In cluster sampling, population elements are selected in aggregates or groups. |
| In stratified sampling, there is homogeneity* within the group. | In clustered sampling the homogeneity* is found between groups. |
| Heterogeneity** occurs between groups. | Members of the group are heterogeneous**. |
*Homogeneity here refers to the similarity in the traits/characteristics of elements.
**Heterogeneity refers to the variation in the traits/characteristics of elements.
3. How many different samples can be drawn from population of size n?
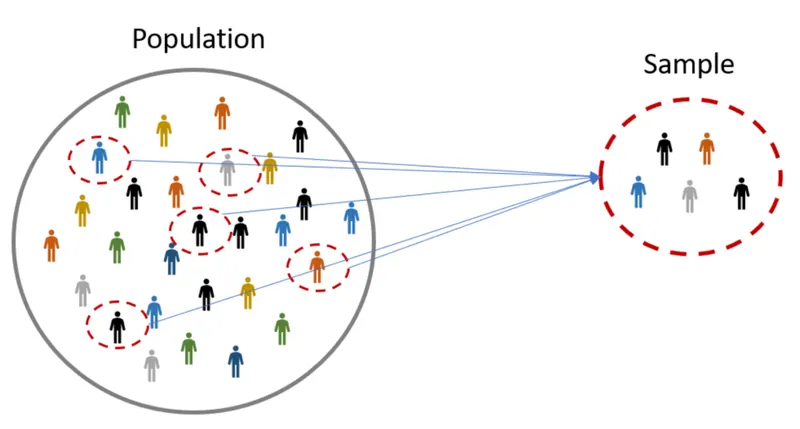
A sample is a subset of a population which contains some elements of the population. The main aim of the sample is to reduce the time taken for statistical calculation, and also to infer or understand about the population. There are many types of sampling methods based on the type of study undertaken and with or without the use of mathematical concepts like probability.
| Probability Sampling methods | Non-Probability sampling methods |
|
|
There are two ways to draw a sample, with or without replacement. With replacement means that once a person is selection to be in a sample, that person is placed back in the population to possibly be sampled again. Without replacement means that once an individual is sampled, that person is not placed back in the population for re-sampling.
With Replacement:
When drawing a sample from a population ‘with replacement’, there are many different combinations of people that could be selected.
number of possible samples drawn with replacement = `N^n`
where N is the number in the total population and n is the number of units being sampled.
Without Replacement:
In the realistic sampling, elements are not included in the sample more than once. Also, the order in which the elements are selected for a survey is not important. All that matters is if the element is in or out of the sample. Hence in most surveys, samples are selected disregarding order and without replacement. Sampling without replacement also provides an unbiased estimator of the population mean and variance.
`(N!)/(n! (N-n)!`
where N is the number of people in the population, n is the number of sampled persons, and ‘!’ is the factorial notation for the sequential multiplication of a number times a number minus 1, continuing until reaching 1. That is, N! (termed "N factorial") is N times N-1 times N-2 and the like with the last number being 1.
4. What is the probability of drawing 2 jacks from a pack of card?
Pack of card = 52 cards
N.o of jacks = 4
P(A • B) = P(A) × P(B, if A)
P(2jacks from pack) = P(1st jack) * P(2nd jack from remaining cards)
= (4/52)*(3/51)
= 0.0045 = 0.45%
5. What is the probability that both numbers on dice are same while rolling 2 dice?
The sample size for rolling two dices together is,
(1, 1) (1, 2) (1, 3) (1, 4) (1, 5) (1, 6)
(2, 1) (2, 2) (2, 3) (2, 4) (2, 5) (2, 6)
(3, 1) (3, 2) (3, 3) (3, 4) (3, 5) (3, 6)
(4, 1) (4, 2) (4, 3) (4, 4) (4, 5) (4, 6)
(5, 1) (5, 2) (5, 3) (5, 4) (5, 5) (5, 6)
(6, 1) (6, 2) (6, 3) (6, 4) (6, 5) (6, 6)
sample size (n)/ Total possible outcomes = 36
The number of outcomes with same number on both the dices is as follows,
(1, 1) (1, 2) (1, 3) (1, 4) (1, 5) (1, 6)
(2, 1) (2, 2) (2, 3) (2, 4) (2, 5) (2, 6)
(3, 1) (3, 2) (3, 3) (3, 4) (3, 5) (3, 6)
(4, 1) (4, 2) (4, 3) (4, 4) (4, 5) (4, 6)
(5, 1) (5, 2) (5, 3) (5, 4) (5, 5) (5, 6)
(6, 1) (6, 2) (6, 3) (6, 4) (6, 5) (6, 6)
The favorable outcome of getting the same number on both dice is: (1,1),(2,2),(3,3),(4,4),(5,5),(6,6).
Number of favourable outcomes = 6
Required probability = Number of favorable outcomes/Total number of outcomes
= 6/36 = 1/6.
6. Why standard deviation when variance can measure dispersion of data?
In statistics, dispersion (also called variability, scatter, or spread) is the extent to which a distribution is stretched or squeezed or the extent to which a numerical data is likely to vary about an average value. In other words, dispersion helps to understand the distribution of the data.
Variance of a data set(σ):
Variance is the expected value of the squared variation of a random variable from its mean value, in probability and statistics. Informally, variance estimates how far a set of numbers (random) are spread out from their mean value.
Variance is symbolically represented by σ2, s2, or Var(X).
(σ2)=∑(X−μ)2/N , Variance of a population
(σ2)=∑(X−μ)2/(N-1), Variance of a sample
μ is the mean value of corresponding sample or population.
N is the number of elements in the data set.
The calculation of variance uses squares because it weighs outliers more heavily than data closer to the mean. This calculation also prevents differences above the mean from canceling out those below, which would result in a variance of zero.
Standard deviation is a statistic that looks at how far from the mean a group of numbers is, by using the square root of the variance.
S.D. = σ
The main reason to use S.D instead of variance is to get a more accurate representaion of the data, since we use the squared values of the data in variance, thus scaling up the dispersion significantly which might lead to wrong interpretations.
In order to bring back the dispersion to the same scale as that of the data, S.D is used. It more accurately depicts the dispersion.
REFERENCES:
3) http://www.ph.ucla.edu/epi/rapidsurveys/RScourse/RSbook_ch3.pdf
4) https://keydifferences.com/difference-between-stratified-and-cluster-sampling.html