Basics of ML & AL Week 2 Challenge
1)Calculate all 4 business moments using pen and paper for the below data set?
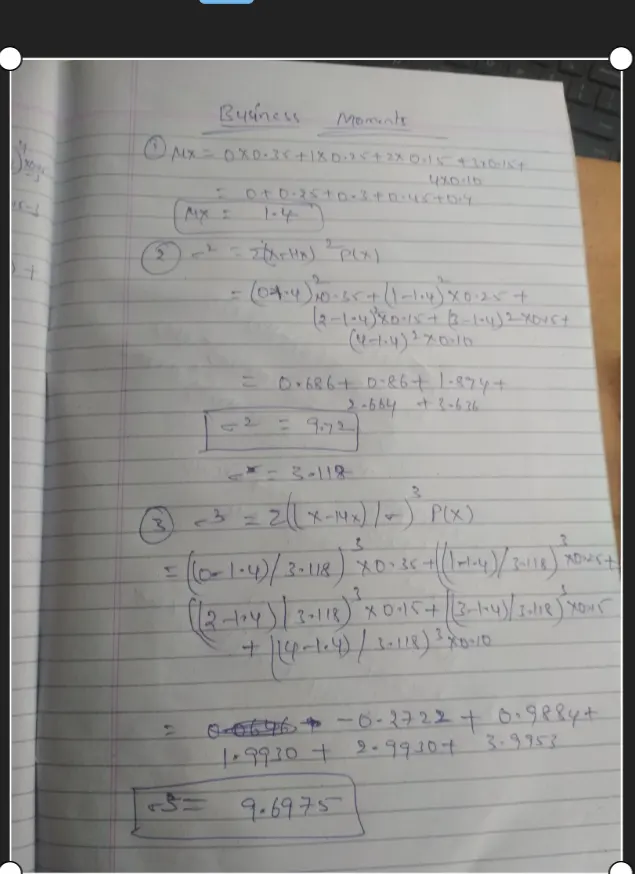
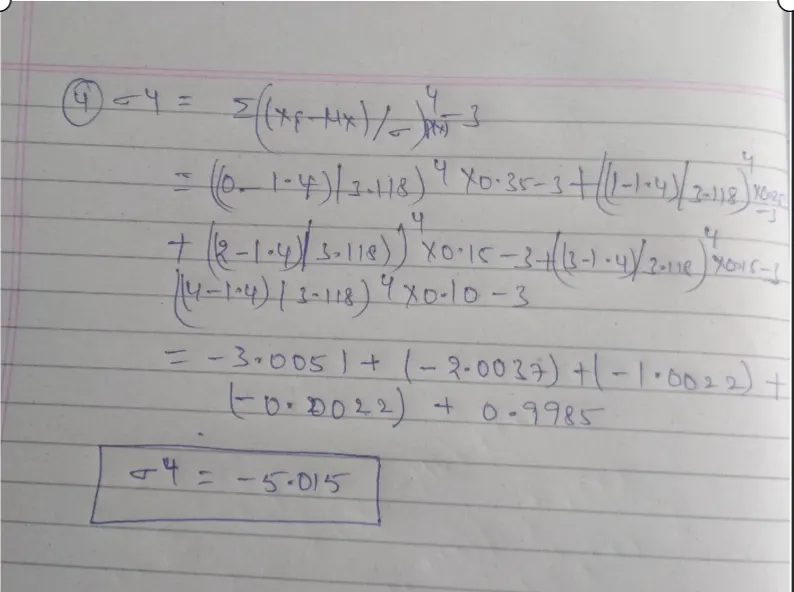
2)What is the significance of expected value when simple mean (Sum of all observations/number of observations) is already in place
Expected value is used when we want to calculate the mean of a probability distribution. This represents the average value we expect to occur before collecting any data. Mean is typically used when we want to calculate the average value of a given sample.
3)Having skewness in the curve considered to be bad in the analysis?
Skewness is the measure of the asymmetry of an ideally symmetric probability distribution and is given by the third standardized moment
In simple words, skewness is the measure of how much the probability distribution of a random variable deviates from the normal distribution.
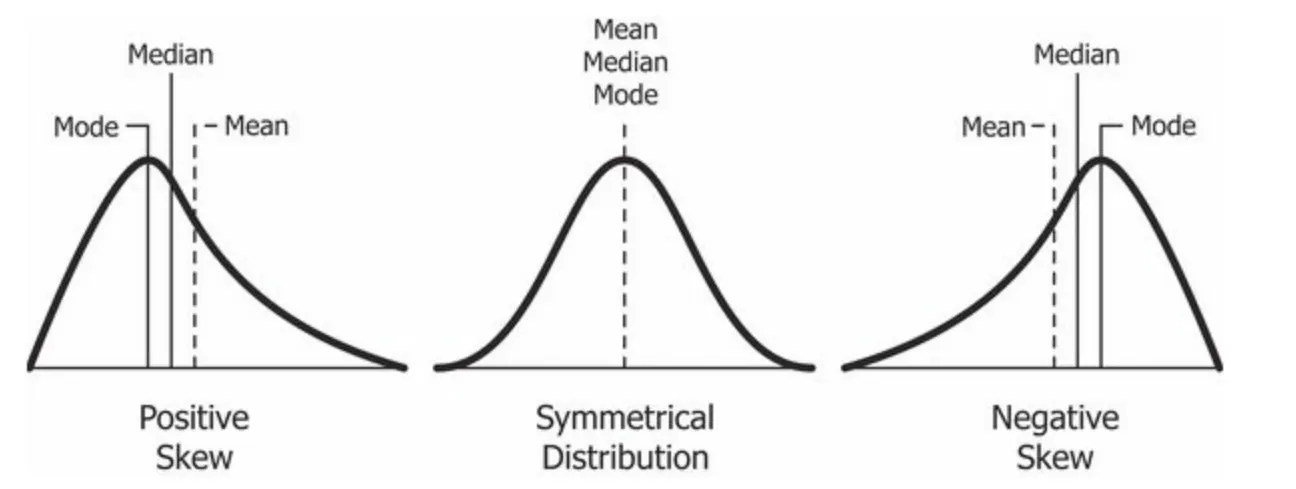
One cannot determine whether having skewness is good or bad. Because different types of skewness depicts the data according to the domain of its application.
The probability distribution with its tail on the right side is a positively skewed distribution and the one with its tail on the left side is a negatively skewed distribution.
4)Evaluate the probabilities for continuous normal distribution with given mean = 680 and standard deviation = 31
a)P(X<711)
b)P(X>740)
c)P(600<x<720)< p=""></x<720)<>
d)P(X=720)
a)P(X<711)
z-score of this would be=(711-680)/31=1
Hence it is one standard deviation away from the mean in a positive x-axis
In the z-table, the probability value for z=+1 is 0.8413 which is 84.13%
b)P(X>740)
z-score would be =(740-680)/31=1.93
Hence it is 1.9 times the standard deviation away from the mean in a positive x-axis
In z-table, the probability value for z=+1.93 is 0.9732 which is 97.32%
But asked for probability greater than 740 so subtract from 1
1-0.9732=0.0268 or 2.68%
c)P(600
In this case, we need to find the value of probability at x<720 and x<600 and subtract values
When x=720, z=1.29 and pobability value is 0.9015
When x=600, z=-2.58 and probability value is 0.00494
probability value =0.9015-0.00494=0.89656 or 89.656%
d)P(X=720)
P(Z=1.29)=P(1.29<Z<1.29)
Since our primary aim is to compute the area of the curve whether it is to left or right depends on its position and if it is greater or lesser
Hence being a single line the area enclosed by it is zero
P(Z=1.29)=P(Z<1.29)-P(Z<1.29)
P(Z=1.29)=0.9032-0.9032
P(Z=1.29)=0
5)Explain the curve on the right side
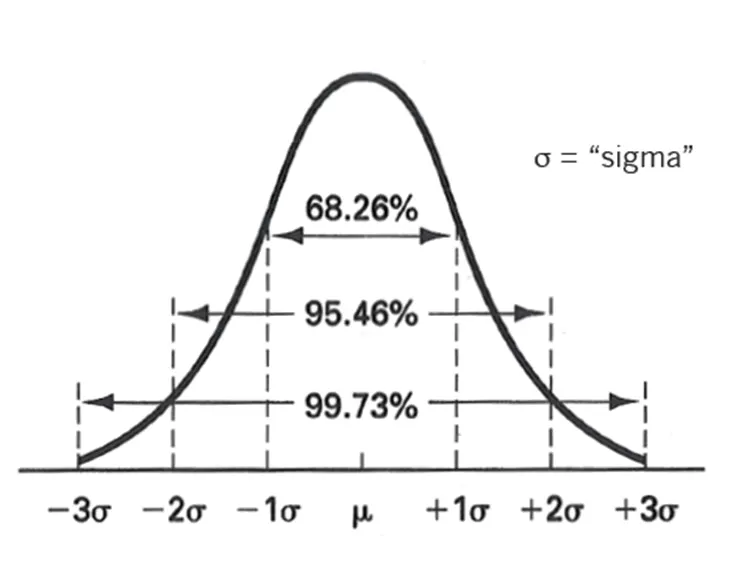
Here, the mean of this observation data is always 0 and the standard deviation is 1
It gives us the percentage of data falling under every 1,2, and 3 standard deviations from the mean value
In this figure 68.2% of the data falls from z value -1 to +1, 95.4% from -2 to +2 and 99.6% from -3 to +3
An example would be marks obtained in a test. It can be observed that people who scored centum and people who scored a zero would be very less. More student's marks would be around the average class mark