Basics of ML & AL Week 2 Challenge
1)Calculate all 4 business moments using pen and paper for the below data set?
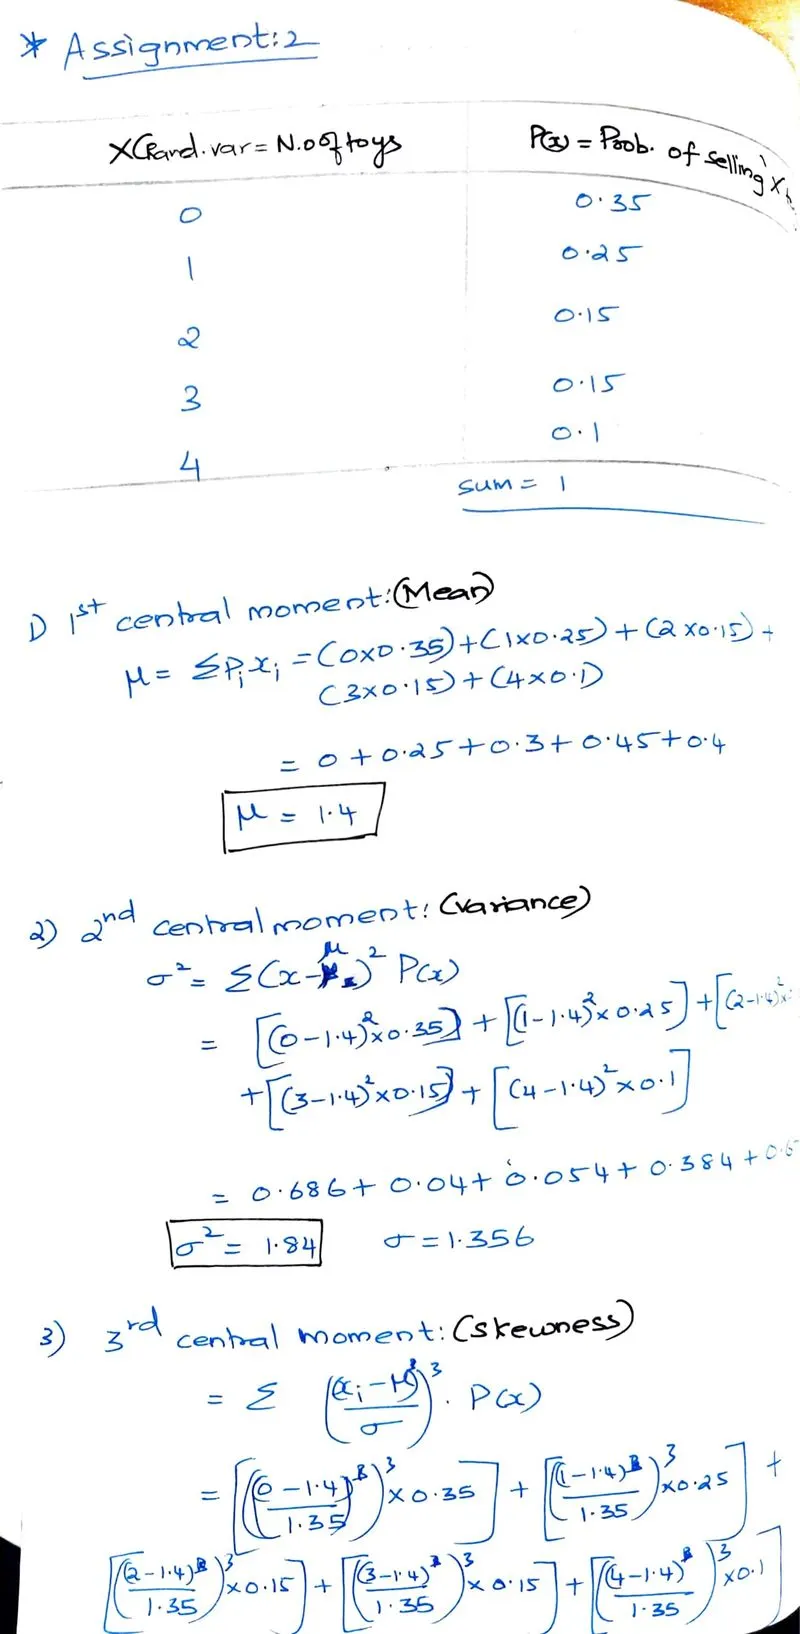
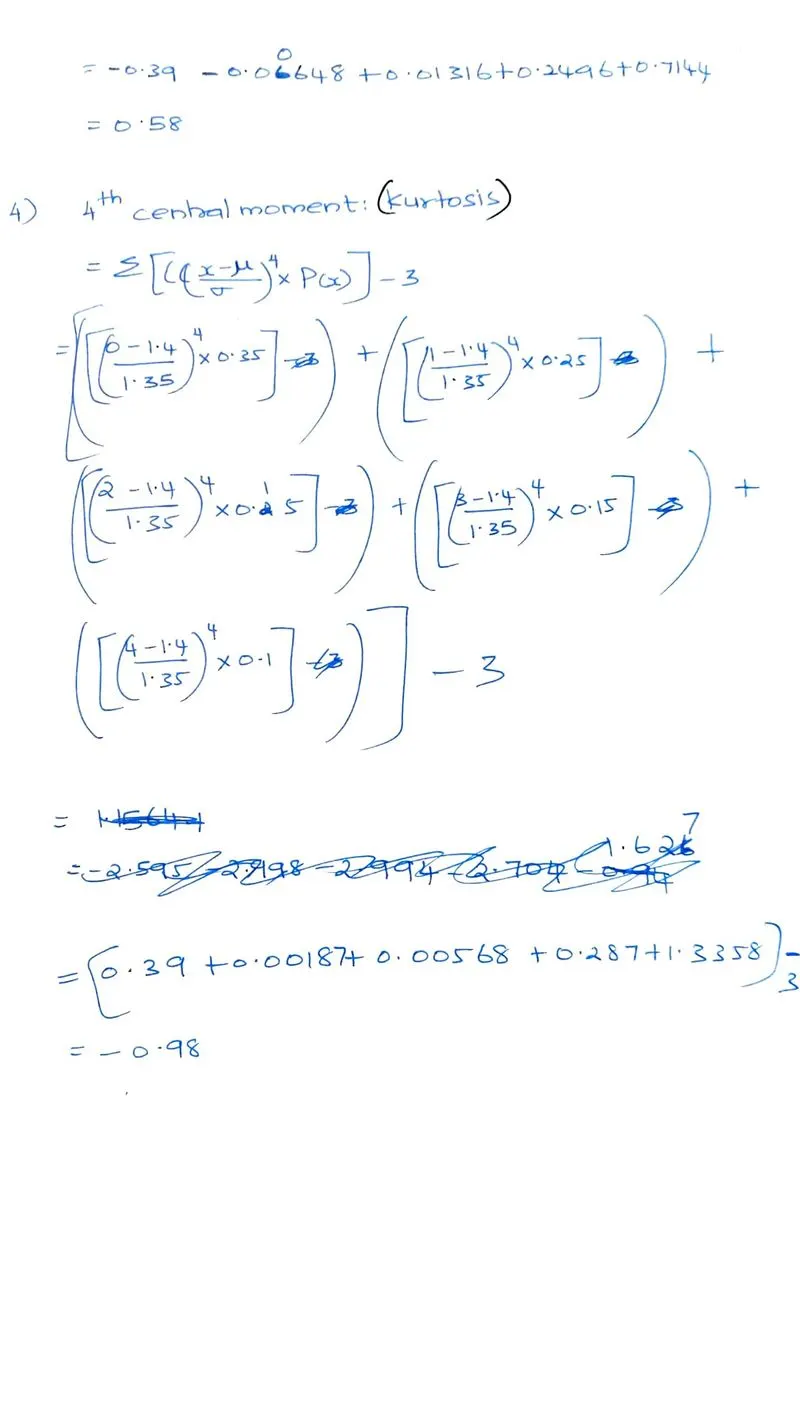
- What is the significance of expected value when simple mean (Sum of all observations/number of observations) is already in place?
Simple Mean
The "average" number found by adding all data points and dividing by the number of data points.
In other words. when the probability is ‘uniform’ for all the different events/random variable, then we use Simple mean.
Expected Value
But in cases where each event/ random variable has different probability of outcome, then it is optimal to take the weighted average of each event. This is called the expected value.
E(X) = ΣX * P(X)
The expected value can be thought of as a weighted average of those outcomes.
- Having skewness in the curve considered to be bad in the analysis?
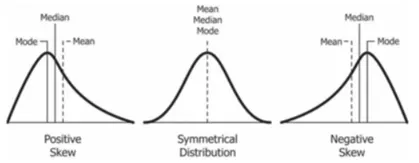
Skewness is the measure of how much the probability distribution of a random variable deviates from the normal distribution.
Alternatively, Skewness is the measure of the asymmetry of an ideally symmetric probability distribution and is given by the third standardized moment.
Having skewness is neither good nor bad. It is just a measure of distribution. In many cases skewness might be favourable based on the business problem to be solved. We cant immediately jump to conclude that skewness is bad or good.
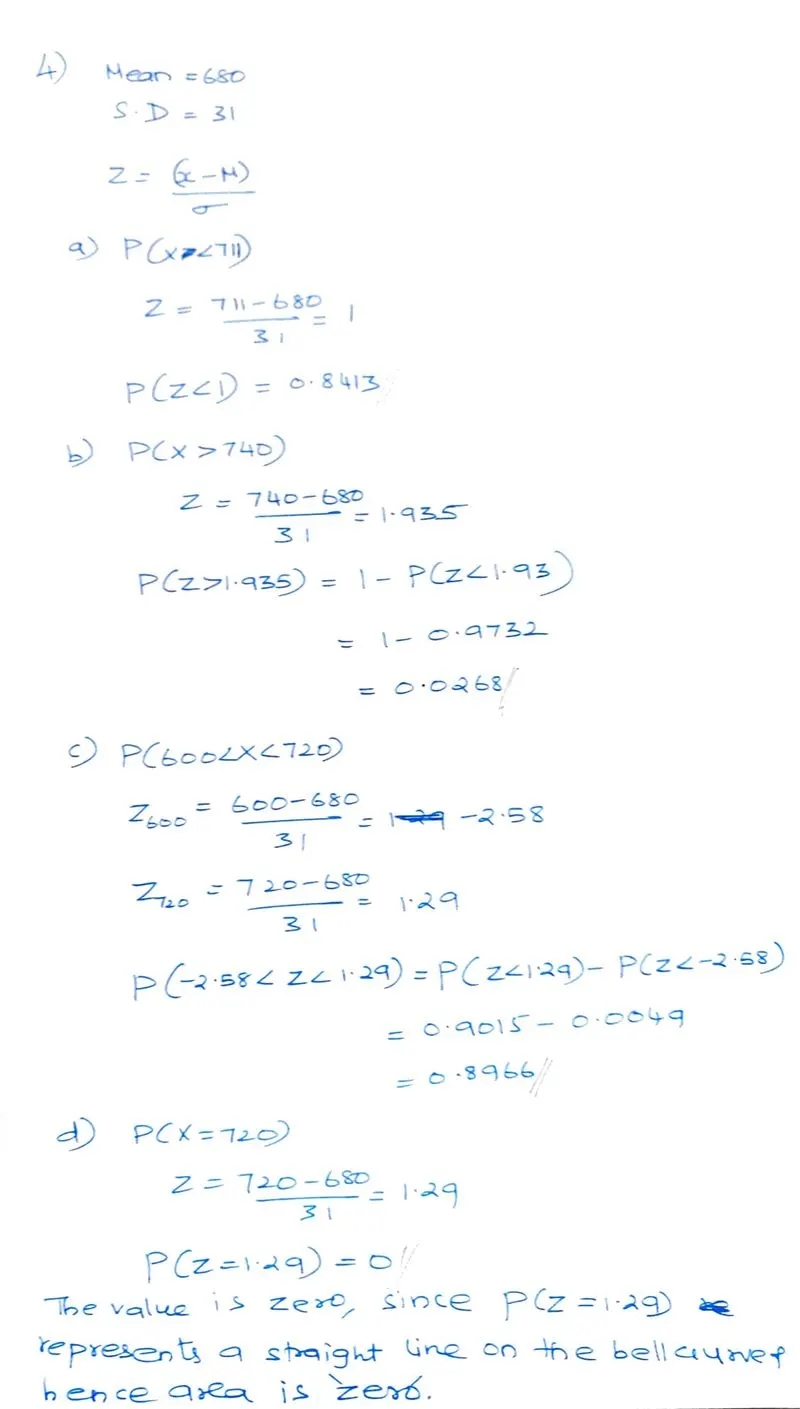
4)Evaluate the probabilities for continuous normal distribution with given mean = 680 and standard deviation = 31
- Explain the curve on the right side
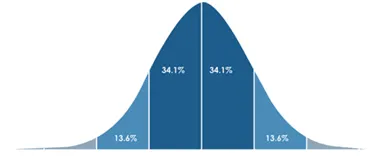
A normal distribution, sometimes called the bell curve, is a distribution that occurs naturally in many situations.
The curve creates a distribution that resembles a bell (hence the nickname). The bell curve is symmetrical. Half of the data will fall to the left of the mean; half will fall to the right.
Many groups follow this type of pattern. That’s why it’s widely used in business & statistics. Some common examples are,
- Heights of people.
- Measurement errors.
- Blood pressure.
- Points on a test.
- IQ scores.
- Salaries
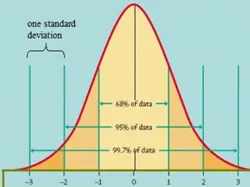
The curve tells you what percentage of your data falls within a certain number of standard deviations from the mean:
• 68% of the data falls within one standard deviations of the mean.
• 95% of the data falls within two standard deviations of the mean.
• 99.7% of the data falls within three standard deviations of the mean.