Challenge

Basics of ML & AL Week 2 Challenge

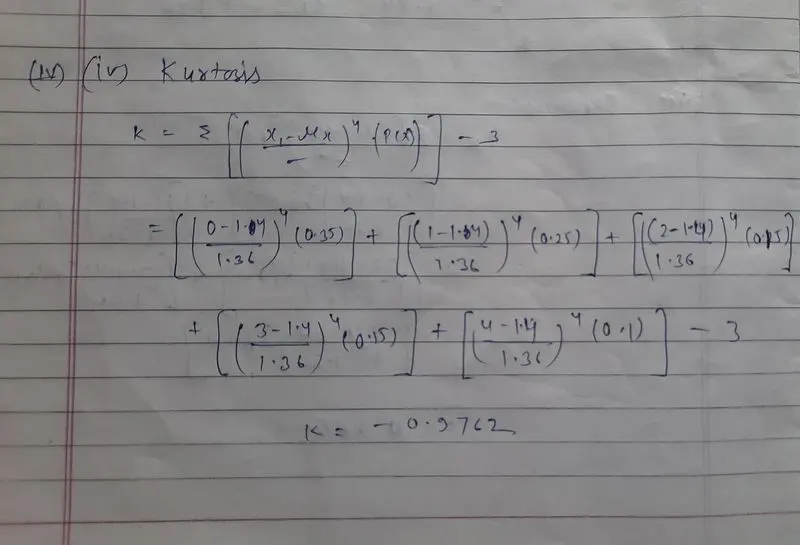
1)Calculate all 4 business moments using pen and paper for the below data set?

ans:
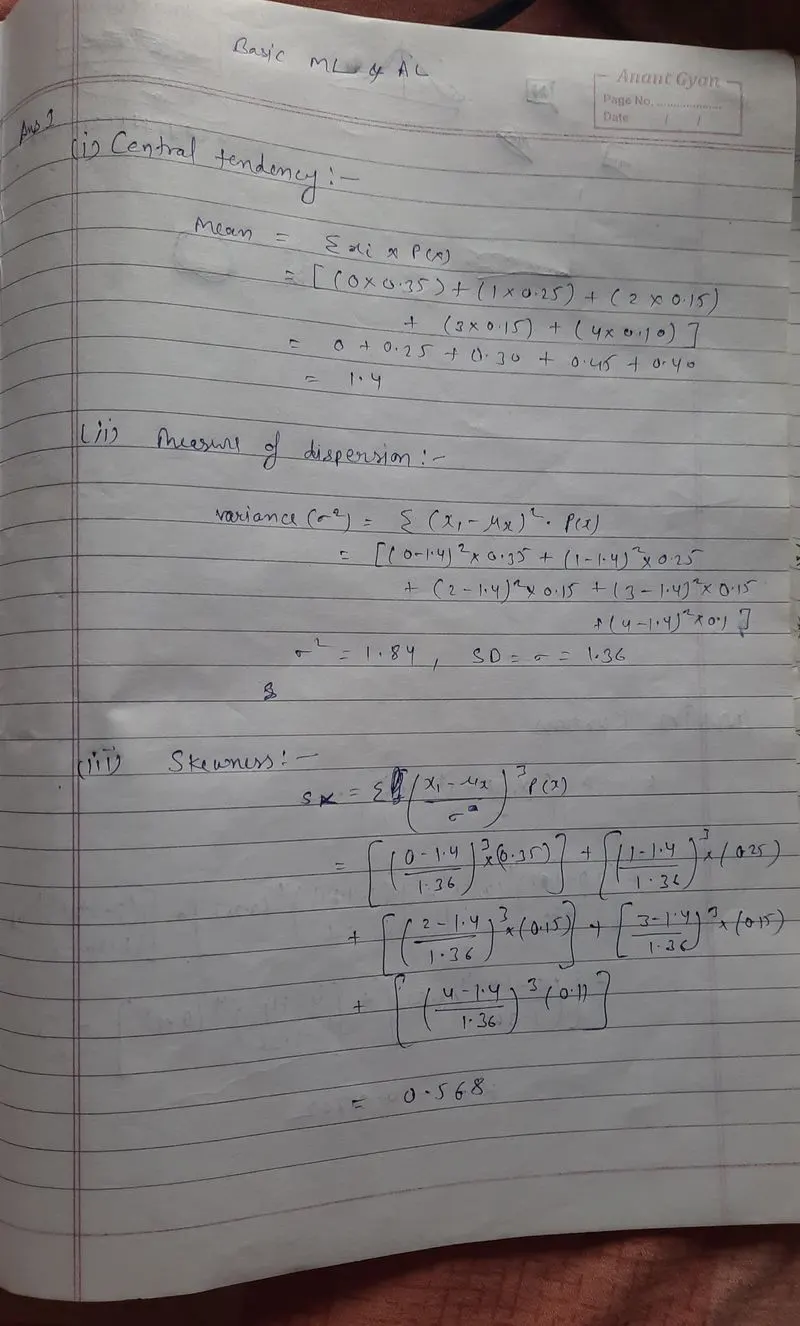
2. What is the significance of expected value when simple mean (Sum of all observations/number of observations) is already in place

ans: The expected value is a more general concept than the simple mean and applies to situations where the outcomes are not equally likely or where the values of the outcomes are continuous. For example, if we toss a fair coin, the expected value of the number of heads is 0.5, even though we cannot observe half a head in a single toss.

The simple mean is a descriptive statistic that summarizes a set of data, while the expected value is a theoretical concept used in probability and statistics to represent the average value of a random variable. While both concepts can be used to describe central tendency, they have different applications and interpretations.

3. Having skewness in the curve considered to be bad in the analysis?

ans: Skewness in the data is not inherently good or bad, but it is important to understand its implications for data analysis and to choose appropriate methods and models accordingly.

Skewness can affect the interpretation of summary statistics such as the mean, median, and standard deviation. For example, if a distribution is positively skewed, the mean may be higher than the median, and the standard deviation may overestimate the dispersion of the data.

Skewness can also affect the results of statistical tests and the accuracy of statistical models. In some cases, it may be necessary to transform the data or use nonparametric methods to account for skewness.

4. Evaluate the probabilities for continuous normal distribution with given mean = 680 and standard deviation = 31
a)P(X<711) = P(Z < (711 - 680)/31) = P(Z < 1) = 0.8413, where Z is the standard normal variable (with mean 0 and standard deviation 1). Therefore, the probability is 0.8413

b)P(X>740) = P(Z > (740 - 680)/31) = P(Z > 1.935) = 1 - P(Z < 1.935) = 1 - 0.9744 = 0.0256.

c)P(600<x<720) = P((600 - 680)/31 < Z < (720 - 680)/31) = P(-2.581 < Z < 1.290) = 0.9015 - 0.0047 = 0.8968, where -2.581 and 1.290 are the z-scores for 600 and 720, respectively.

d)P(X=720) = 0 This is because the probability density function of a continuous distribution is defined as the limit of the probability of an interval as the width of the interval approaches zero.

5)Explain the curve on the right side

It's a data set with an identical mean, median, and mode. Put more simply, normally distributed data has a perfect average. Look at a bell curve and you'll see it is perfectly symmetrical. There is exactly 50% of the data on either side of the midpoint. You'll also notice that the largest amount is at the centre of the curve and it tapers off as it gets higher and lower, giving it the distinctive bell shape.

A typical bell curve

As mentioned above, the average of the data is perfectly in the middle, but you can also see there are percentages given for each 'chunk' of data. Each one of these data chunks represents one standard deviation, but don't worry about that term for now. Just think of them as chunks of data. In a bell curve of normally distributed data, those percentages given will always be true. The middle chunk will always add up to 68.2%, the next chunk is 27.2%, the next is 4.2%, and the last little bit is 0.2%. Note that because of rounding, they don't add up to 100%.

Your portfolio, next

Ship work like this
in your own course.

Talk to a career counsellor

Free 20-minute call. We'll map the right course to where you want to work.

By submitting you agree to our Terms and Privacy Policy.