Assignment 7-Side Pole Crash Simulation Challenge
SIDE POLE CRASH SIMULATION OF CAR - WHEN THE POLE IS AT 90 DEGREES AND 75 DEGREES (USING HYPERMESH AND HYPERCRASH)
Objective:
To perform a crash analysis on the left side of a Dodge Neon BIW, also known as a side crash. The analysis is to be carried on the deformation and the forces created as a result of the crash at a speed of 35 mph. Along with the analysis, certain output requests were to be generated and they are as follows:
- Sectional force in the cross members.
- Intrusion at B pillar, hinge pillar, and fuel tank region(Also provide recommendations on what can be done to help reduce fuel tank intrusion)
- Peak velocity of a node on the inner door panel.
Introduction:
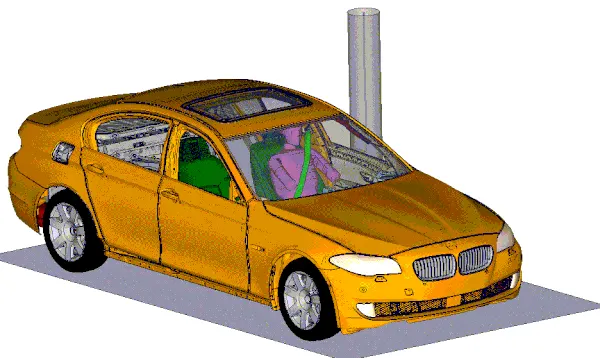
- Assume that you tried to steer your car at high speed at turning but speed was enough to outwit the Tires resisting force and you hit the rigid cylindrical object like a tree. So, in this and many other cases like a side car accident, slipping on a snowflake, etc. can cause damage to the passenger if the car is not designed with great care. This is where the side-impact standard comes into the role. The standard has been devised by the standard maker like FMVSS (214, 201), EURO NCAP, US NCAP, and IIHS. Again, for this project, the car with the simplified model is taken for analysis purpose. The model is prepared following the guidelines suggested by the FMVSS 214 standard. The analysis is executed to check the intrusion made inside the car, intrusion inside the fuel tank (for hybrid electric vehicles, battery-package system, which is more dangerous), and how much the B pillar is affected.
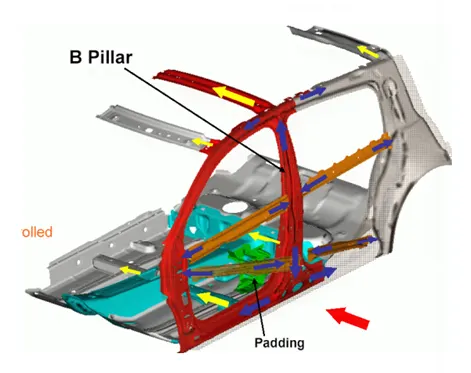
- According to the standard, relative displacement (intrusion) must be small before the inflation of the airbag. Indeed, the strength of the B pillar and other surrounding structures should be high enough to bear the impact force and should not deform at least up to a small duration of time. The major component which is going to play the major role in this impact is B pillar, rocker, Door outer, Door beam, Door support, roof rail, roof bow, front header, and cross rail. So, let's our discussion starting from the preparation of the model, simulation to the analysis of the result and validation.
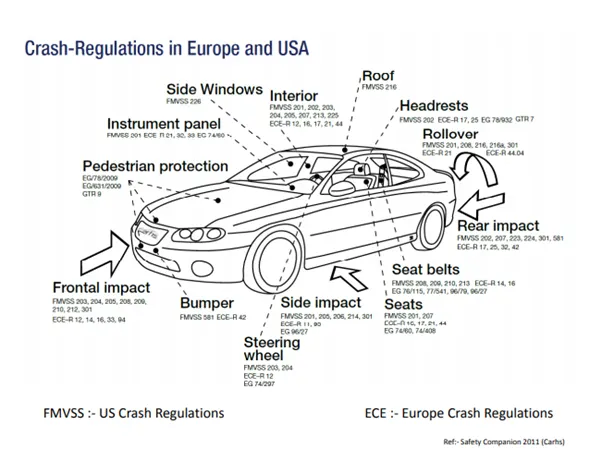
- In different parts of the world, there are several vehicle safety assessment programs that perform crash test in order to increase vehicle safety and ensure that vehicle has good occupant and pedestrians safety. These programs focus on improving the crashworthiness of motor passenger vehicles and reduce the number of injuries. In Europe, there is the New Car Assessment Program (NCAP), based on the program introduced in 1979 by the NHTSA (National Highway Traffic Safety Administration) in the USA. the Euro NCAP frontal crash test standards are followed in India.

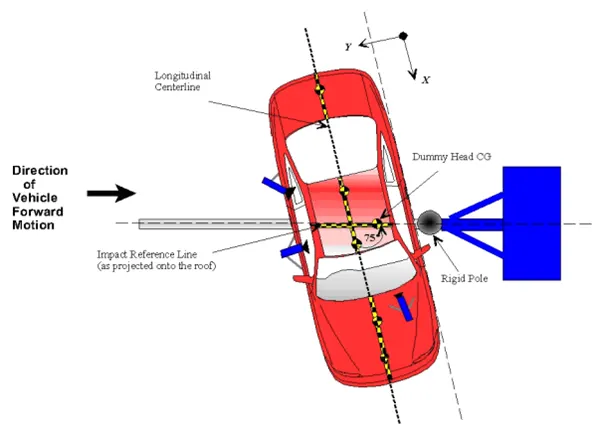
- Here in this simulation, we are going to take the angle of inclination as 90 degrees instead of 75 degrees and initial velocity as 35 mph as per the given requirements.
PROCEDURE:
- Check for Unit system
- Import model in HYPERCRASH
- Check for penetration and intersection
- Add masses to reach a target weight of 700kg
- Export changes file and import in HYPERMESH
- Create Self Interface contact
- Create a rigid wall
- Add Initial velocity to the model
- Create cross-section's to find sectional forces on the cross members
- Create springs to check intrusion in different positions
- Assign property to springs
- Create TH for section forces, intrusion springs, interface contacts
- Create cards
- Run Model checker and correct errors if any
- Run the Analysis
1. Import the Model
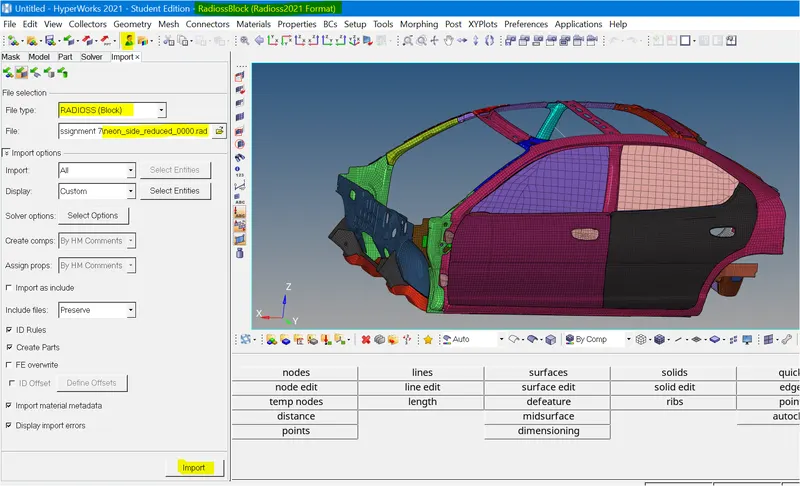
- First, we will import .rad starter file of the model which is named as neon_side_reduced_0000.rad in Radioss using Import Solver Deck option.
2. CHECK FOR UNIT SYSTEM:
- Now in order to check the unit system of the model. we can go Model browser, and in Cards, check BEGIN_CARD or we can just open the Neon_front_0000.rad in a notepad, where we will be able to check the units.
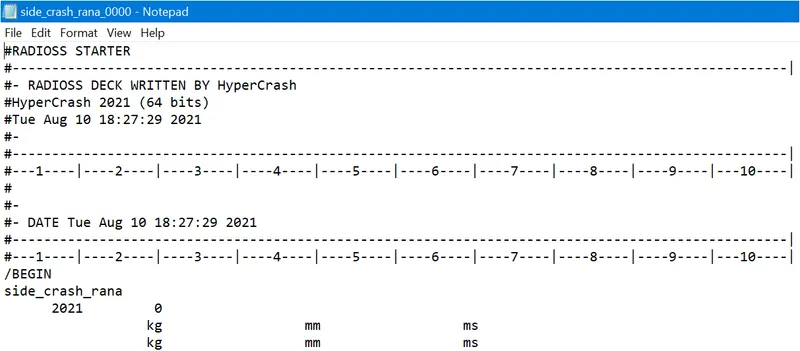
- So for this model, we will see that the unit system followed is [kg mm ms].
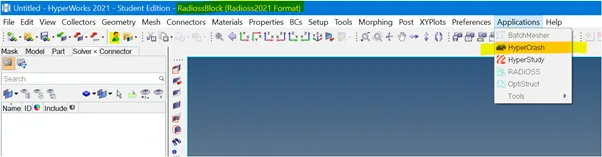
- We will be using Hypercrash and Hypermesh to set up the model. Some checks will be done in Hypercrash and some in Hypermesh. First, we will import the model into Hypercrash
- Go toApplication >> Hypercrash>> Select the unit system >> open
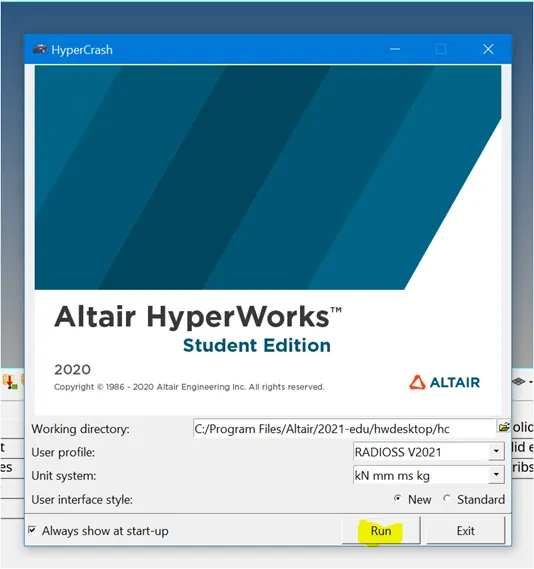
- Select Neon starter file and drag it to hyper crash application to open the model
3. CHECK FOR PENETRATION AND INTERSECTION:
- Penetration is defined as the overlap of the material thickness of shell elements, while Intersection is defined as elements that pass completely through one another. All models and especially impact models should be checked for penetrations and intersections and De penetrated to ensure the integrity of the model. Penetrations adversely affect results and should be removed.
- To check penetration and intersection, Go toQuality>> Check all solver contact interfaces >> Select parts > Click on check penetration
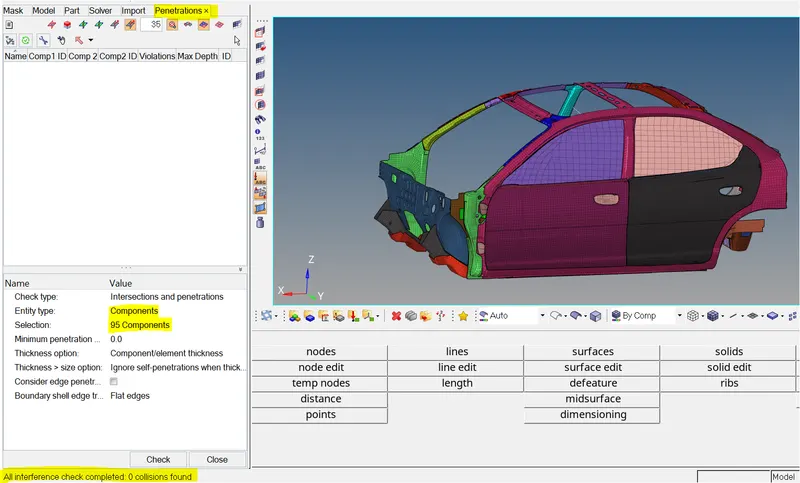
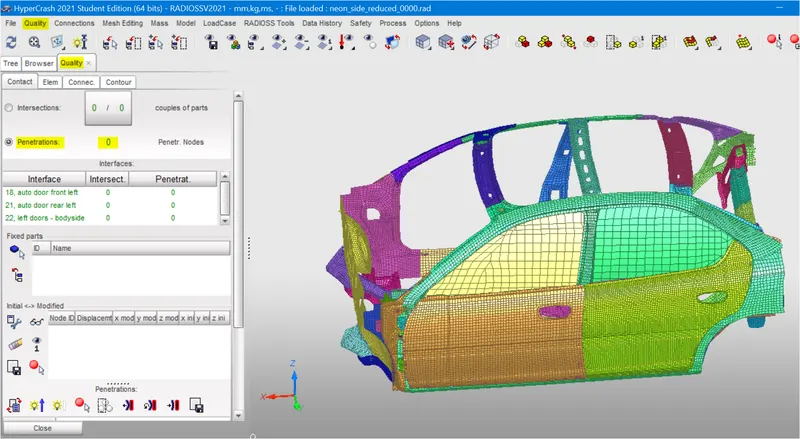
- As you can see in the image below there are no penetrations or intersections present in the model
4. Compare the model weight with the full-scale 300k nodes model and use added masses to reach a target weight of 700kg while getting CG about the required range.
- A vehicle’s center of gravity, or CG, is the theoretical point where the sum of all the masses of each of its individual components effectively acts. In other words, from a physics perspective, a vehicle behaves as its entire weight resides at this one point. Carrying weight up high, such as a panoramic sunroof will raise a vehicle’s CG while placing heavy subsystems low in a vehicle, such as a battery pack, will work to lower it. Lower is better from a handling standpoint, as it reduces weight transfer during cornering and braking, and it also reduces the propensity to roll over.
Add Masses
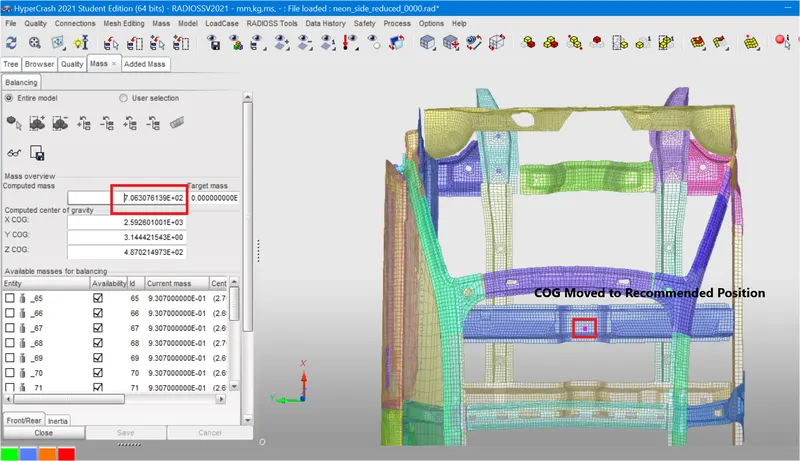
- Mass balancing: In order to maintain the CG of a car we have to add mass for the given components, In the given model here are so many parts are missing because of the node limits in the student version
- To check the CG, Go toMenu >> Mass >> Balancing >> Show CG point
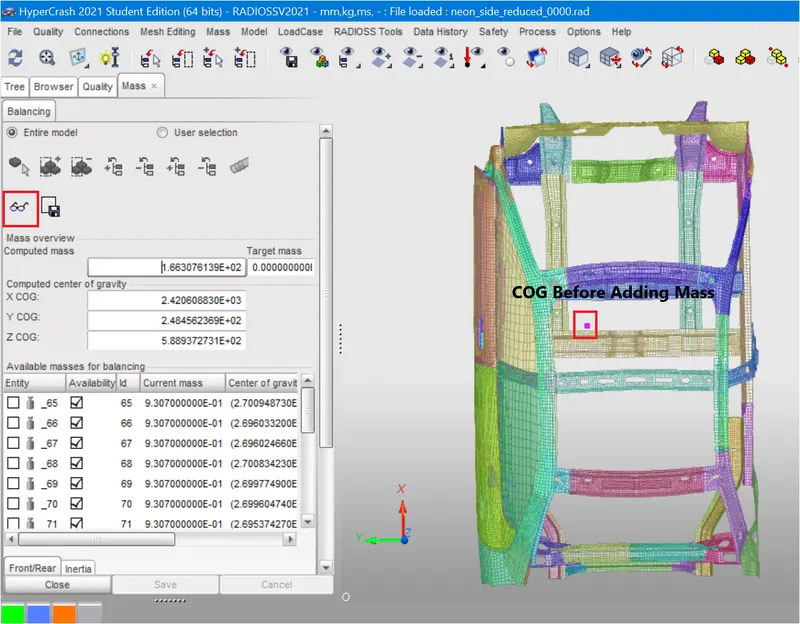
- Current weight: 166 kg
- Target weight: 700 Kg
- After selecting that, by right-clicking on Mass browser select Create New. In that, Type 1is selected.
- In order to distribute the given mass to each node of the node group selected.
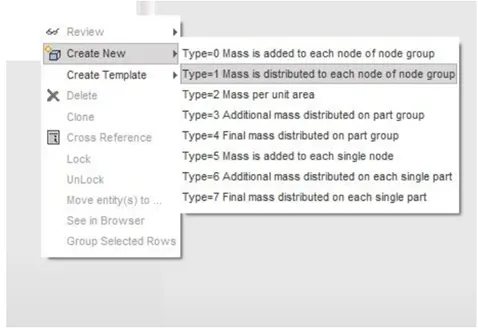
- Now, we added mass to different components in the BIW structure in order to obtain the required mass of 700 kg and to place CG at the required location
5. Applying Initial Velocity
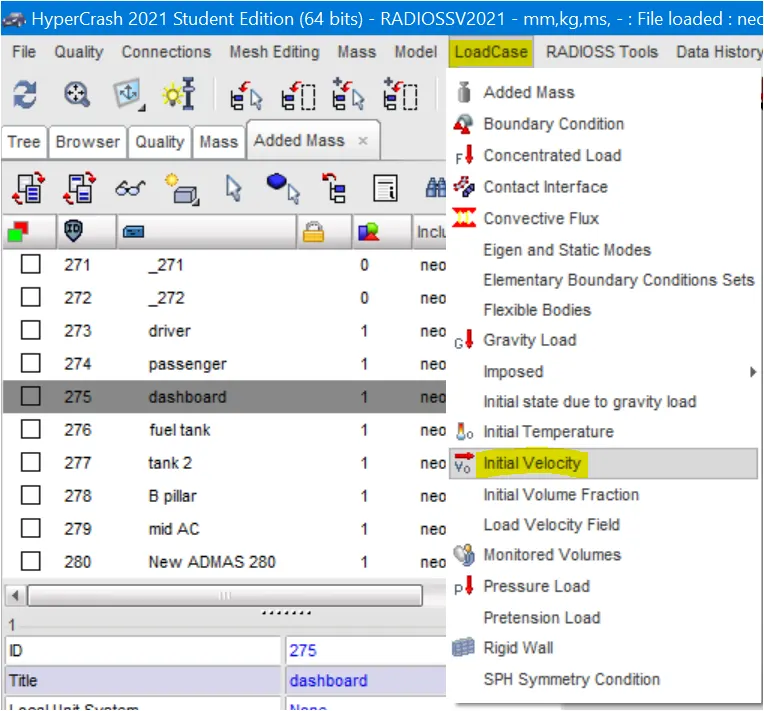
- To add initial velocity to the system in Hypercrash, we need to go to LoadCase >> Initial Velocity.
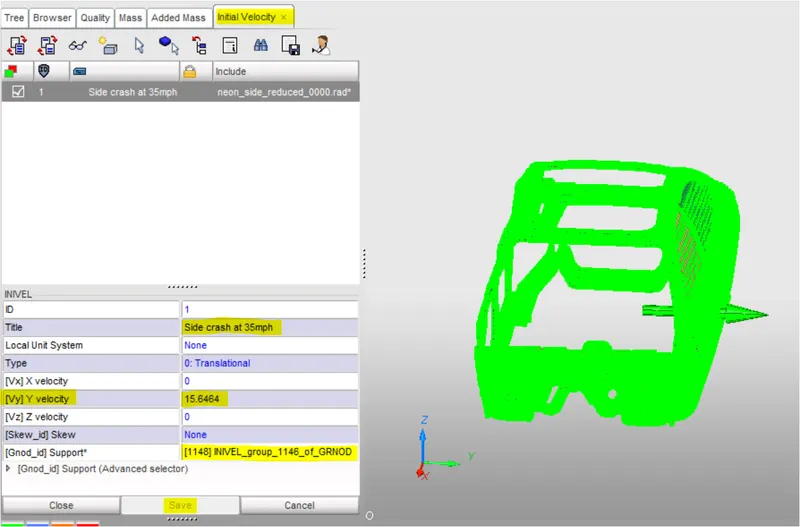
- For [Gnod_id] Support, we shall be selecting all the nodes in the model. The required velocity is 35 mph but the units are in mm/ms, which would be 15.6464 mm/ms. and the vehicle is moving is along the y-axis, so this value will be entered in [Vy] Y Velocity. All other velocity values would be 0.
- After entering the values, we can click save at the bottom of the panel.
Reviewing Initial Velocity
- Now export the radios file from Hypercrash and import in to HyperMesh to do rest of the case setup
6. Create Contact Interfaces
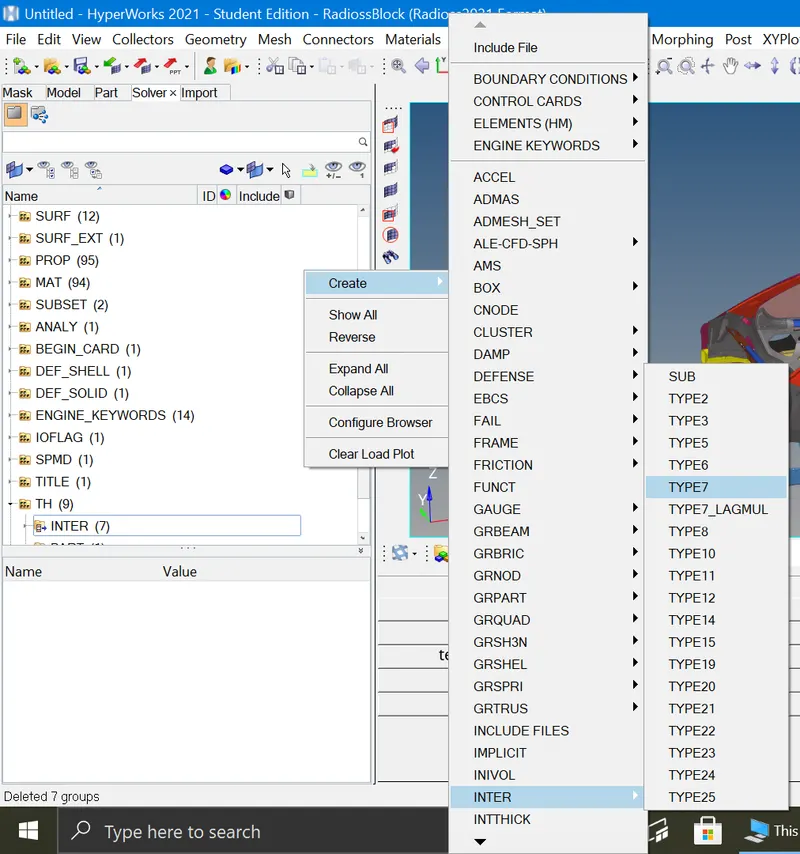
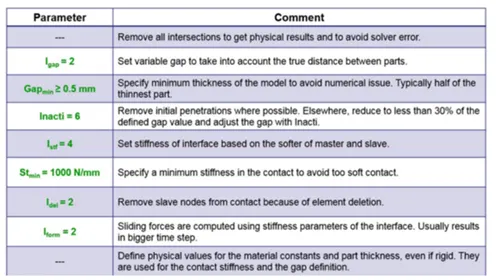
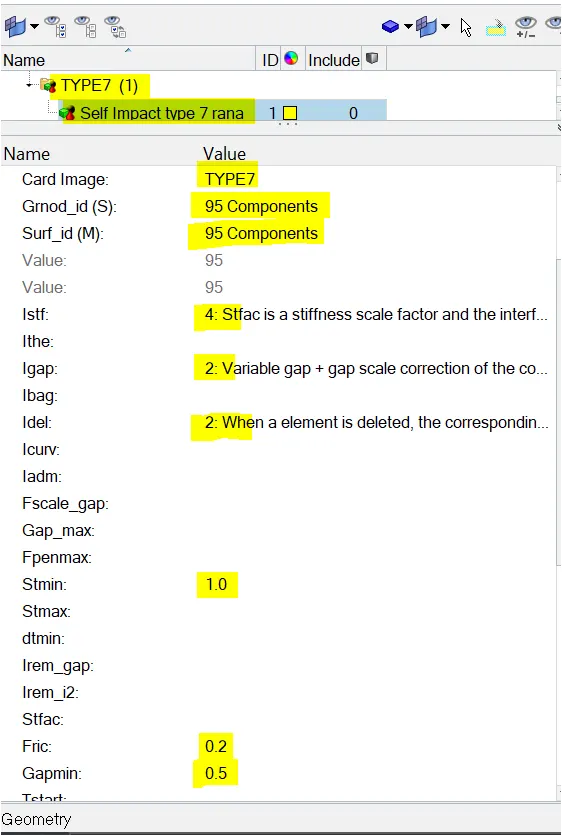
- For this model, we will create Type 7 interface for all the components of the model as it is self-impacting or the nodes and elements of the model will have contact between them. Interface TYPE7 is a multi-usage impact interface, modeling contact between a master surface and a group of slave nodes. It is also possible to consider heat transfer and heat friction.
- We will go to Solver browser and we will delete all the existing interfaces.
- Now to create a new contact, Go to model browser >> Right-click >> Create >> Contact >> Rename as Self contact >> Select slave node and master components >> Enter Type 7 recommended properties
7. CREATE A CYLINDRICAL RIGID WALL:
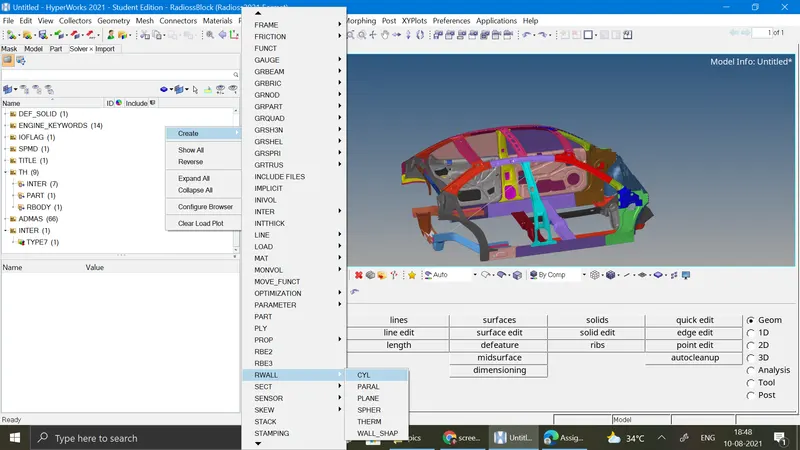
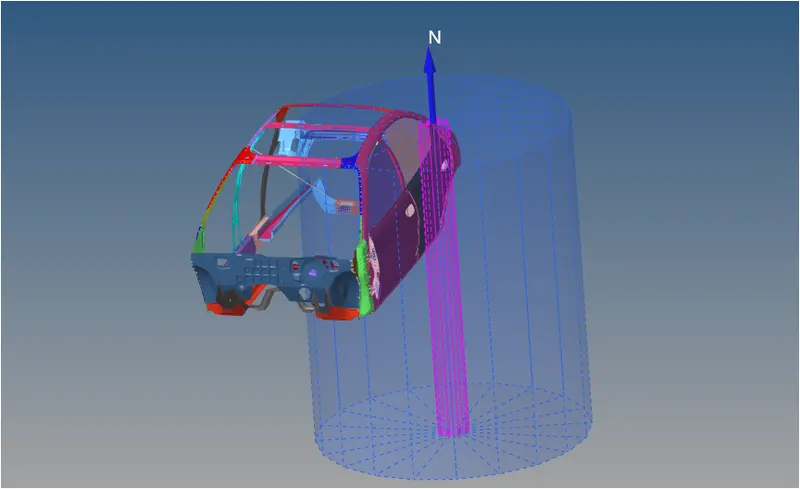
- To create a cylindrical rigid wall at the left side of the car, we will need the outermost node at the front left door of the car. So, we will create the outermost node on the element edge using temp nodes Then we will right-click in solver browser and navigate to Create > RWALL > CYL.
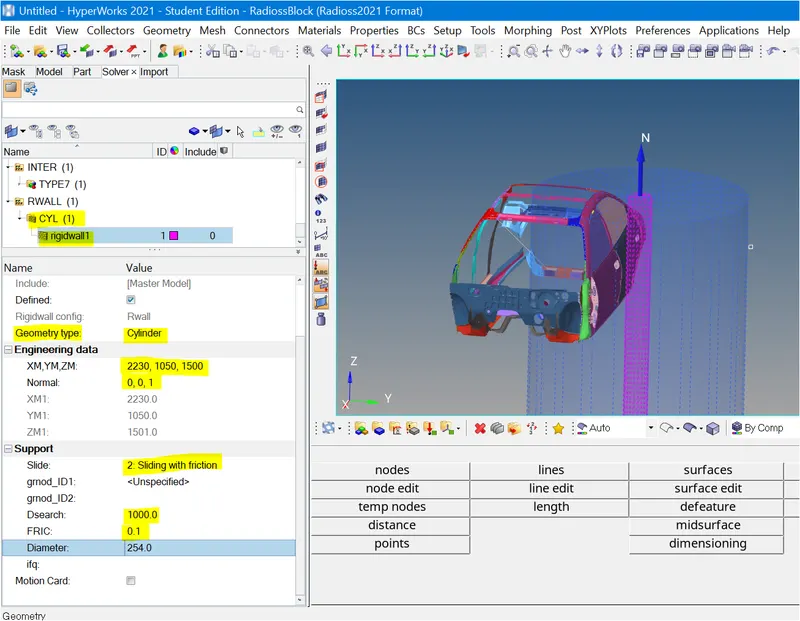
- In the RWALL panel, under Engineering data will specify the coordinates of the pole which will be at some distance from the outermost node on side door. Then we will give the normal direction to the pole in the Z-axis and diameter of the pole to be 254 mm. The FRIC value will be 1 and Dsearch value will be 1000 as shown below.
Properties of Rigid Wall
- The cylindrical rigid wall or the Pole will then be created as shown below.
8. Creating Cross Section –
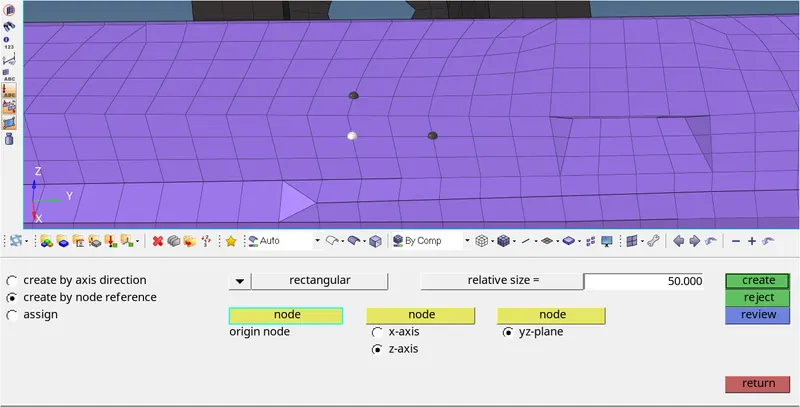
- The results which we want on required cross sectional parts will be calculated based on a frame of reference. So before creating cross section, we will create moving frames on a particular node of that section. Now as we must create the moving frames which are also called as local axis, we must perfectly align our local axis to the global axis. So for this, we will extract the node location or coordinates of a particular node on the section in nodes Then we will offset the node in X-axis by 10 units and create a new node. Similarly, we will offset and create a node in Y-axis as shown below.
- Now we can create moving frame using these nodes. In Solver browser, we will right-click and navigate to Create > FRAME > MOV. So here, we will create frame by node reference and select the nodes for x-axis and xy plane and then click on create.
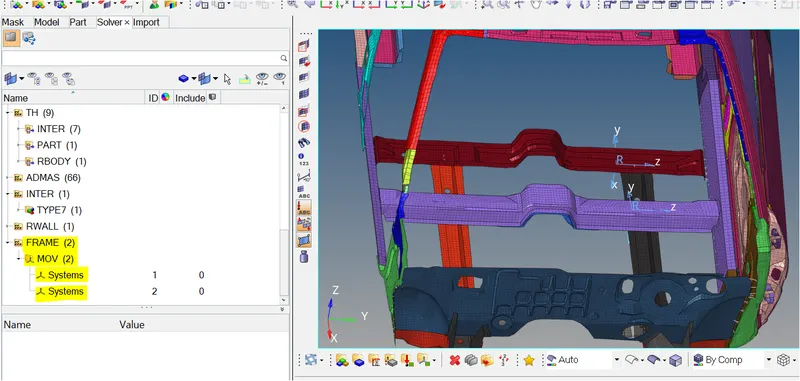
Frames are Created Successfully
- Thus, a moving frame will be created. Now we will create cross-section for this frame. To create a cross-section, we will right-clickon the Solver browser and navigate to Create > SECT > SECT. In section panel, we will specify the Frame_ID as the moving frame which we created and delta value as 1. From Hyperworks help menu, we get that the general value of alpha is taken as 2π/10. Thus, we will specify alpha as 0.628. We will right click and create grshel_id, then we will select the elements where we want the cross-sectional results.
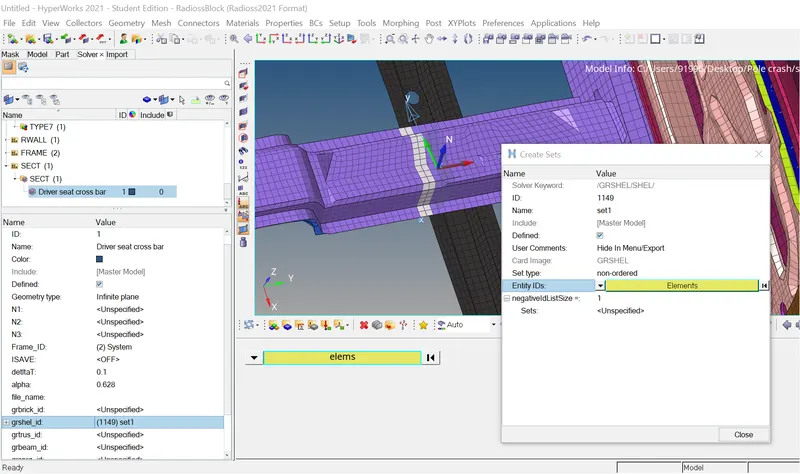
Selecting elements for section
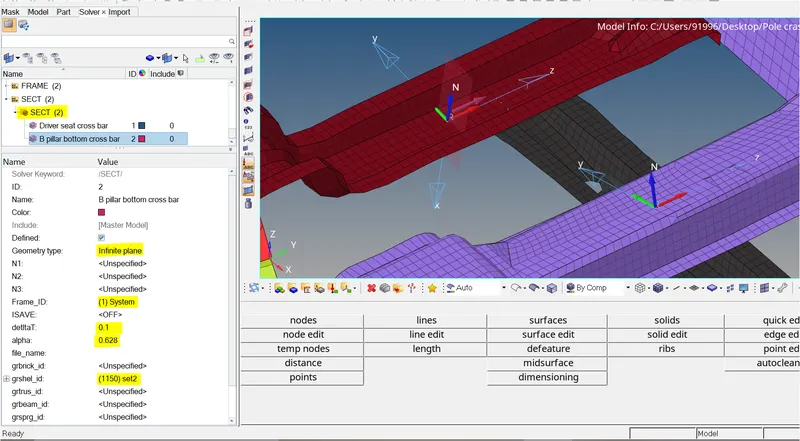
Sections are created successfully
9. To Measure Intrusions –
- Here, we need to find the intrusions at B-pillar, hinge pillar and fuel tank. So to find the results at the specified parts, we need to create spring between left and right parts of B-piller, Hinge-piller and fuel tank, for creating spring go to 1D -> SPRINGS -> SPRING2 and select 2 nodes as shown in figure below.
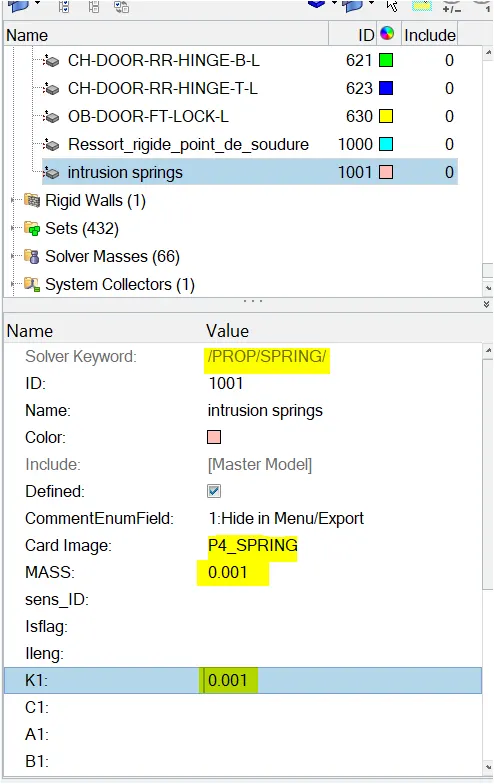
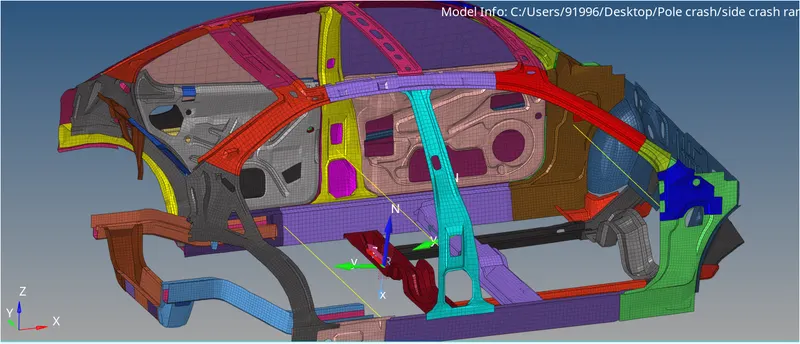
3 springs are created for calculating intrusions
- Now we must create property card for spring and assign it to the spring element created
- Go to model Browser >> Create >> Property >> Rename as Intrusion springs
- After creating a property, a new tab will open there we have to select CARD imageas P4 SPRING and Mass as 001, and Stiffness as 0.001
10. Peak velocity of inner node of the door:
- To find peak velocity at the inner node of the door, we will create a moving frame at the node location by using right-click on solver browser -> create -> skew -> MOV
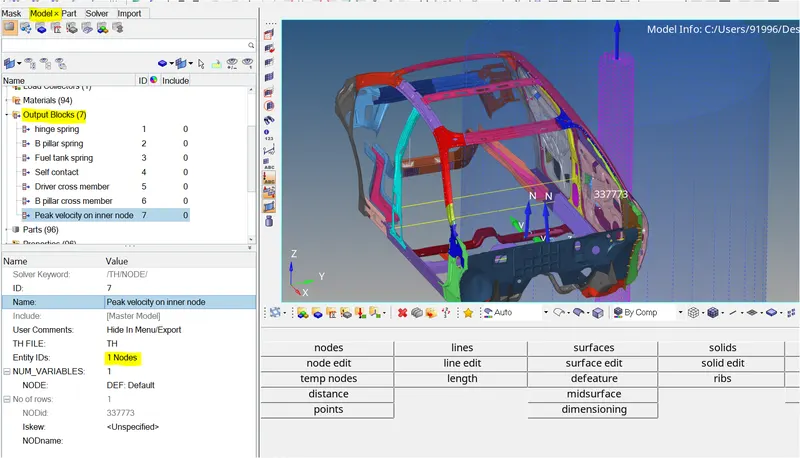
Peak Velocity of required node
11. Requesting output (Time History files) for spring
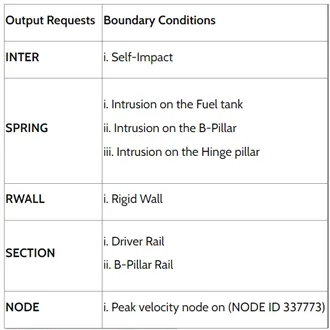
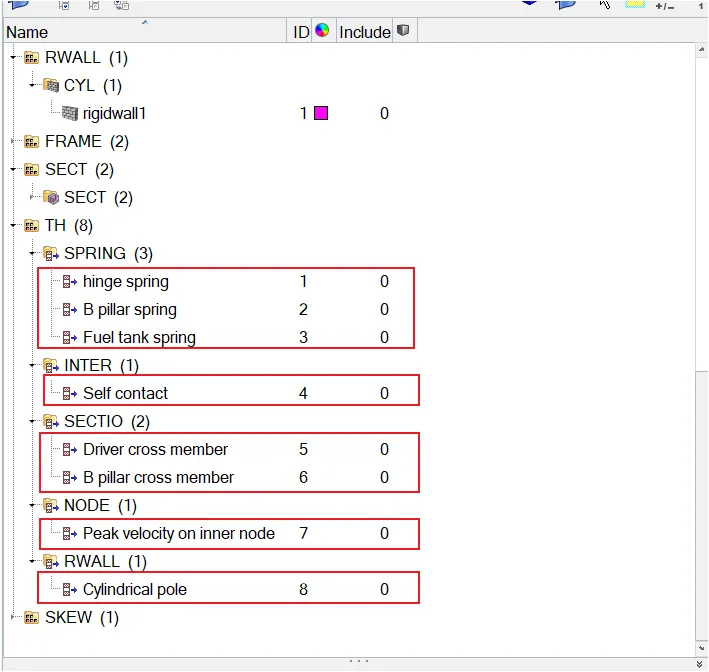
- In order to measure intrusions on the spring, we have to request /TH/SPRING files, go to solver browser -> right-click create ->TH -> Spring
12. Creating Output Blocks
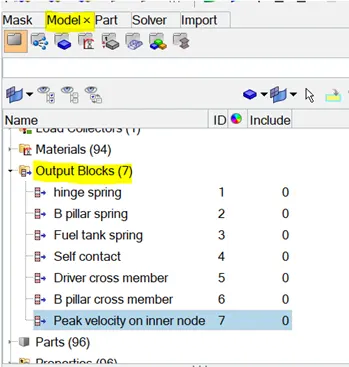
- Output blocks contain the data which we need to create graphs after the simulation
- Therefore, we need to create 7 different output blocks for different sets of data
- Print only the required output blocks as this makes the simulation fast.
13. Time Step and Run time:
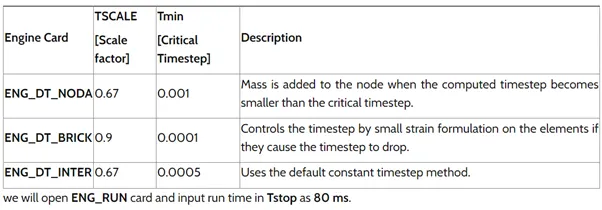
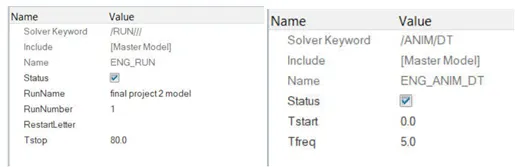
- To check these parameters in Hypermesh, we will navigate to Cardsunder Model To check the run time, For the time step, we will input timestep value as shown in table below
Timestep Control:
14. Errors and Warnings in Model Checker:
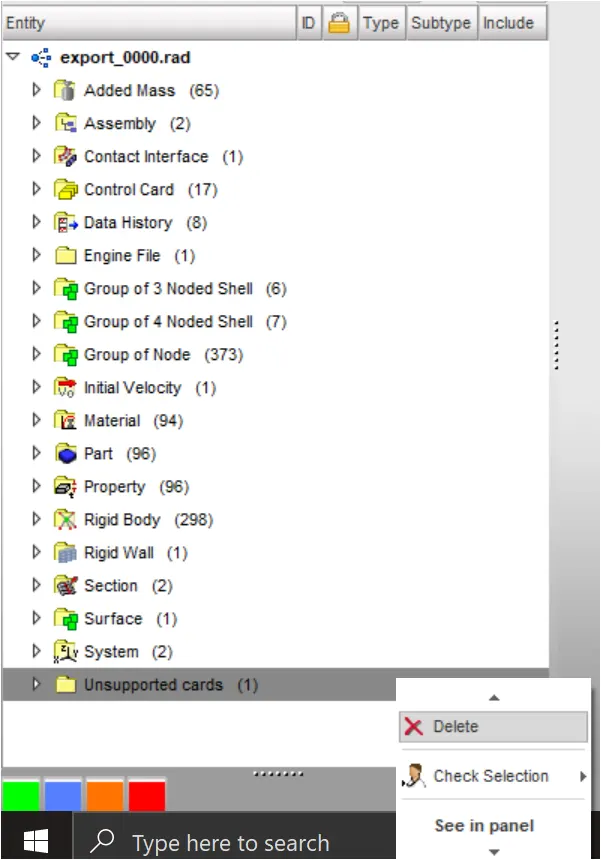
- We can easily identify and delete Unused sets and Empty sets using tools >> empty or unused option
- Similarly, delete unused translational joints and spherical joints
- Also, Create property and assign that property to the springs
15. DRY RUN (Simulation)
- Sometimes, the errors are not shown in Model Checker
- In this case we should run a dummy simulation to know the errors
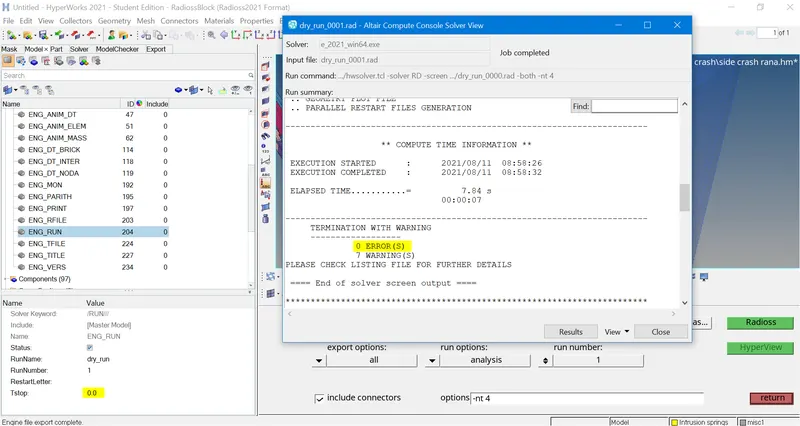
- To do that go to ENG_RUN and change Tstop value to 0.
- Now run the analysis as shown below
- It will run in quick time and points out all the errors
- Note down all the errors and rectify them
- After rectifying all the errors change the Tstop value as required and run the analysis
- This Dry Run is useful for Simulating Bigger Models
Dry Run
- Since there were no errors during the dry run, we can now run the actual simulation
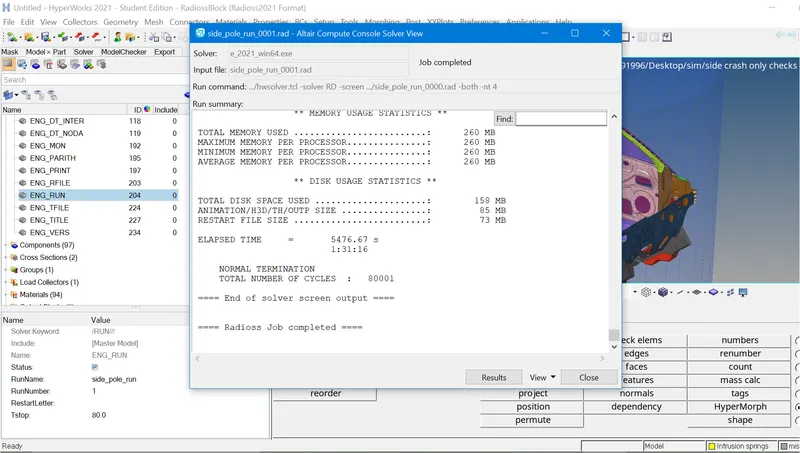
- Change Tstop to 80 and run the analysis
Analysis is done
16. ANALYSING THE OUTPUT FILE
- The next step is to carry out energy error and mass error checks and this is done by analysing the RADIOSS engine output file. This can be accessed from the same directory as the starter and engine files and is denoted by the '.out' extension. The file in question contains '_0001.out' and can be accessed using any text editor - such as Notepad.
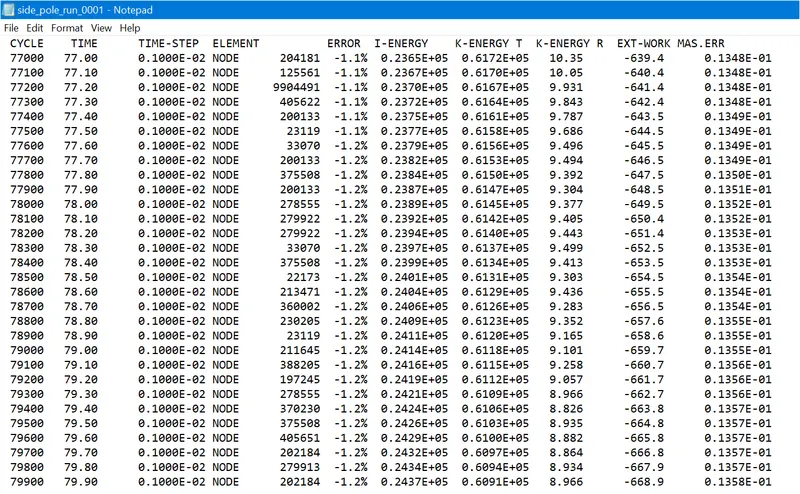
- As we can see, the energy error is -1.2%. It is acceptable due to its proximity to 0% error. In addition to that, the mass error is 0.013, which is very less and acceptable.
- Total Simulation Time: 5476.67s
- Total Number of cycles: 80001
17. SIMULATION ANIMATION
- To view the simulation, we can switch to Hyperview through the client selector
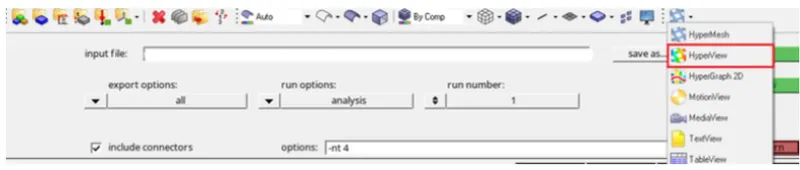
- In Hyperview, we will need to import the h3d variant of the file. After importing, we can then select the 'contour' tool to switch to the Von Mises contour so we can analyze the stresses that form within the BIW in the simulation.
A. Displacement contour plot
- In the above crash simulation of the vehicle, we can see the vehicle BIW is impacting on a Pole. After the impact, the frame of the vehicle deforms and the vehicle body gets contracted around the pole with left B-Pillar as the pivot point. The CG of the vehicle is in the same axis or direction of the pole, so we can see even deformation of the frame around the pole.
B. Von Mises stress contour plot
- From the Von Mises stress plot, we can say that the stress distribution is quite good in the vehicle after the crash. There are very few areas where we can see stress concentration. Generally, the stress is more in B-pillar and cross members as B-pillar takes the initial impact and then the impact is transferred to the cross members.
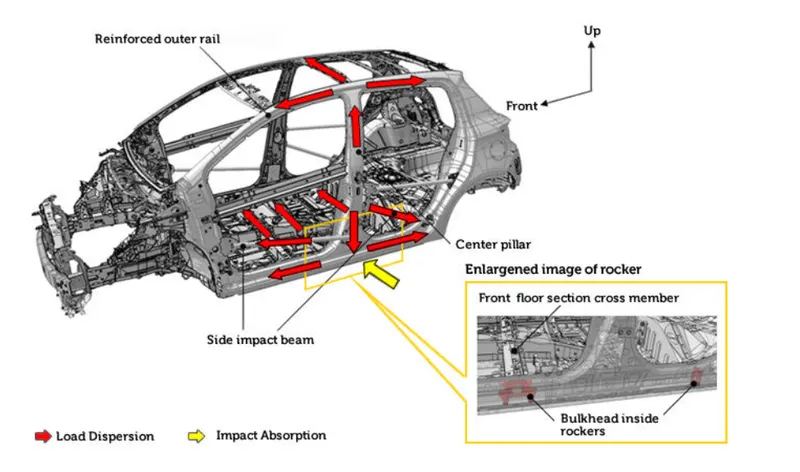
- From the simulation, we can see that initially, the car is hitting the R-wall cylinder with a velocity of 35mph, while the first impact is with B-Pillar then the forces going to transferred to the left and right and front direction in the roof rail and cross members in the bottom as shown in below figure. In each stage, transfer of force is going to reduce because energy absorbed by the components
C. GENERATING OUTPUT PLOTS
- After generating the simulation, we can then go ahead and generate the plots. Using the same client selector, we can switch to Hypergraph. In the Hypergraph client, we need to import time history file T01 file
- On importing, we can build the plots using different variables. We shall first look at general plots of energies and rigid wall forces generated in and by the entire BIW respectively
D. Global Variable - Energies
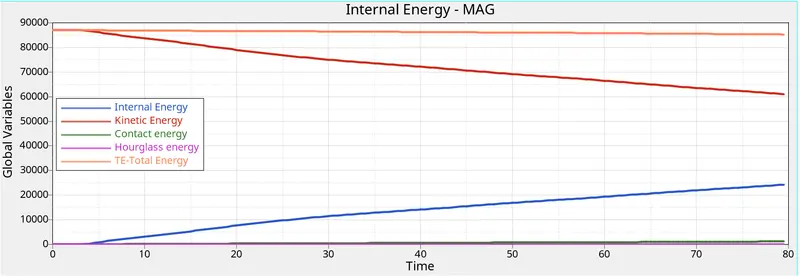
- The changes in kinetic and internal energies occur at the exact moment the BIW contacts the rigid cylindrical wall. Understandably, the BIW loses kinetic energy throughout the simulation due to the obvious decrease in velocity. At the same time, it absorbs the forces, and this results in an increase in internal energies, and as a result, the deformations also occur.
E. Contact Energy Graph:
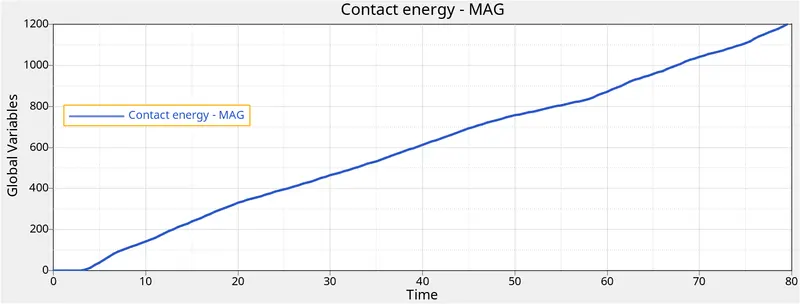
- Contact energy is a type of energy that is formed when one element meets the other or neighboring elements. The opposing force created by this element forms the contact energy. In this case, it takes off after 7 ms, at this point the model starts deforming in such a way that penetration of nodes occurs. When certain regions of the model press on themselves, buckled elements are forced into contact.
- The increase in contact energy affects the overall energy of this system, which is why there is a decrease in the total energy over the course of the simulation - it is a comparatively negligible decrease though. The magnitude of contact energy generated is much lower compared to that of the energies in the previous plot.
- From the above graph, we can see that the Hourglass energy is almost negligible since we have used Improved integrated element formulation (QEPH).
F. Rigid Wall Forces
- Taking a look at the rigid wall forces generated:
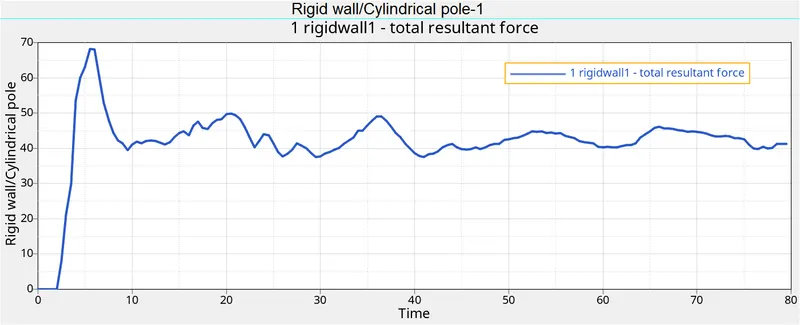
- As it can be seen in the starting, rigid wall force generated is zero till 2 ms of simulation because of no contact, but at the 6 ms there is a peak rise in the wall forces to a value of 68KN which is the point of the first impact, Then rigid wall force decreases and stabilize to a constant value as it progresses.
G. Sectional force on Cross-member:
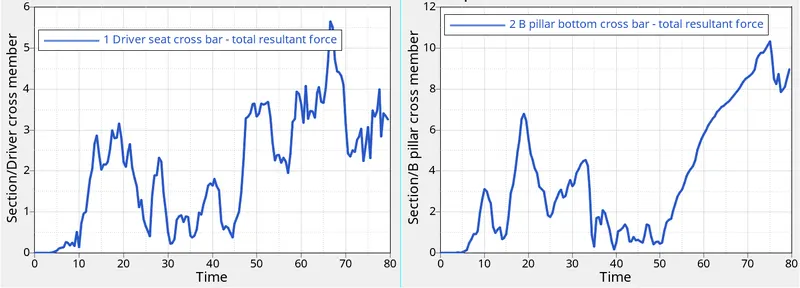
- Cross-members are very crucial in the side-impact analysis as these components prevent the body to shrink or deform inward. When the car hits the rigid body maximum amount of forces will pass through the cross member of the base and roof. This component along with door bar and support, door outer, B pillar, and rocker are also involved in the majority to prevent deforming. But the forces acting on every other component eventually pass from the cross member.
- The max sectional force at the B-pillar cross member is 10.2 KN at 75 ms and for the driver seat cross member it is 5.6 KN at 67 ms.
H. Peak velocity at Inner Door:
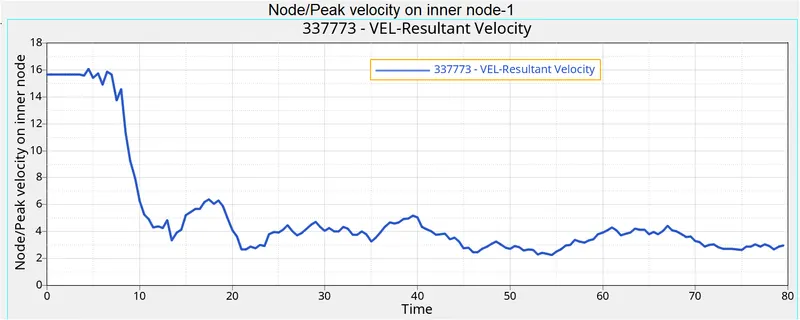
- As we all know that when the car hits the pole first impact will be the door and due to the deformation, the inner portion of the door might hit the passengers inside the car and lead to injuries. Hence it is important that the Peak velocity at the door region is to be calculated.
- From the Graph, the peak velocity of the node on the door is 16 mm/ms at 9 ms. The velocity of the node is almost constant before hitting the rigid cylindrical wall (up to 4 ms). After impact, there is a steep drop and then a small rise, probably due to the folding deformation created as the crash progressed (due to inertia). As time passes, we can see the velocity gradually decreasing.
I. Intrusion inside the car at B pillar, hinge pillar, and fuel tank:
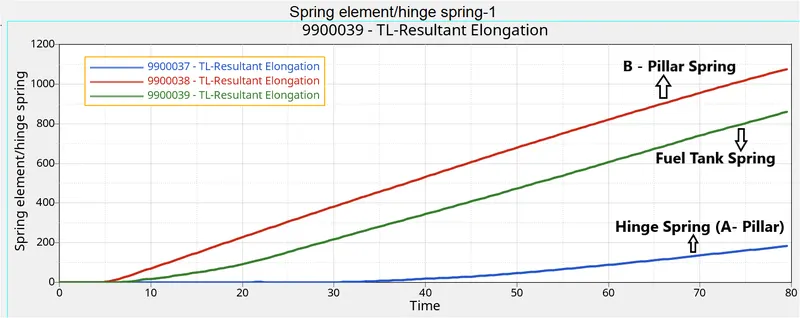
- The intrusion or deformation of the component can harm the occupants and the inner part of the car like a fuel tank. From the above plot, it is obvious that intrusion near the Hinge Spring (A- Pillar) is 200mm which is substantial and at the fuel tank it is around 800m, at B pillar it is 1100 mm which may damage the cabin and the passengers inside.
- The A-Pillar received the least displacement. Admirably, the B-Pillar was able to absorb a lot of the impact because the COG and the pole are side by side for B-pillar
- These intrusions can be avoided by using some alternative method or by adding additional Cross Member at the fuel tank, which can withstand load near the fuel tank.
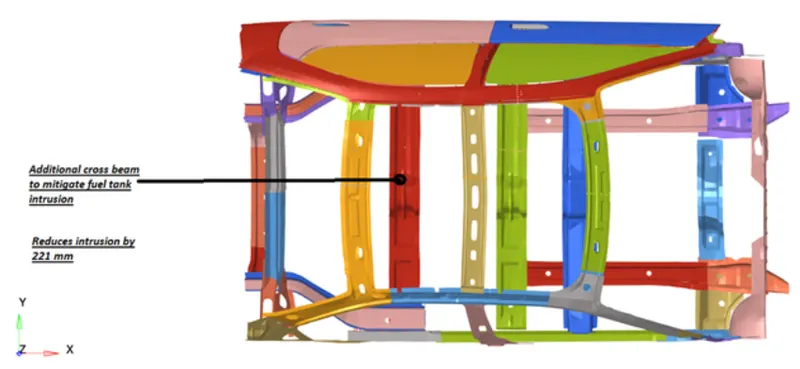
Adding Additional cross member for more rigidity at fuel tank
Conclusion:
The overall objective of this project was to simulate a Side Pole Crash and validate the results of the simulations obtained from the crash-test. Simulation was performed using the Radioss software package.
- All the required graphical results are obtained and discussed
- Due to the limited number of nodes in the student version some of the biw, engine blocks, suspension system etc are removed, so results are not as in real condition.
- From all the results we can say that the cabin is mostly deformed which is not acceptable. We can prevent this by providing additional cross members at top and bottom.
(Additional)
Simulation At 75 Degrees
- FMVSS Standards: https://www.nhtsa.gov/sites/nhtsa.dot.gov/files/tp214p-01.pdf
- According to FMVSS Side Pole Crash is carried out at an angle of 75 degrees and in most real case scenarios also the crash happens at some angle rather than 90 degrees.
- Therefore, I have created a simulation where the angle between the car and the pole is 75 degrees which is according to the standards of FMVSS
1. Rotating the model:
- First we need to rotate the model i.e all the elements to 75 degrees.
- we can use Tools >> Rotate option as shown below
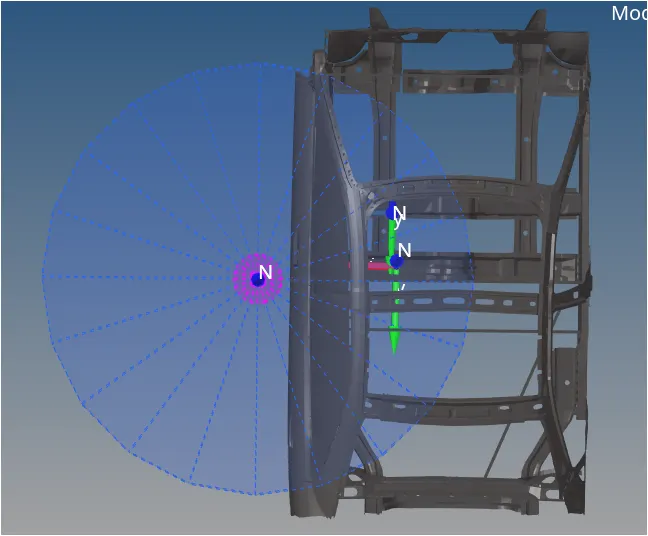
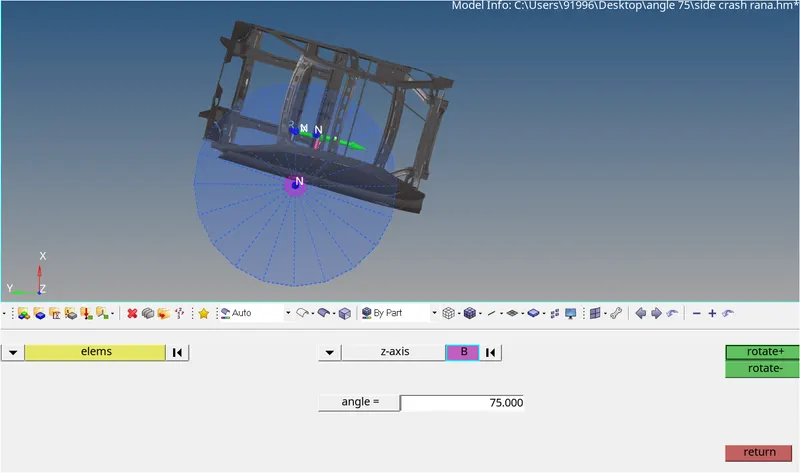
Model Before Rotating Model After rotating
2. Moving Cylindrical Pole:
- After rotating the mode we can clearly see that the pole come in contact with the elements of the car
- To avoid that we can move the pole in required direction simply by changing the co-ordinates of the pole as shown below
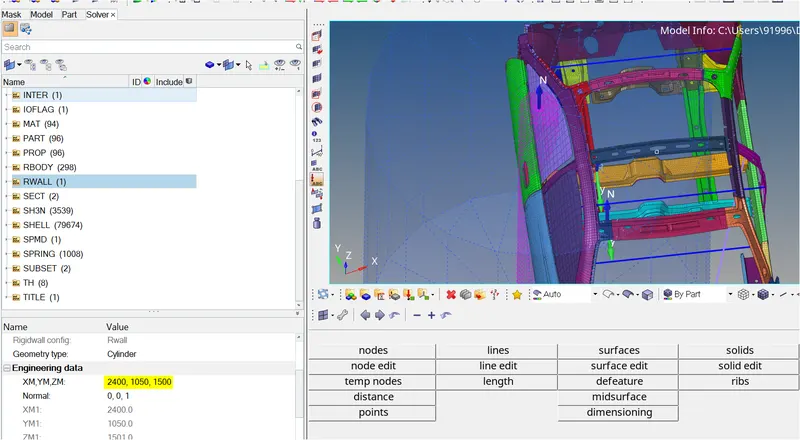
Pole Co-ordinates
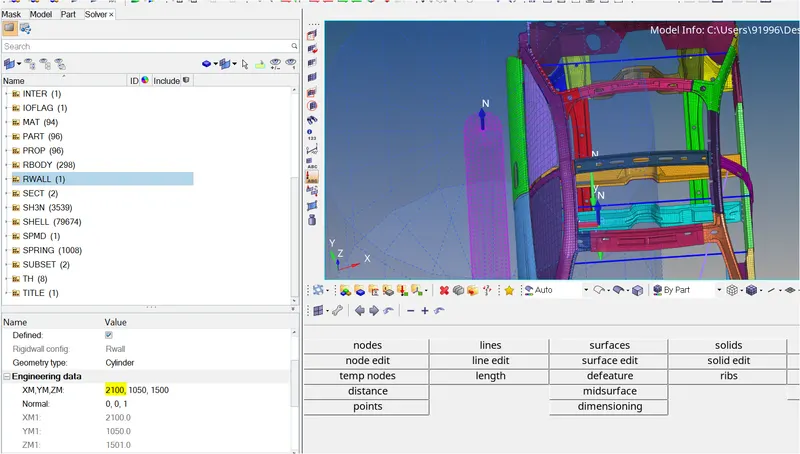
Modefied Pole Co-ordinates
3. Simulation:
- Now, input all the required conditions as in the above case and rectify all the errors and the run the simulation.
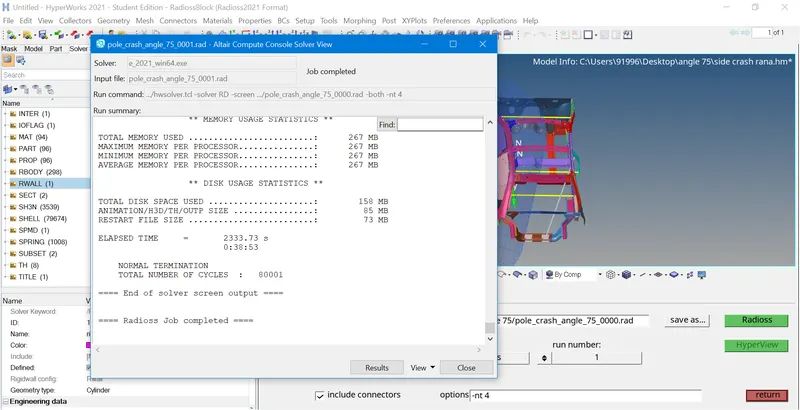
Analysis is done
4. Simulation Video:
Intrusions at 90 degree pole simulation
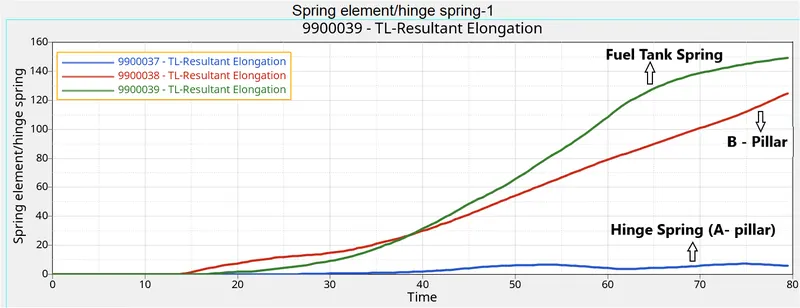
Intrusions at 75 degree pole simulation
- You can clearly see that the values of intrusions in the simulation occurred at 75 degrees case are much lower and are acceptable
- Cabin is much safer for the passengers at an angled simulation
- There is no need to add any type of cross member or any modification in this case (simulation at 75 degree).