Assignment 7-Side Pole Crash Simulation Challenge
AIM:
To perform side pole crush crash on the neon BiW model given.
OBJECTIVE:
The main objective of the project is to learn how and why the side pole crash test is done and the parameters involved.

PROCEDURE:
First, the starter file is imported in the Hypermesh application using the Import solver deck option.
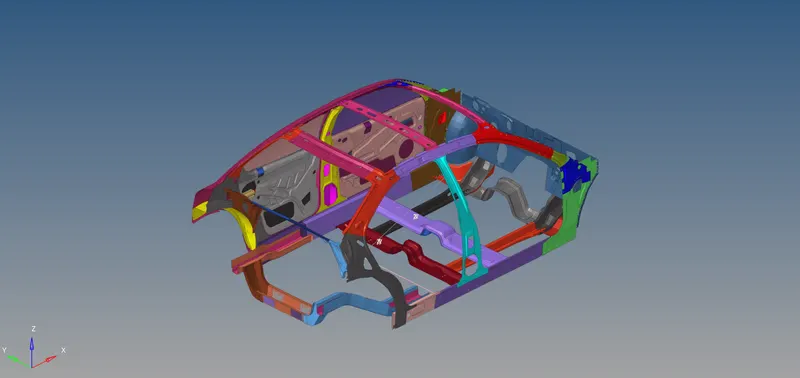
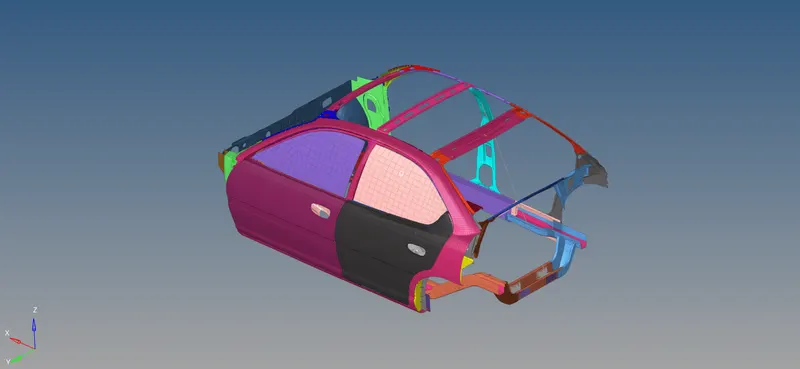
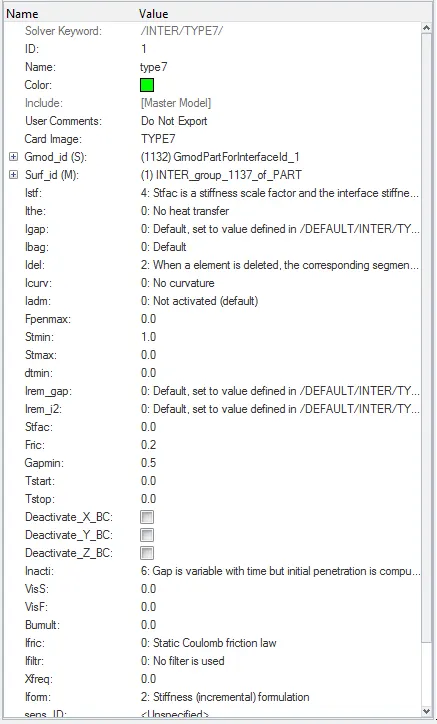
The unit system consistency is checked. The units are maintained in (Kg, mm, ms) format. Then the type 7 contact is given as a self contact for the BiW.
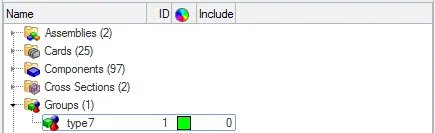
All the recommended parameters are set.
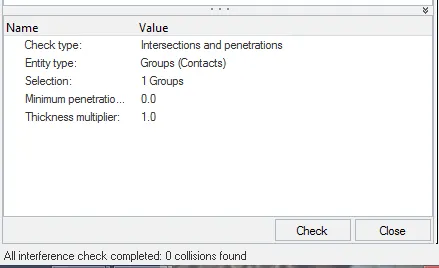
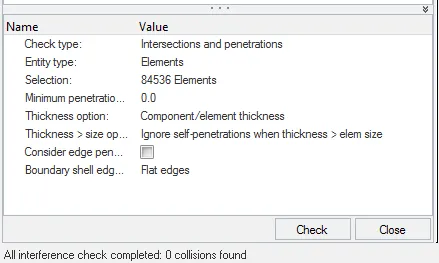
Next, the intersection & penetration checks are performed. There are no intersections & penetration in the model.
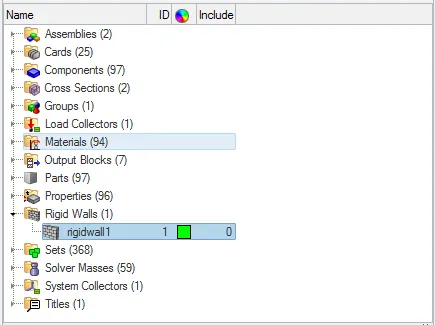
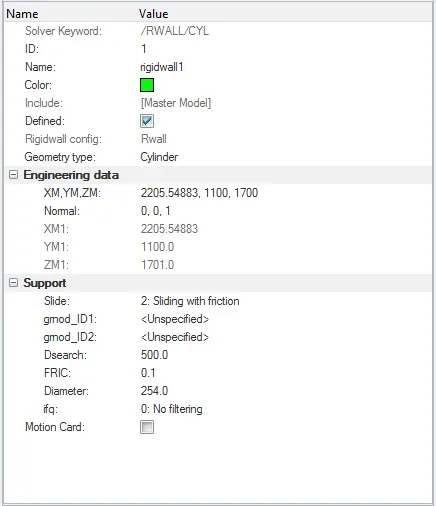
A rigid wall is created with friction 0.1.
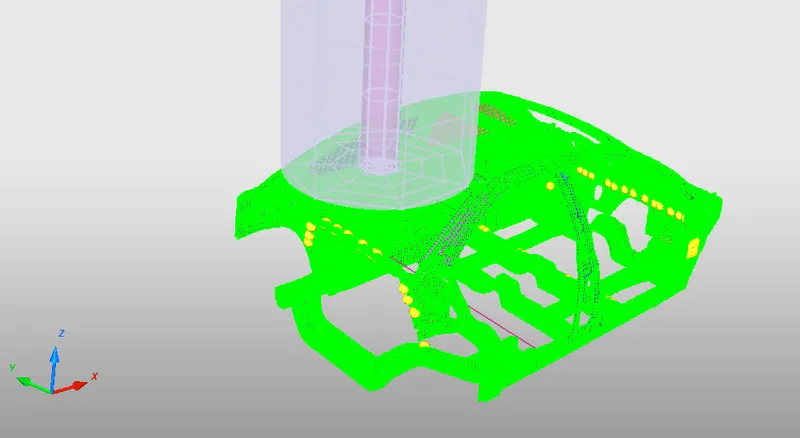
The rigid wall is chosen as a cylindrical one as we will be analysing the outputs for a pole crash test. The diameter of the wall & other parameters are also set
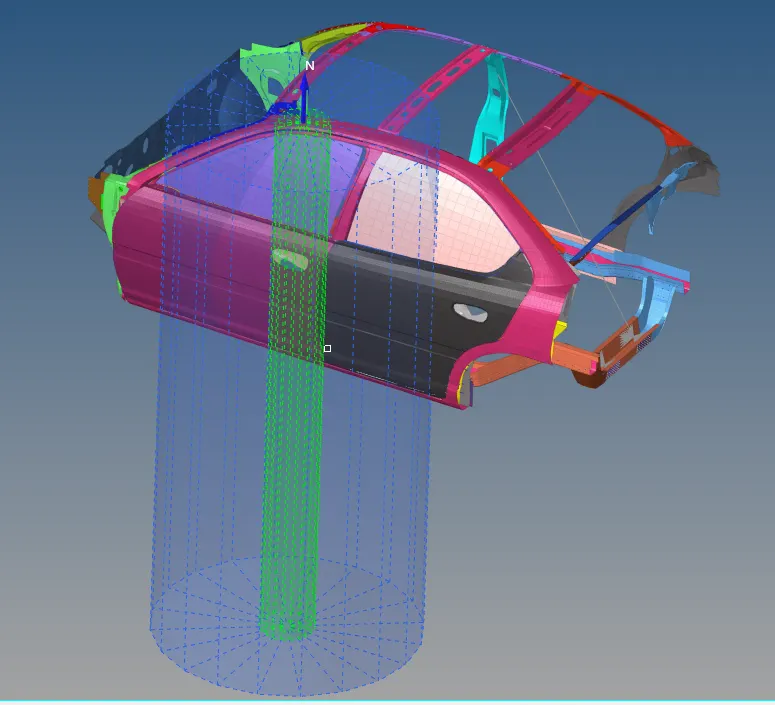
The model weight is compared with the reference model.
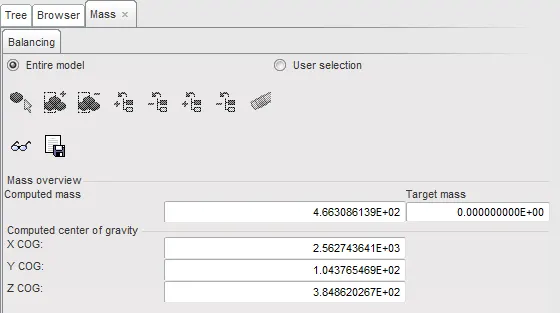
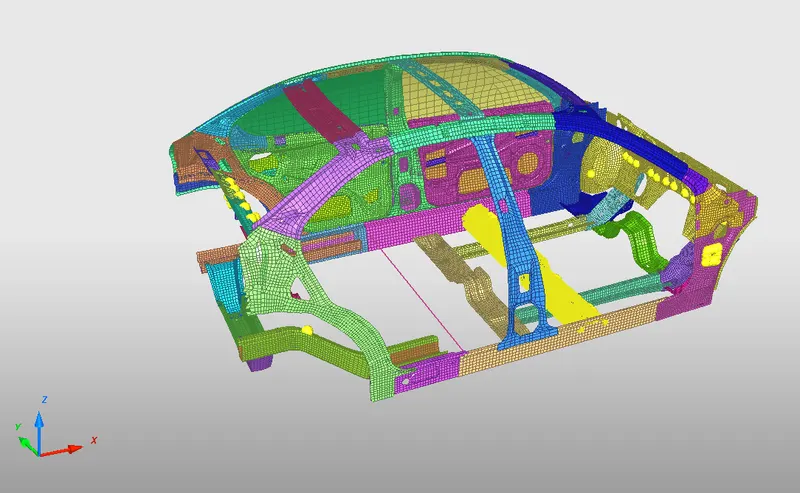
Masses are added and the model weight is brought up to 700 kg.
The initial velocity is created for the model.
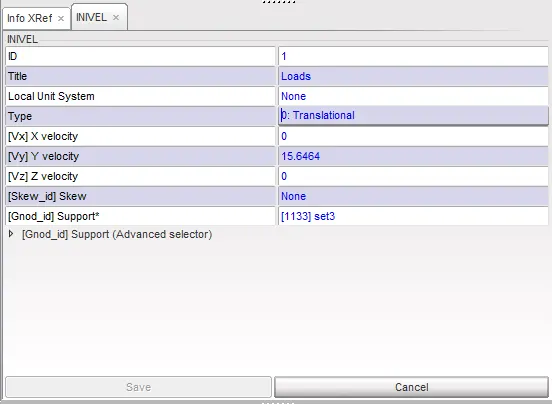
As the pole is located in the y axis, the velocity is given only along the y-axis.
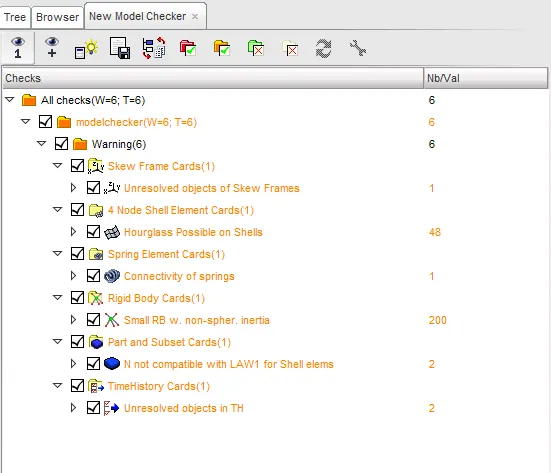
Then the model is checked in HyperCrash with the model checker. Errors, if any, are fixed.
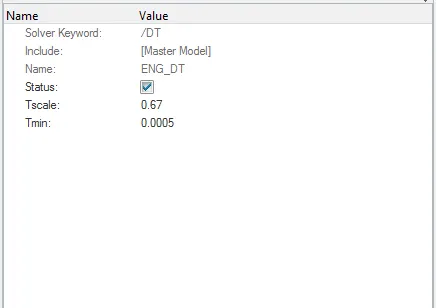
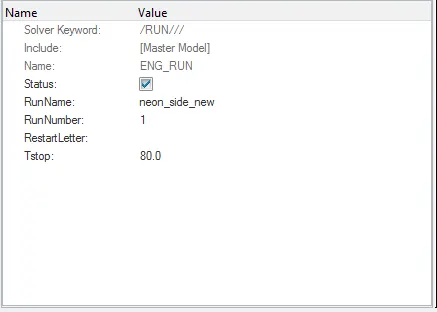
The time step is kept as 0.0005 ms and the total run time is kept as 80 ms.
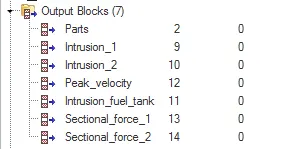
Outputs requests are given as follows:
- Sectional force in the cross member.
- Intrusion at B pillar,hinge pillar and fuel tank region.Provide recommendation on what can help to reduce Fuel tank intrusion.
- Peak velocity of inner node of the door.
RESULTS & OBSERVATION:
As the simulation is completed, the output files, 0000.rad, 0001.rad, 0000.out, 0001.out, the T01 file and the .h3d files are obtained.

Post processing is done using HyperView & HyperGraph to view the animation file & the plots.
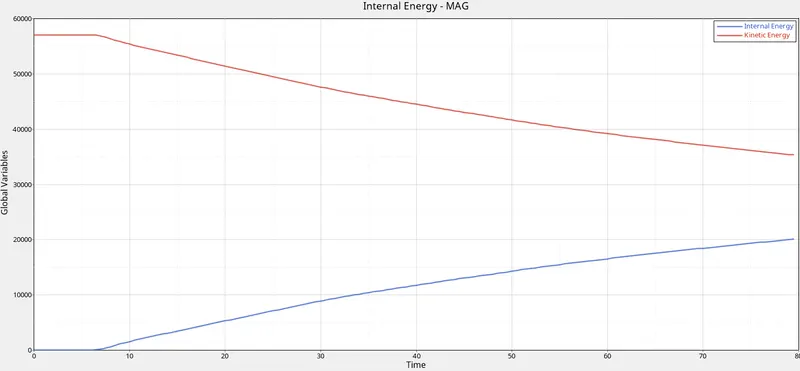
On seeing the internal & kinetic energy curves, the internal energy of the system is converted to kinetic energy as the analysis progresses.
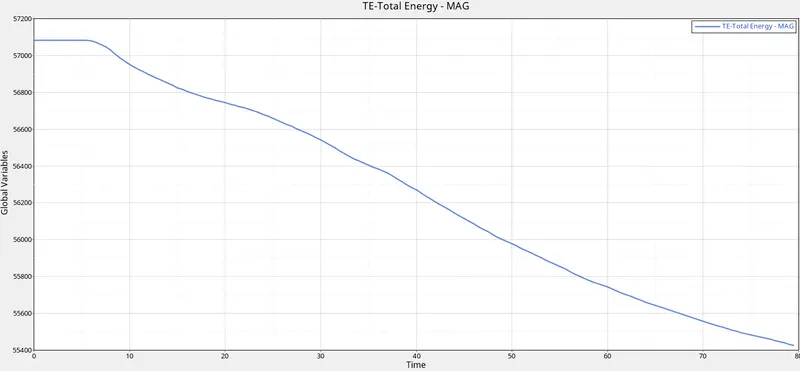
The total energy of the system can be seen decreasing as the analysis is performed. This is due to the crash happening between the pole and the car BiW.
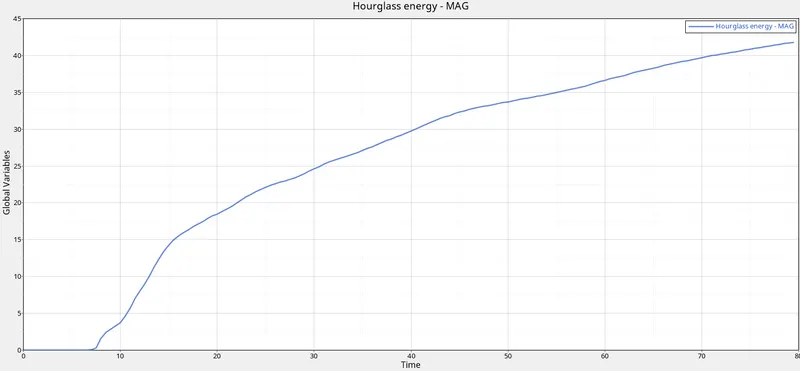
There is a small amount of hourglass energy which comes at a maximum of 42 J at the end of the analysis. This can be reduced by using fully integrated element formulation.
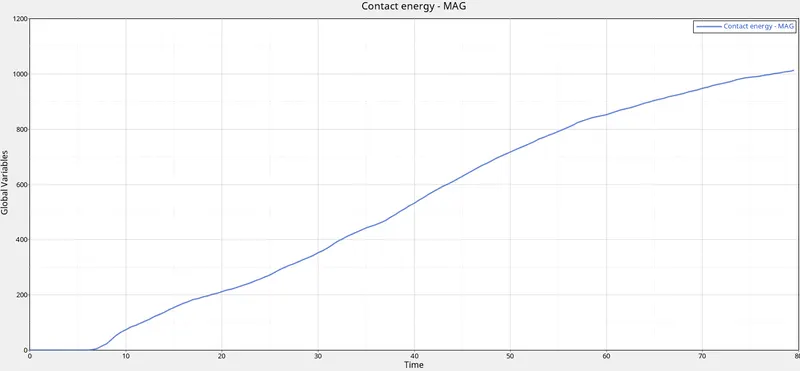
There is also a contact energy which reaches a maximum of 1000 J.
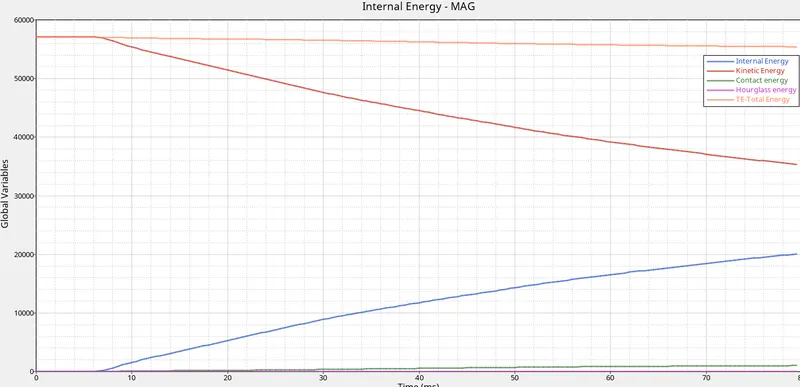
Having a look at the overall energy plot, we can say that the contact & hourglass energy are minimum and are negligible.
Sectional force in the cross members
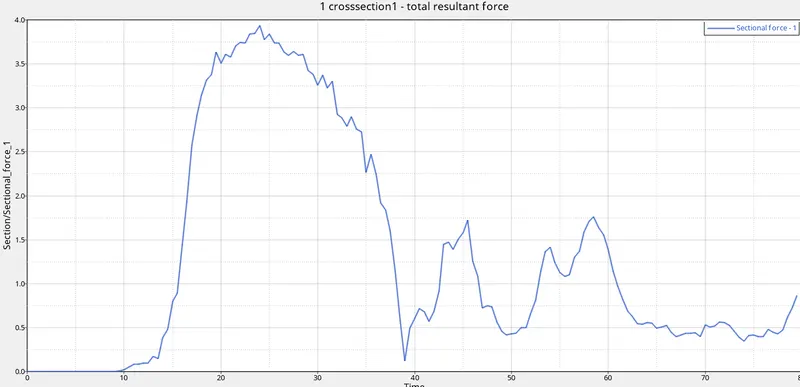
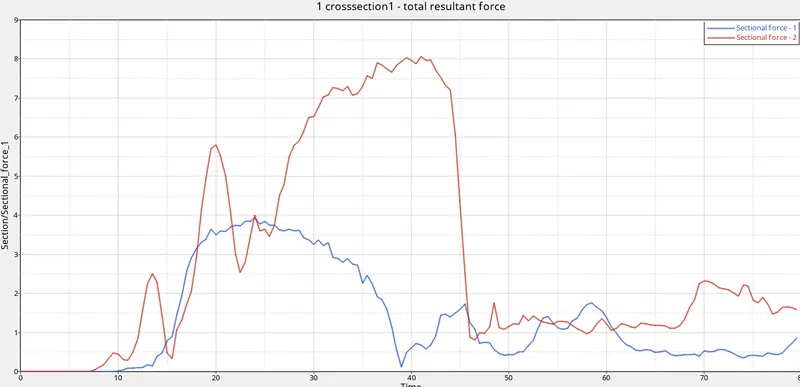
The sectional force starts to appear in the plot when the BiW comes in contact with the pole after 5th millisecond. There is a steep increase from the beginning. The sectional force experienced in the cross member reaches a maximum of 3.75 kN at the 24th millisecond. This force decreases after this point with time. The reason for a sudden increase is that the force exerted by the pole on the BiW is absorbed by the components.
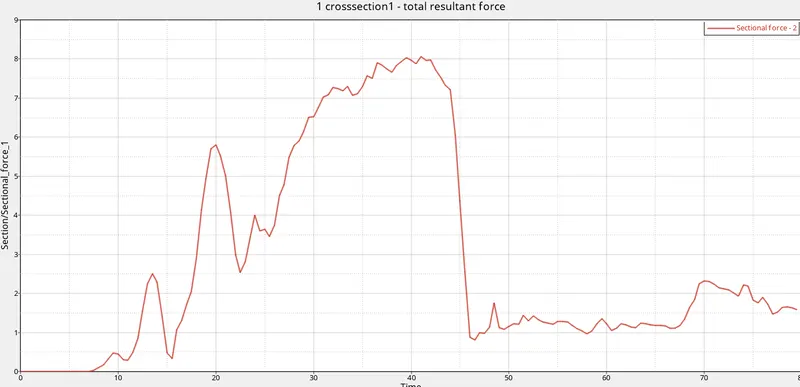
The sectional force starts to appear in the plot when the BiW comes in contact with the pole after 5th millisecond. There are a few peaks in the beginning. The sectional force reaches a maximum of 8 kN at the 40th millisecond. The force then decreases steeply after this point with time. Then there are average increase & decrease in the curve. The reason for a sudden increase is that the force exerted by the pole on the BiW is absorbed by the components.
Intrusion at B pillar
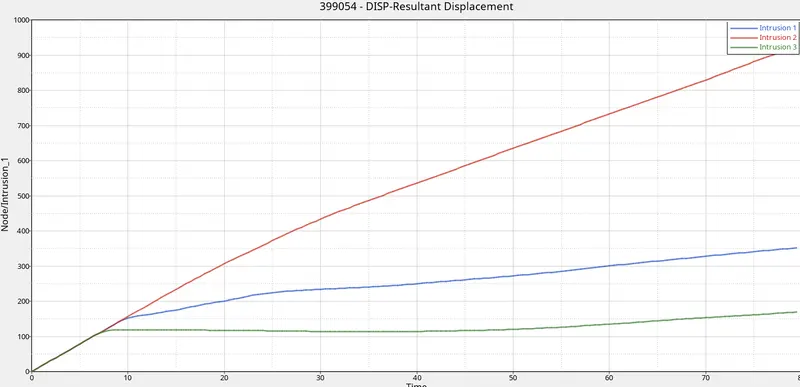
The intrusion is measured in the B pillar on the left & right hand sides. The following plot shows intrusion (resultant displacement) at the left hand side of the B pillar.
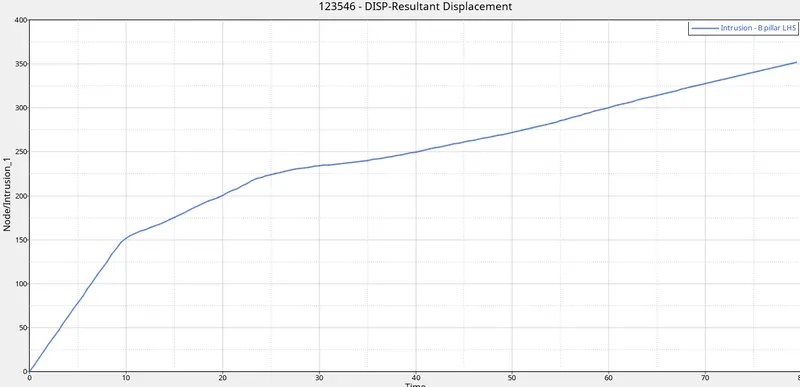
The maximum intrusion comes at 350 mm at the end of the analysis.
The following plot shows intrusion (resultant displacement) at the right hand side of the B pillar.
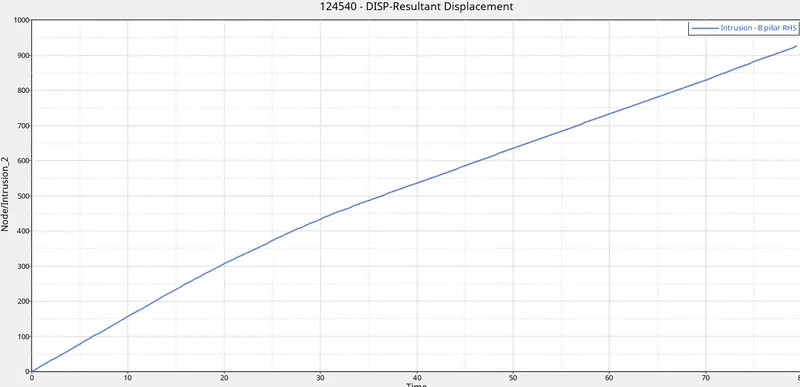
The maximum intrusion comes at 940 mm at the end of the analysis.
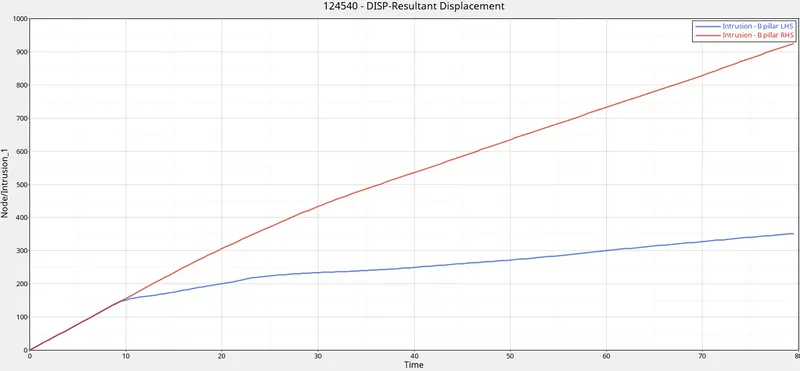
On comparing the intrusions on both sides, we can see the intrusion in the right hand side more than that of the left hand side.
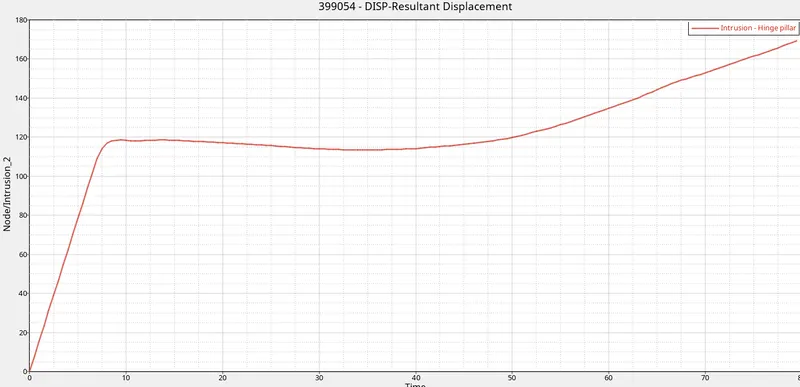
Intrusion at hinge pillar
Intrusion at fuel tank region
The intrusion at the fuel tank region is measured using a spring element. The elongation of the spring element is taken as the intrusion.
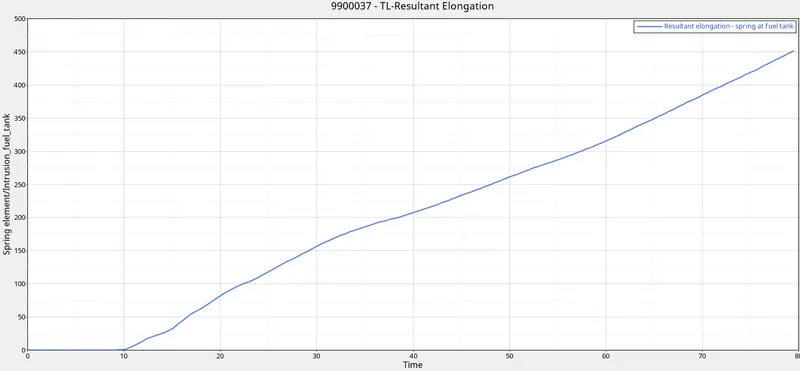
The intrusion curve starts a little after 5 ms when the BiW starts to crash with the pole. From then the curve has only increased. The maximum elongation is at 450 mm at the end of the analysis.
Peak velocity of inner node of the door (node 337773)
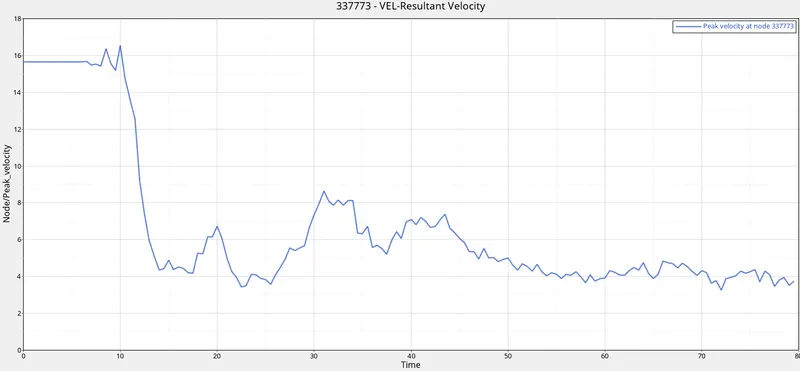
- The velocity of the node is constant at 15.6464 mm/ms from the beginning of the simulation. This is because of the initial velocity condition.
- When the crash starts, the velocity decreases. This shows the BiW component getting failed & crushed during the crash. It is absorbing energy from the crash.
- At the end of the analysis, the velocity averages around 4 mm/ms as most of the energy has been absorbed and the components have been deformed.
CONCLUSION:
From the above project, the side pole crash test has been performed on the neon BiW with all the relevant conditions & parameters. After the test was completed, the post processing is also done.