Assignment 7-Side Pole Crash Simulation Challenge
Assignment 7-Side Pole Crash Simulation
Aim: To perform the crash simulation on the side section of the car to study how the impact forces are distributed through the structure to prevent damage to the occupants.
Objective:
- Check unit system and either follow [mg mm s] or [kg mm ms].
- Create appropriate interface ,friction 0.2 and recommended parameters.
- Make sure of no penetration and intersections.
- Create rigid wall with friction 0.1 as per referance model.
- Compare the model weight with the referance model and use added masses to reach target weight 700kg while getting cg about the required range.
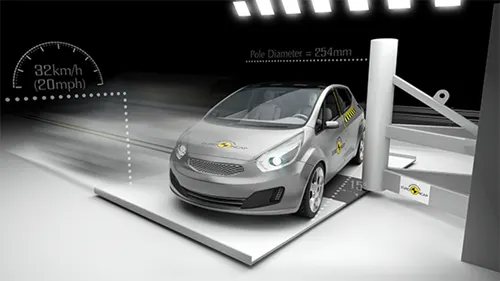
- Initial velocity as shown in picture.
- Use model checker to ensure good quality.
- Timestep :0.5 to 0.1 microseconds.
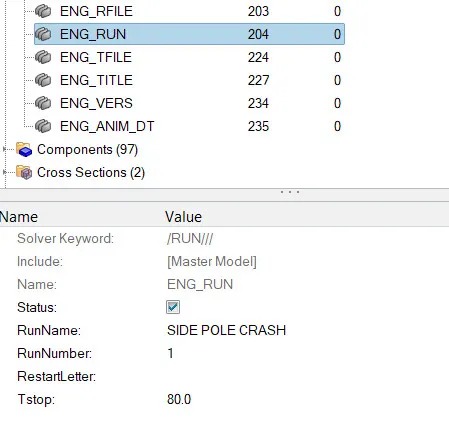
- Run 80ms.
Output requests:
- Sectional force in the cross member.
- The intrusion at b pillar,hinge pillar and fuel tank region. provide recommendation on what can help to reduce fuel tank intrusion.
- Peak velocity of inner node of the door.
Introduction :
In this project, we have to perform the side crash of the vehicle. Side impacts are the impacts undertaken against the solid side pole barrier with precise speed. The test requires the side portion of the vehicle to impact the pole barrier. in the new car assessment program (NCAP), passenger vehicles are crashed at 35 mph into a rigid barrier.
Procedure :
Objective 1: checking the unit system and following [kg mm ms ].
Step 1 _ open the starter file neon_front_000.rad file , goto menu bar >> file >>import >> solver deck >> select .rad file >> import .
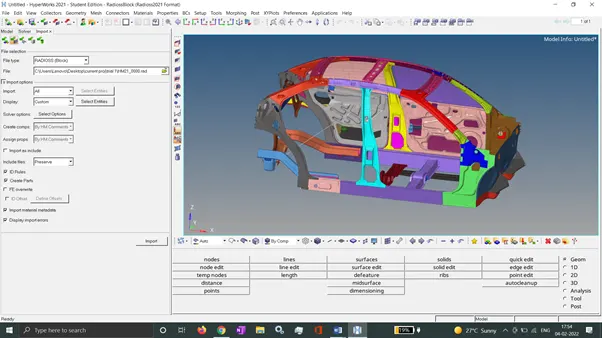
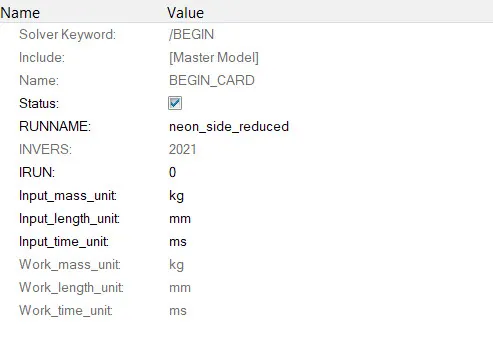
Step 2_ checking unit system of the model and set to [kg mm ms ] this can be done as shown below.
Model browser >> cards >> begin_card >> change the units in kg ,mm ,ms.
Objective 2: creating appropriate interfaces, friction 0.2 and recommended parameters.
Model browser >> group >> create group card as type 7 interface (select grnod_id and surf_id by component, this selects nodes as slave and surface as master).
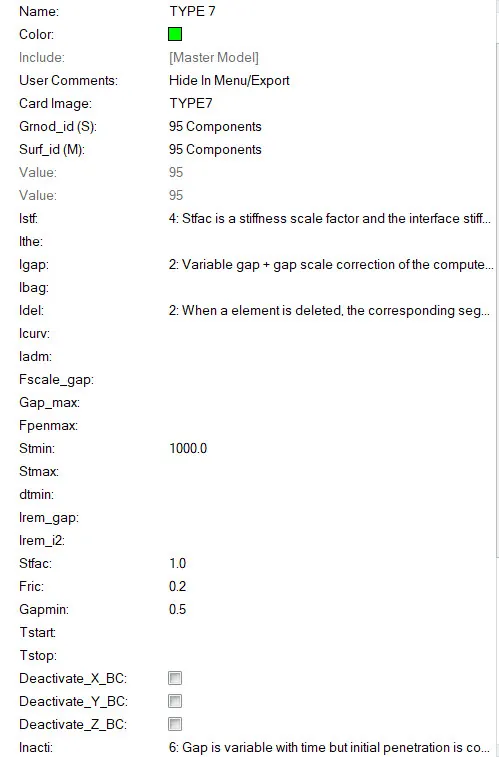
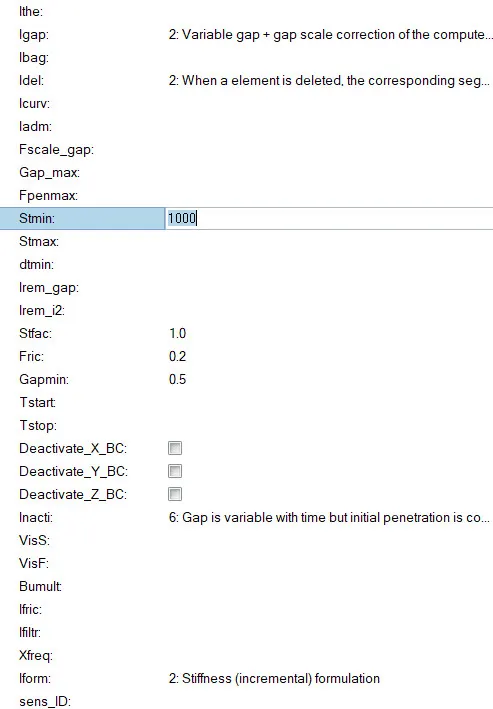
Input all the necessary parameters in this card as shown below.
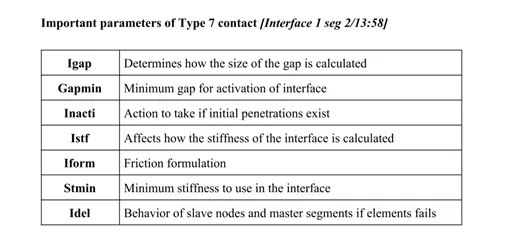
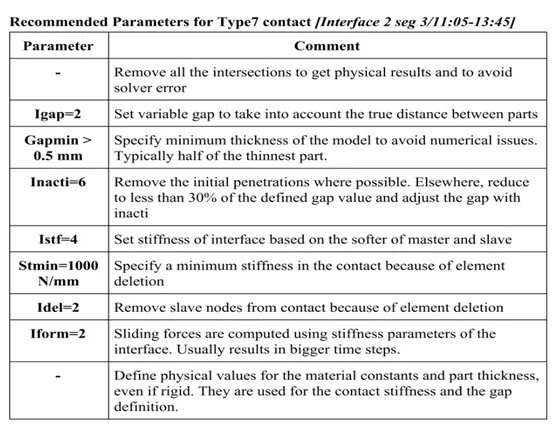
Objective 3: making sure of there should be no penetration and intersections
In manu bar >> tool >> penetration check >> select entity type as component >> in selection select all the components as shown in second image >> and click on checks.
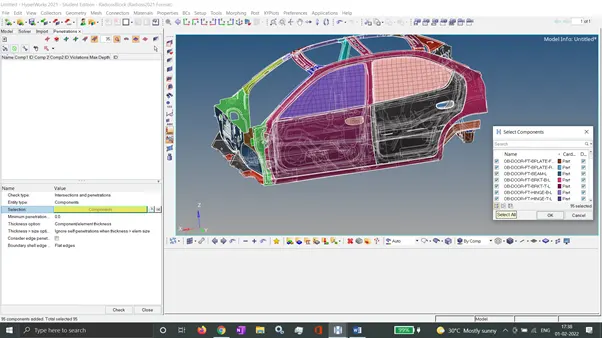
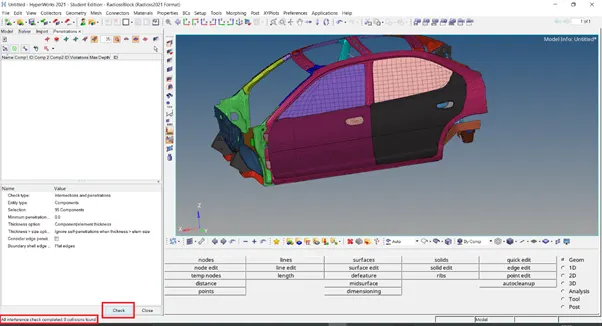
Objective 4: to create rigid wall with friction 0.1
For this project rwall wall be of cylindrical shape
To create a rigid wall goto solver browser >>right click >> create >> rwall >> cyl.
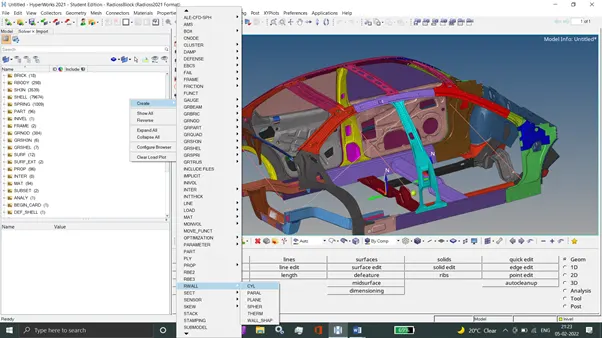
Once the card is been created we have to specify a point where we have to provide a rigid cylinder, provide normal direction in its below box by entering 1 in the respective direction box.
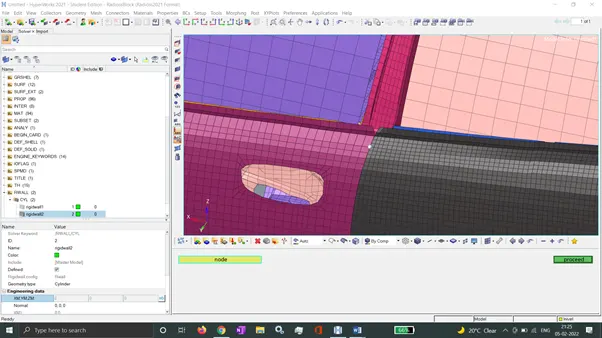
In this card main sections to be entered are dsearch , diameter of cylinder , friction, enter these values as shown below.
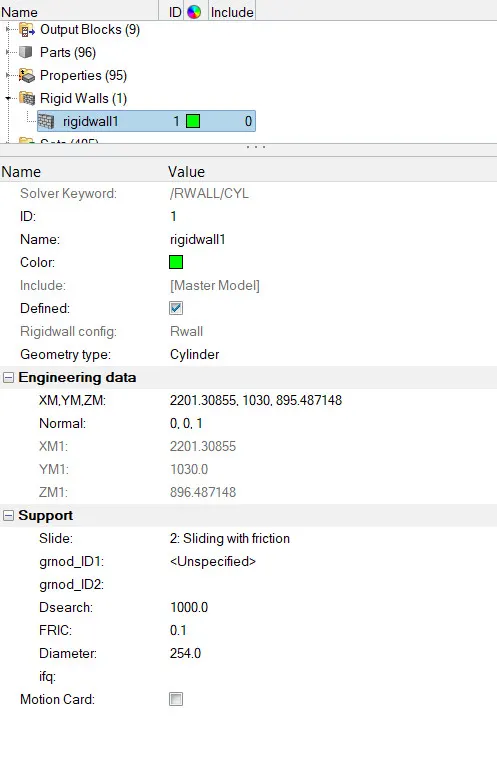
Once this is done it will show rwall cylinder , observe its position and keep this cylinder little bit away from the car body , this adjustment can be done from changing values in xm,ym,zm boxes ,finally defined rwall will appear as below
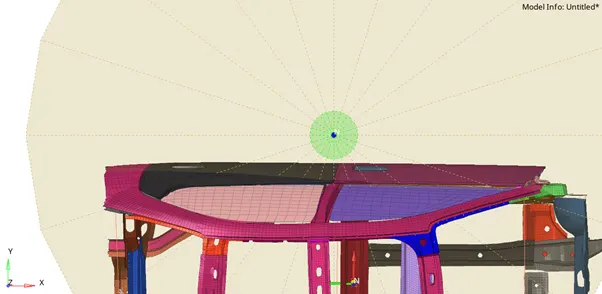
Objective 5: to compare the model wight with full scal 300k nodes model and use added masses to reach target weight 700 kg while getting cg about required range
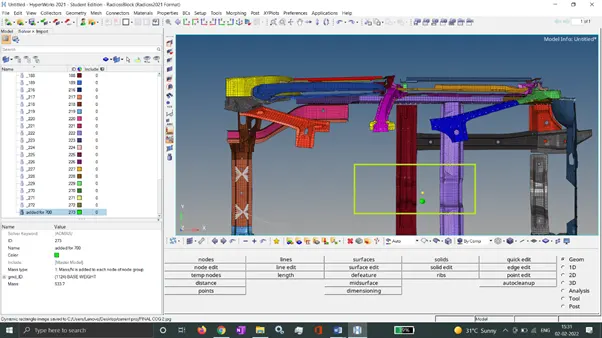
First we have to know about mass of model that is how much mass the model currently holds along with this we need to know about its cog as well to know this goto to>> mass details >> mass cog inertia.
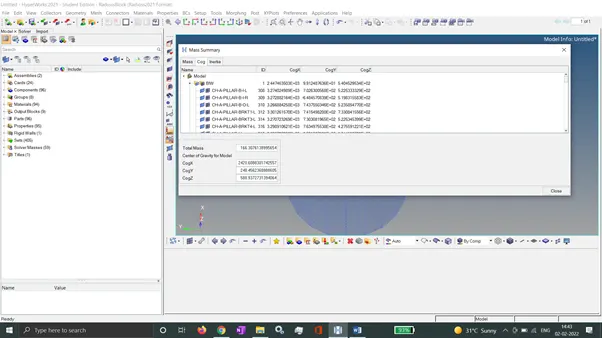
Here the model has some mass of around 166 kg already assign to it , now we have to add some mass to this model so that this model reach to 700 kg and we can get cog of the model to appropriate location.
Similarly we can know cog location of the model by clicking cog window near the mass window shows co ordinate of the current cog of the model by these co ordinate we can create a node from geometery >> node.
After checking this we can add mass in the model from solver >> create >> admas
Select mass type as mass added at each node of the node group. And select appropriate node on logical position.
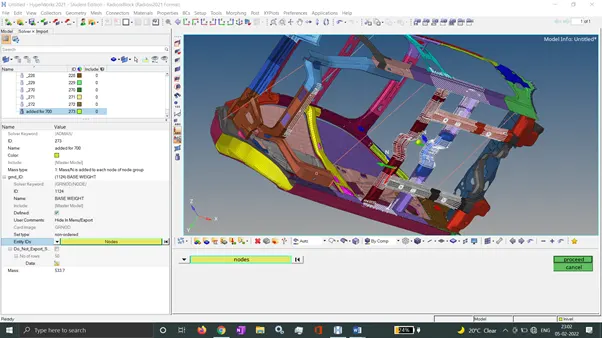
Once mass is been added it will show centre of mass , now we have to check cog of the model after weight is been added ,check the cog location and create a node at this location.
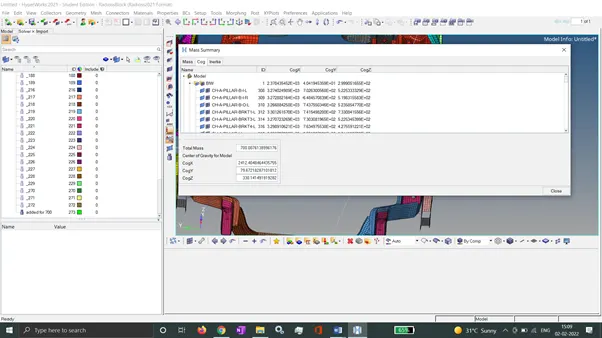
Objective 6: initial velocity of 35 mph
To apply initial velocity of 35 mph we need to first change its units as we are using kg mm ms unit system , to know about its equivalent value in mm/ms we have used consistent unit data as below.
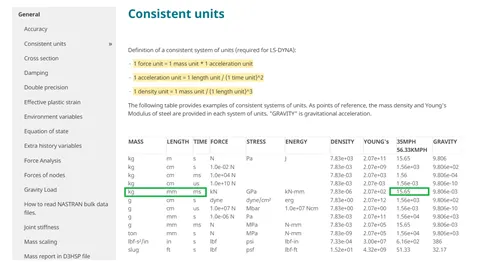
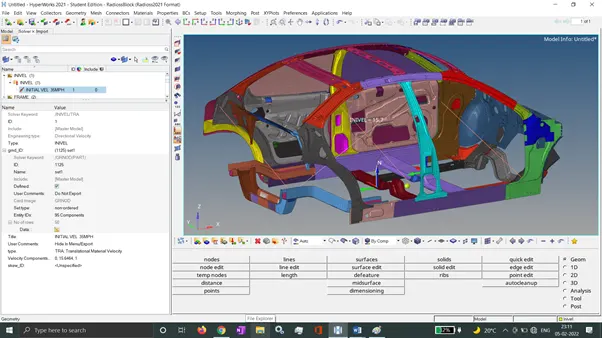
Now that we know its equivalent value we have to create invel card , to create it go to solver deck >> right click >> create >>boundary conditions>>invel.
The definition of invel card will be as shown below.
Objective 7: use model checker to ensure good quality
Model checker can be found in tool >> model checker >>radioss block>> after this run this by clicking on the highlighted option.
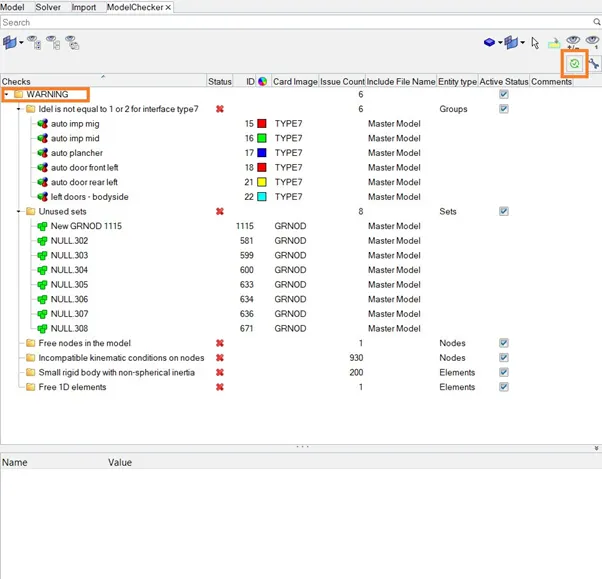
In this model we only found warnings and there are no errors so we can run this model
Objective 8: make time step 0.5 to 0.1 micro second
As time step is in micro second we have to change it to millisecond which comes out to be 5 ms
To enter this value go to model browser >> cards >>eng_anim_dt>>tfreq= 5.0.
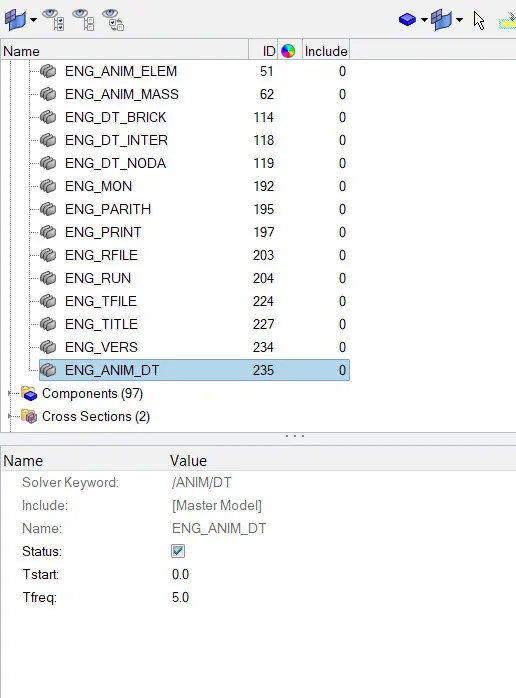
Objective 9: run the model with 80 ms
Model browser >>cards >>eng_run >>tstop = 80.
Output request :
Condition 1: sectional force in the cross member.
Here we have to find forces passing through cross members to do so we need to create an output request
To perform output request we have to follow the procedure that is for sectional force output request we need section to be created and for section we need frame
To create frame follow below procedure.
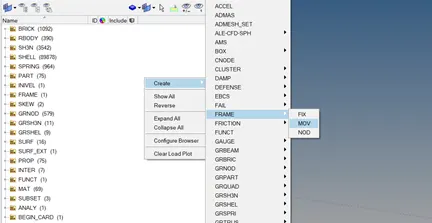
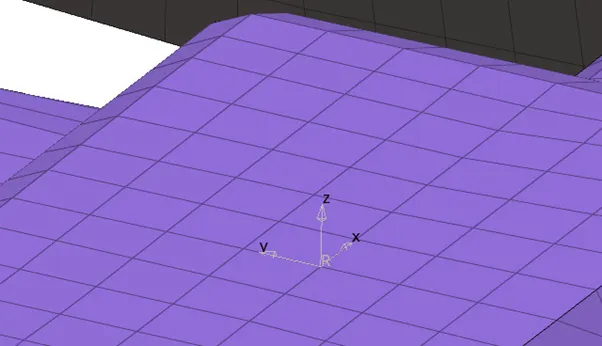
A frame panel will appear in that we have to choose three nodes to define frame these three nodes will be origin , node for x from origin & third node to define xy plane
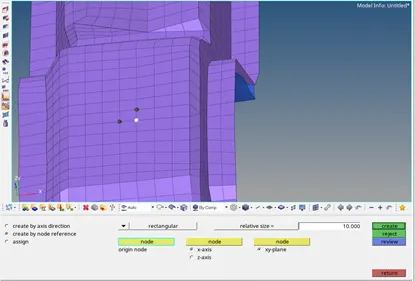
Once created frame will appear as below .
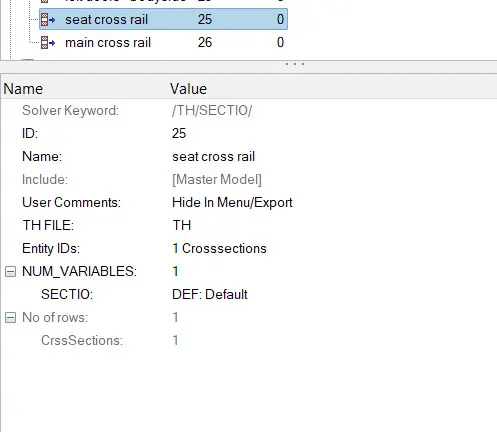
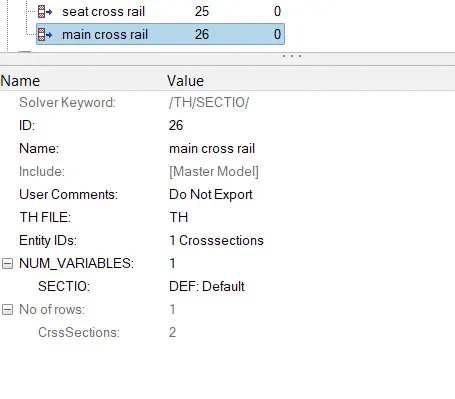
After frame has been done we can we have to create cross section for that go to solver browser create >> sect >> sect
This will brought a cross section property section ,here we have to select nodes for cross section to do so select node respective to n1,n2,n3 >> in sub panel click on node and pick node for respective node >> proceed
Now select frame for property for that click on system near frame >> in sub panel click on system >> pick the frame for system>> proceed.
The frame will be for reference of the section.
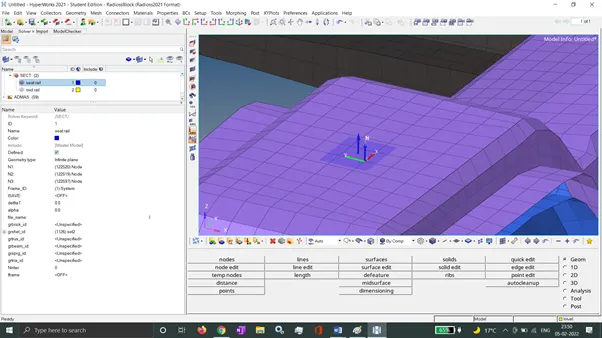
And in grshell id select appropriate elements as shown below.
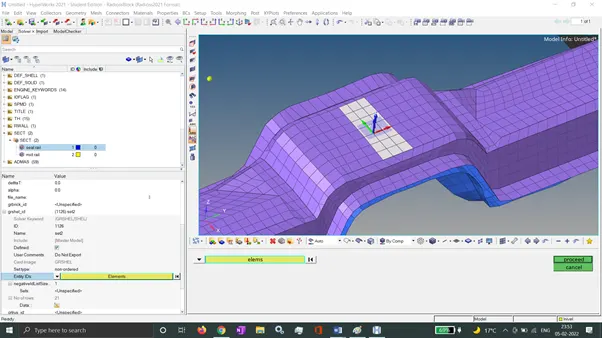
After element selection do proceed it will create section , similarly create section on another cross member.
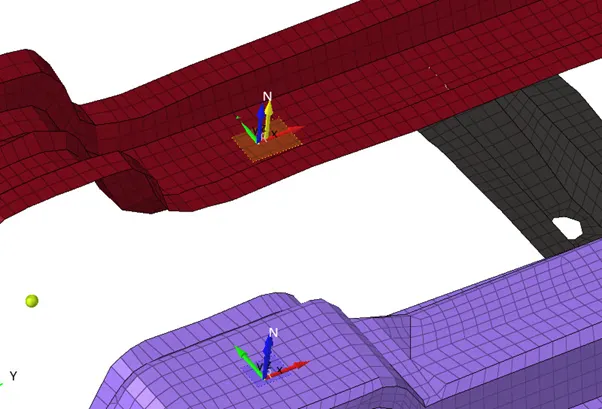
Once section creation is been done we need to create output request for both of them respectively
Condition 2: intrusion at b pillar,hinge pillar and fuel tank region.provide recommendation on what can help to reduce fuel tank intrusion
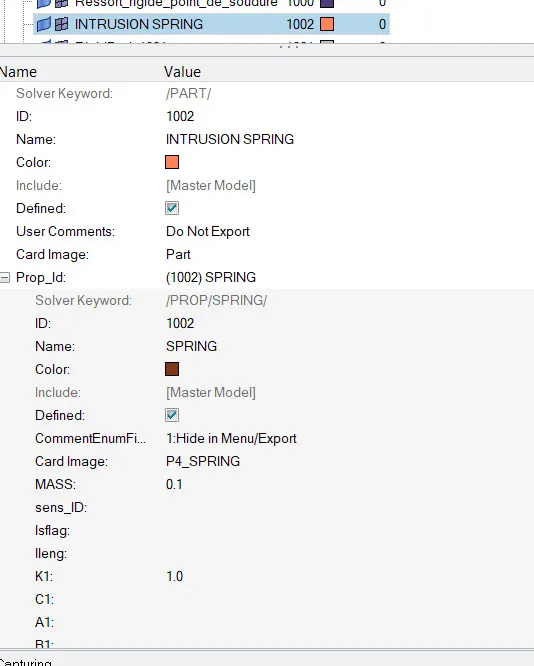
For any intrusion to make we need spring and for spring we need a component definition card , this component card requires property card assign to it
To do this we first create a new component by right-clicking on a component tree in the model browser, naming it as intrusion spring and assigning it property id as shown below.
After the creation of component is done ,next we make springs, to make spring goto subpanel >>1d >> spring >> select two node were we need spring to be created.

Note : while making spring make sure to make intrussion spring component as current component ,so that this property can be assign to spring element
Create element at the location b pillar , hinge pillar, and in fuel tank region as shown below.
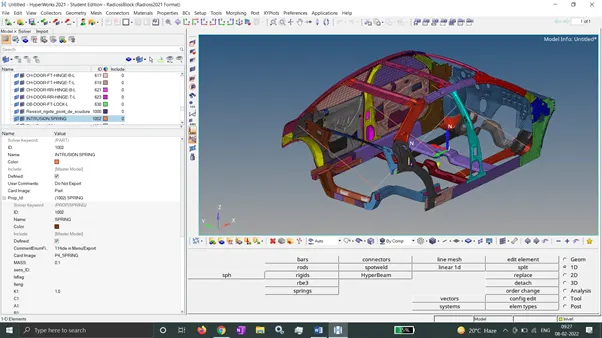
After this we need to create output request for each spring, in entity id use element as selection criteria , in keywords use spring as shown.
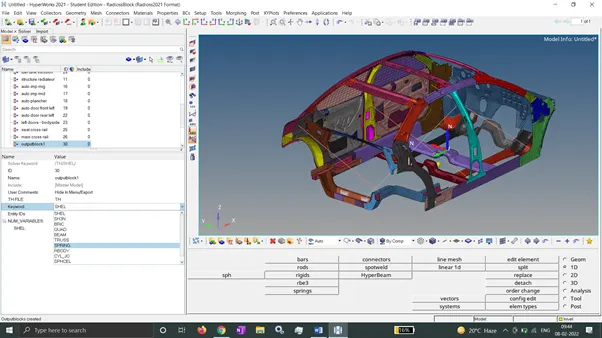
select springs individually for each output request.
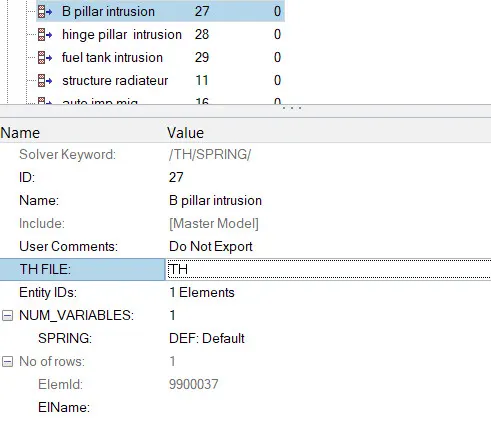
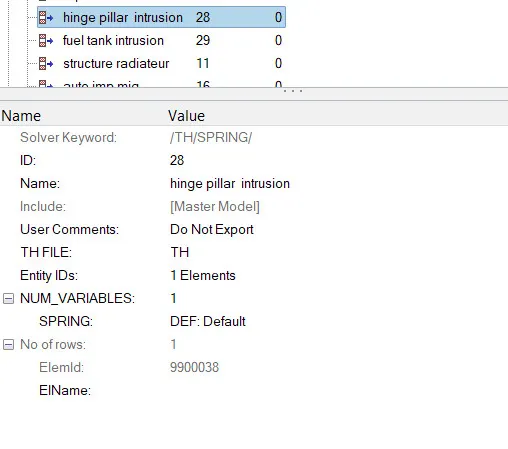
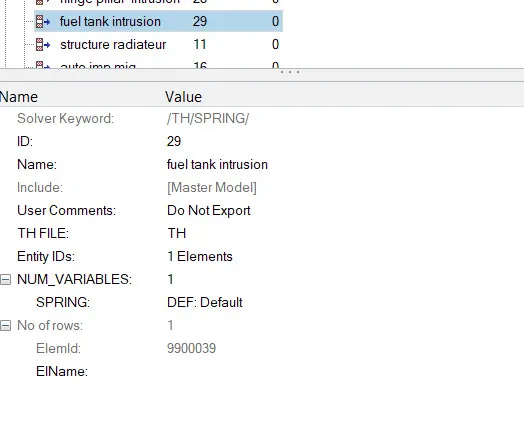
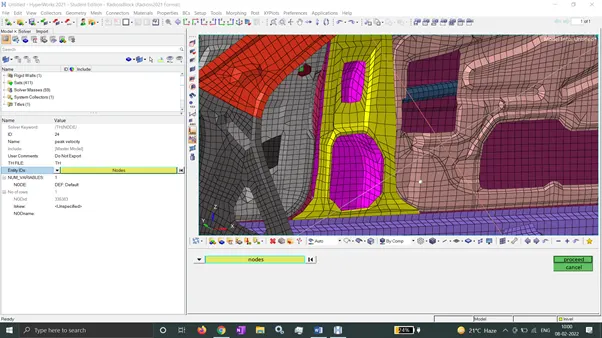
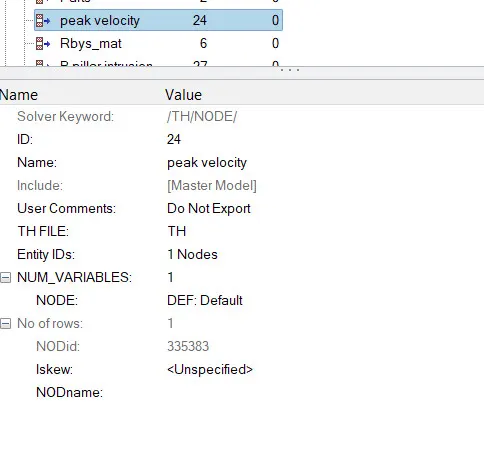
Condition 2: Peak velocity of inner node of the door.
This can be directly done with output request selecting any single inner node of the door.
Run the analysis :
Analysis >> radioss >> input file : (file location)-save as >> check the include connectors>>option: -nt 4>> hit radioss.

Review the simulation
The tool to review the simulation are available on hyper view
Hyperview is a post-processing and visualization environment for fea that gives the output of analysis in the simulations format that is user friendly to understand
From the simulation, we can review how the impact force acts and cause deformation and point of rupture on the model.
We have to import the animation file in hyperview
Hyperview>>first_run.h3d>> appy.
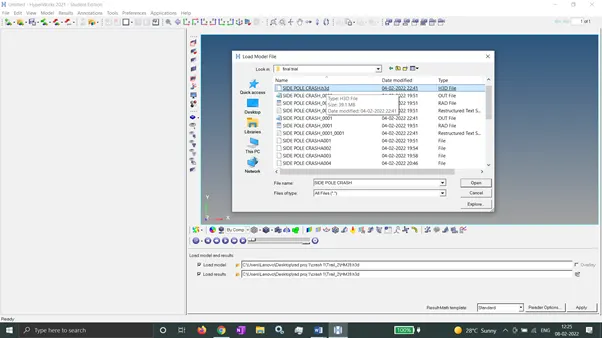
After this model will be appear in the hyperview environment

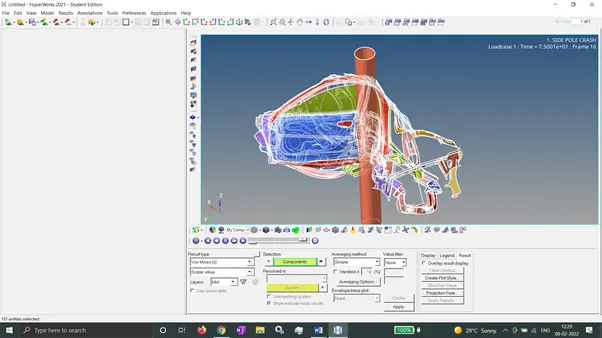

After this it will show the animation of the simulation as below.
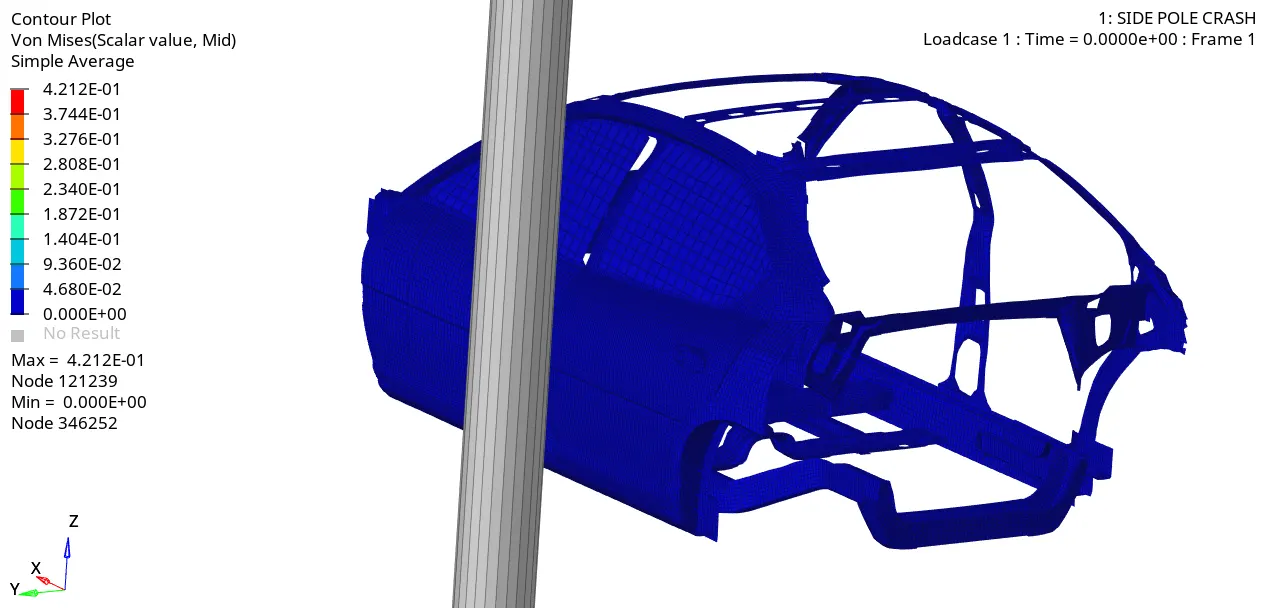
From the simulation, we can see that initially, the car is hitting the r-wall cylinder with a velocity of 15.64m/s while hitting the first impact is with b-pillar then the forces going to transferred to the left and right and front direction in the roof rail and cross member in the bottom as shown in below figure here in each stage the forces going to reduce because of energy observed.
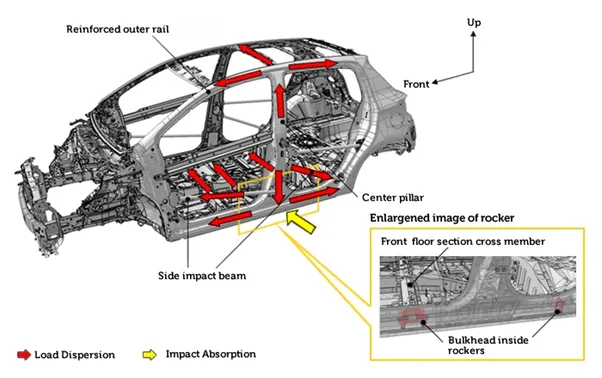
How the forces are transferred is shown in the above figure:
Results after simulation:
1) energy and mass error:
- At the end of the simulation, do the energy error and mass error checks and determine whether results would be acceptable
- Open the save location file and click on the output file of the simulation to check for the energy error and mass error.
- If the error is negative, it means that some energy has been dissipated.
- In the case of under-integrated elements (belytschko shells, solids with 1 integration point), the hourglass energy can explain a negative energy error
- Since it is not counted in the energy balance. The normal amount of hourglass energy is about 10% to 15%.
- If the error is positive, there is an energy creation.
- In the case of using qeph shell formulation or fully integrated elements, the energy error can be slightly positive since there is no hourglass energy and the computation is much more accurate. An error of 1% or 2% will be acceptable.
- In the case of a larger positive energy, the source of this energy has to be identified. Incompatible kinematic conditions can lead to such a situation.
- If the error reaches :99%, the computation has diverged; except in the first cycle of a run for which the initial energy of the system was null so that a relatively false energy balance often introduces large relative error.
After simulation run
Check the starter output file for errors:
- A starter output file of out format is generated after analysis.
- The output file contains the data during simulation, such as cycle, timestep, energies, and errors.
- We have to check for energy and mass error which means that the solver did not need to add mass onto the nodes to reduce the timestep to further avoid the hourglass error.
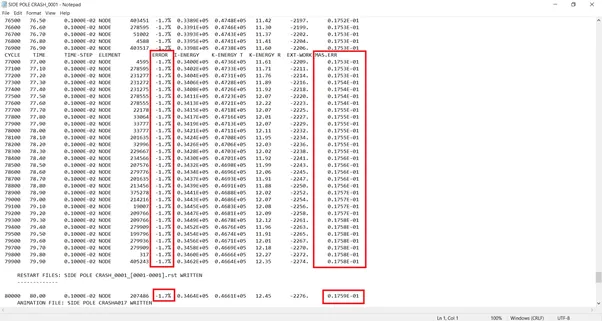
Observation :
The energy error is negative and has been linearly increasing upto
-1.7% only which is acceptable.
Mass error is 0.1759e-01 which is acceptable
We can conclude that there are no errors in the analysis.
Plot the graph & compare the results
Hypergraph 2d >>data file : t01 file >>choose the graph which you want as shown in below picture >> apply.
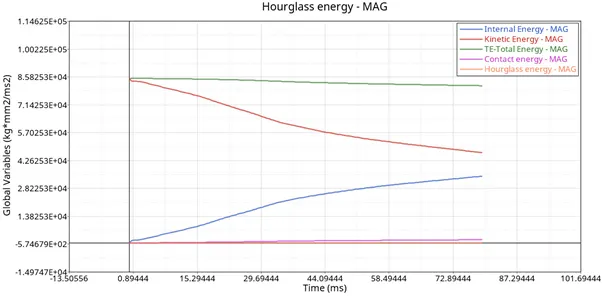
The internal energy and kinematic energy :
Internal energy is nothing but the heat of the system and energy that component has absorbed . When the kinematic energy is decreases, the energy absorbed by the system increases i.e we all know that energy nirtether be created nor be destroyed . Once the vehicle is moving with certain velocity (15.646 mm/ms for the model ),the initial kinetic energy will be high (refer to above graph ). Once the car is hit by the rigid wall , the vehice starts deforming results in absorbing the energy and stored it . Thus, internal energy starts increasing at the maximum deformation, the velocity will become zero and thus the kinetic energy will also be dropping down to zero resulting there is no energy to absorb in the system . Thus , the internal energy remains constant therafter
Once after the simulation , the maximum kinetic energy is found at t=0 ms is 84956.88 kn/mm and minimum at t=79.5 ms is 46735.144 kn/mm
For internal energy at t=0 ms is 0.0 kn /mm and at t=79.5 ms is 34537.156 kn/mm
Contact energy and hourglass energy
From the above graph,we can see that the hourglass energy is almost negligible since we have used improved integrated element formation (qeph)
Ideally, all of kE should be converted into IE and the total energy must remain constant, but in our case, since we have hourglass energy error, our total energy is decreasing. We can rectify this hourglass energy by further reducing the timestep of the simulation and giving the ideal properties wherever we can. Our requirement from an ideal simulation is that we have minimal contact energy and maximum energy absorption/deformation in the elements. We can check the energy error in the engine output file, which has maxed out at -1.7 % which is within the limits for it to be. Our mass error is also 0.1759e-01 which means that the solver did not need to add mass onto the nodes to reduce the timestep to further avoid the hourglass error.
Contact energy is nothing but the opposite energy generated from the system to avoid penetration. To avoid penetration, we have determined the gap min value to 0.5. When the car is moving with a velocity of 35mph and hits the rigid wall, it starts deformation at the bumper section and hence the penetration of the elements occurs and thus the opposite reaction force also exerted in order to avoid the penetration. Hence the contact energy increases gradually from zero. The maximum contact energy found is 1677.25 kn/mm at t-79.5ms.
Peak velocity:
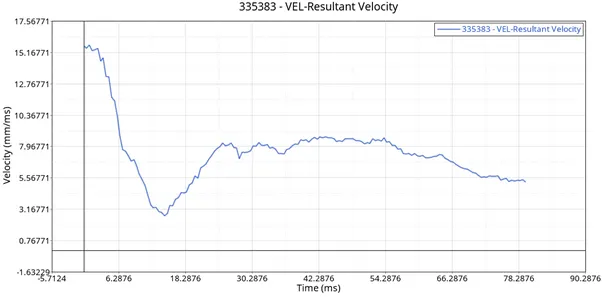
As we all know that when the car hits the pole first impact will be the door and due to the deformation, the inner portion of the door might hit the passengers inside the car and lead to injuries. Hence it is important that the peak velocity at the door region is to be calculated.
From the graph, the peak velocity of the node on the door is 15.64 m/s. As we seen from above graph there is fluctuations in the shock waves this is because of vibration that occurred during the crash of the vehicle.
Intrusion springs:
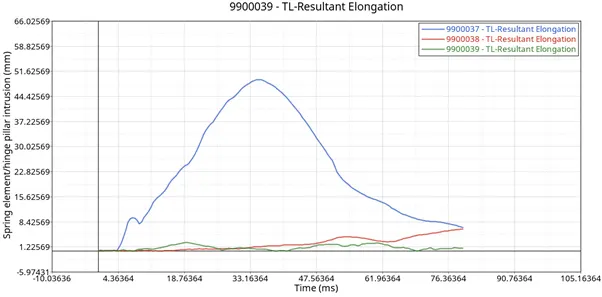
Intrusions are one of the important parameters while checking passenger safety in crashes. To know the intrusions at the b-pillar, fuel tank, and hinge pillar we have placed a spring in these particular regions of the b-pillar, fuel tank and hinge pillar from this we can see the intrusion at that particular region and we can also understand how much intrusion is happened in these regions. Here in this graph, we can see that the b pillar has the maximum intrusion, then come to the hinge pillar and the least intrusion is seen at the fuel tank region. Here the blue curve indicates the b-pillar intrusion, red indicates the hinge pillar intrusion, and the last green indicates the fuel tank intrusion.
Here at the b-pillar, the spring elongation of 49.25 mm. The b-pillar touches the rigid pole and the other side is crushed towards it, so its intrusion is so high. For the fuel tank, the spring elongation is 2.52 mm and for the hinge pillar, it shows an elongation of 6.65 mm.
Due to the node limitation in the software, we don't have the full-scale model and many missed components like the rear axle, fuel tank, etc. But in real condition, the rear axle, wheels, and the fuel tank give much more stiffness to the car and this might help to reduce the intrusion in a good manner. To reduce the intrusion in this model we can add one cross member near to the fuel tank region
Cross-sections:
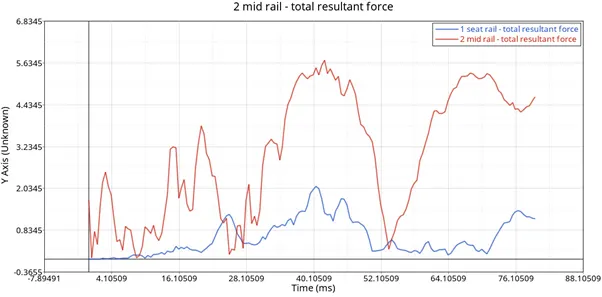
The cross members are the parts that transfer the force from one side to another side when the impact occurs.
The max section force at the mid rail is 5.70 kn and for the driver cross member is 2.10 kn.
When the car hits the rigid pole, the force is transferred from the b pillar to cross members and then to the other side. In the above graph, we can see a rise in curves this is due to the force acting on the cross members. Due to this force the cross members get bent, and the force passing through the cross members get reduced that is why we see the drop in resultant force in the graph. Even though it drops, it won't come to zero.
Learning outcome
- Learned how to set up a side crash test.
- Learned how the rigid wall interface works and can lead to incompatible kinematic conditions.
- Learned how sectional forces are generated.
- Learned how the distribution of forces among the components during a side crash.
- Learned how some components are designed to deform in such a way to ensure the safety of the passengers inside the cabin.
- Learned how to check for energy, mass, and momentum balance.
- Learned how to debugging errors in order to get the right results.
- Learned how to place a node to see his peak velocity.
Conclusion:
The given model was simulated for the side crash using radioss and the results obtained were validated. The graphical results were plotted for all the test cases. From the simulation, it can be observed that there was maximum deformation in the cabin, and also maximum intrusion was found in the cabin area. This is due to the limited number of nodes in the student version some of the biw, engine blocks, suspension system, etc are removed, so the results are not as in real condition. After understanding these we will get to know what all things we should do on this car to make it safer. For example to decrease the amount of intrusion in the fuel tank region we can introduce a cross member there.