Side Pole Crash Simulation on NEON Car Model
Aim-
- To perform the side pole crash analysis on the Neon car model and study about deformation and stresses developed and energy distribution in the car components.
Objective-
- First to check the unit system.
- Create type-7 contact with friction value 0.2 with recommended parameters.
- To check for penetration and intersections in the model if present.
- Check for the rigid body if any means make sure all components are connected properly.
- Create a planer rigid wall with a 0.1 friction value.
- Add mass on the given body to reach the target of 700kg and make COG align approximately with the seat rail.
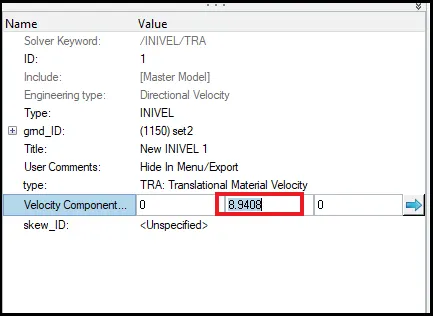
- Give an initial velocity of 20mph(mile per hour) which is 8.9408 m/s in the x-direction.
- Give time step of 0.0001 for Brick Noda and Inter.
- Give the run time of 80 ms in the run card.
Request for additional TH output-
- Sectional force in the cross member.
- The intrusion at B pillar, hinge pillar, and fuel tank region.
- Peak velocity of the inner node of the door.
Theory-
A crash test is a virtual reconstruction that replicates the same force and speed that would occur if the vehicle was to be involved in an actual crash. In this type of testing, since nothing is physically impacting the body-in-white (BIW), no physical deformation or damage occurs to the body's structure, allowing multiple crashworthiness tests to conduct in succession.
- Frontal crash test.
- Side pole impact crash test.
- Roof crash test.
Since in the side crash test, there are multiple standards used on which we have to focus.
FMVSS 214-
- This Final Regulatory Impact Analysis analyzes the potential impacts of new performance requirements and test procedures for head and thorax protection systems in side crashes. The rule requires a new 20 mph,75-degree oblique pole test run in two different
- Benefits-The agency estimates benefits for occupants in outboard seating positions in near-side crashes of 12-25 mph delta-V in vehicle-to-pole and vehicle-to-vehicle crashes.
- The agency has also found that the side airbags provide benefits to unbelted far-side occupants in side impacts and for belted drivers riding alone in the front seat.
Euro NCAP-
- In Euro NCAP’s test, a car is propelled sideways at 32 km/h against a rigid, narrow pole. The car is placed at right angles to the direction of motion, at a small angle away from the perpendicular.
- Where a vehicle is equipped with a center airbag to protect against the front seat occupants hitting each other, two average male side impact dummies are placed in the front seats. Where there is no center airbag, a single dummy is placed on the driver’s seat.
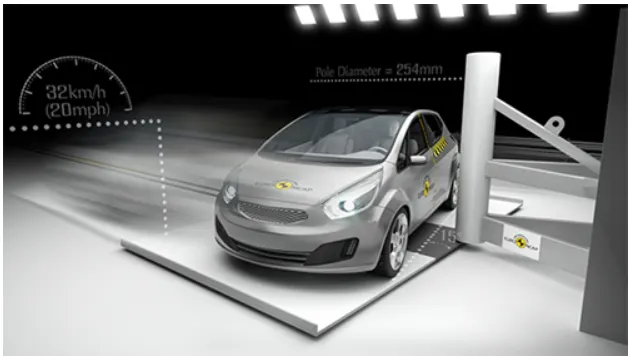
- This is a very severe test of a car’s ability to protect the driver’s head. As the loading on the car is so localized, deformation can be very high and the pole can penetrate deeply into the passenger compartment.
- Some side impacts involve a vehicle traveling sideways into rigid roadside objects such as trees or poles. Often this is the result of a loss of control on the part of the driver, owing to speeding, misjudgment of a corner, or because of a skid in slippery conditions.
Procedure:
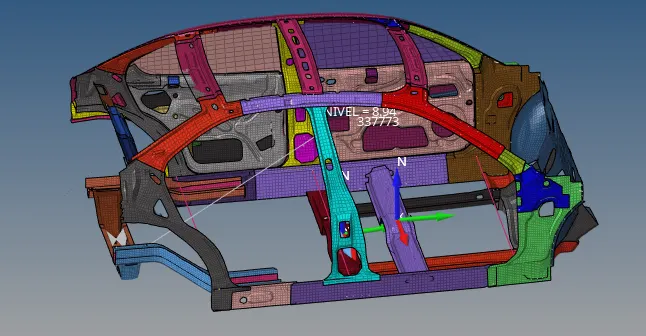
1. Import the model in hypermesh.
- Go to File> import>Import solver deck> select the file from the folder.
- Or, we can drag down(by shift+right click) the 0000.rad file and release on hypermesh GUI.
 |
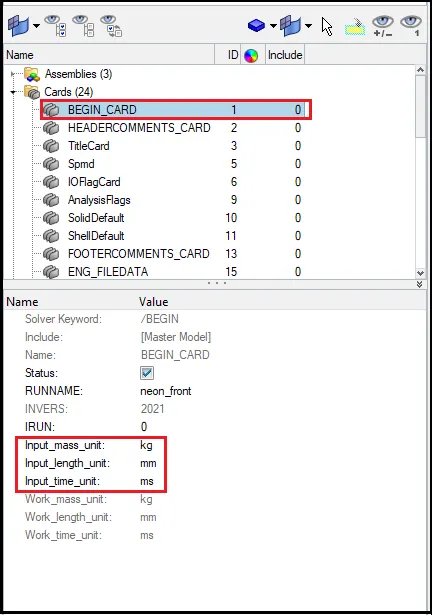
2. Check for units in Hypermeh:
Hypermesh
Go to Solver>cards>Begin card
3. Create type-7 interface contact with friction value as 0.2.
Go to create > INTER > Type-7
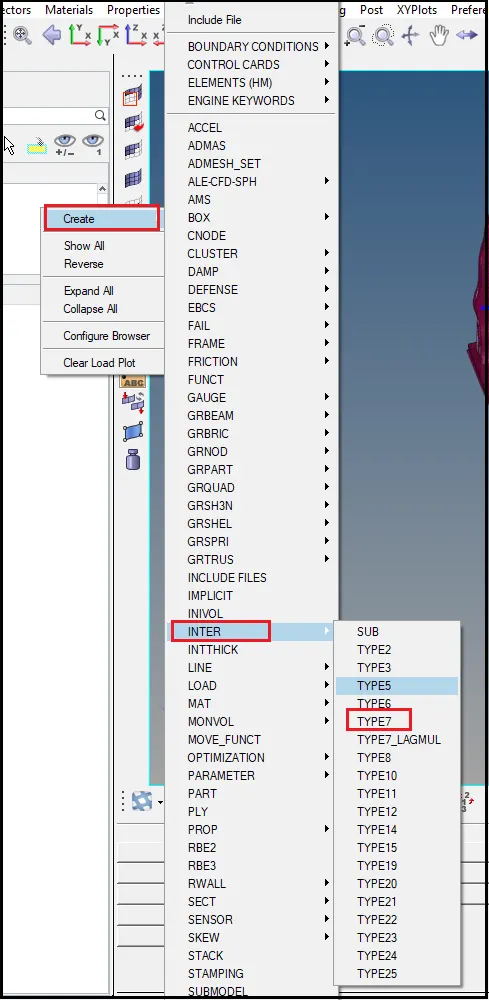
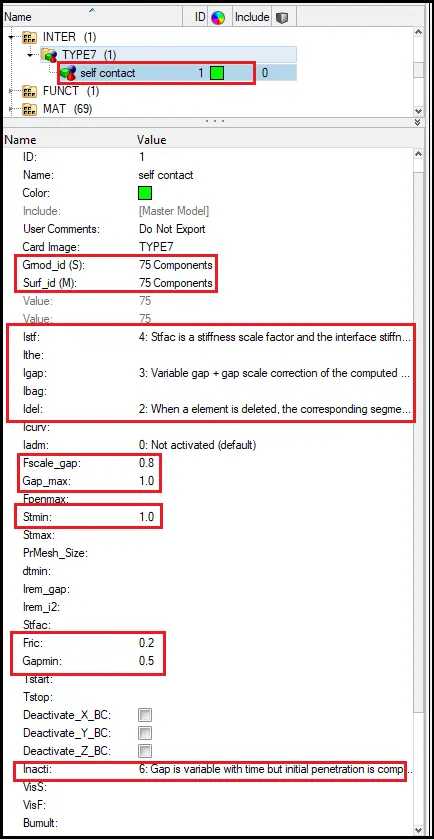
- Select all the recommended parameters for Type-7 contact.
- Select all the components in slave and master as well to give self contact.
4. Check for initial penetration and intersection.
- Here we will check for initial penetration in the model.
For that go to tool > Penetration check > Select group > Check
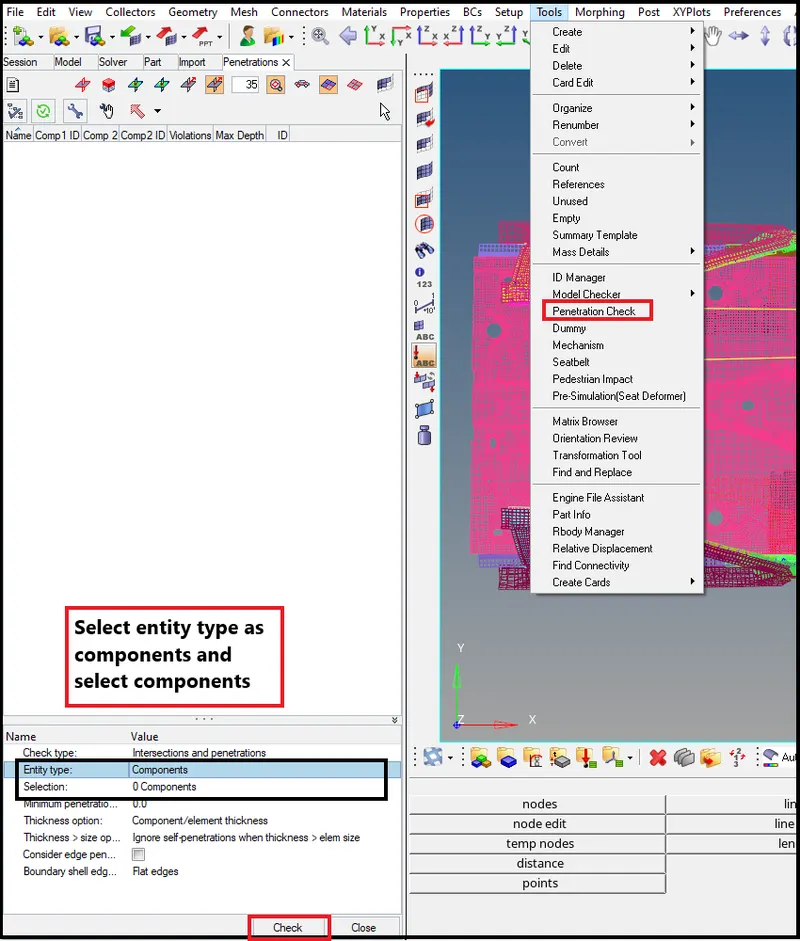
- After selecting, groups, hit on check it will show the result below.
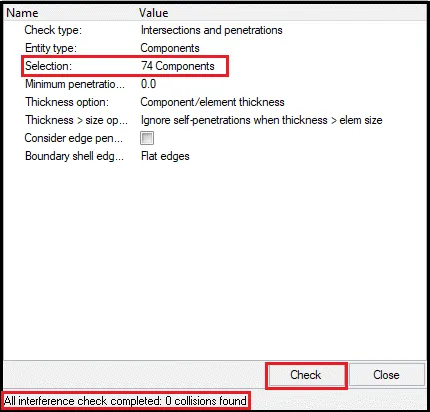
- Here we can see that 0 collisions were found.
5. Create an Infinite cylindrical rigid wall with friction 0.1.
Go to Create > RWall > CYL
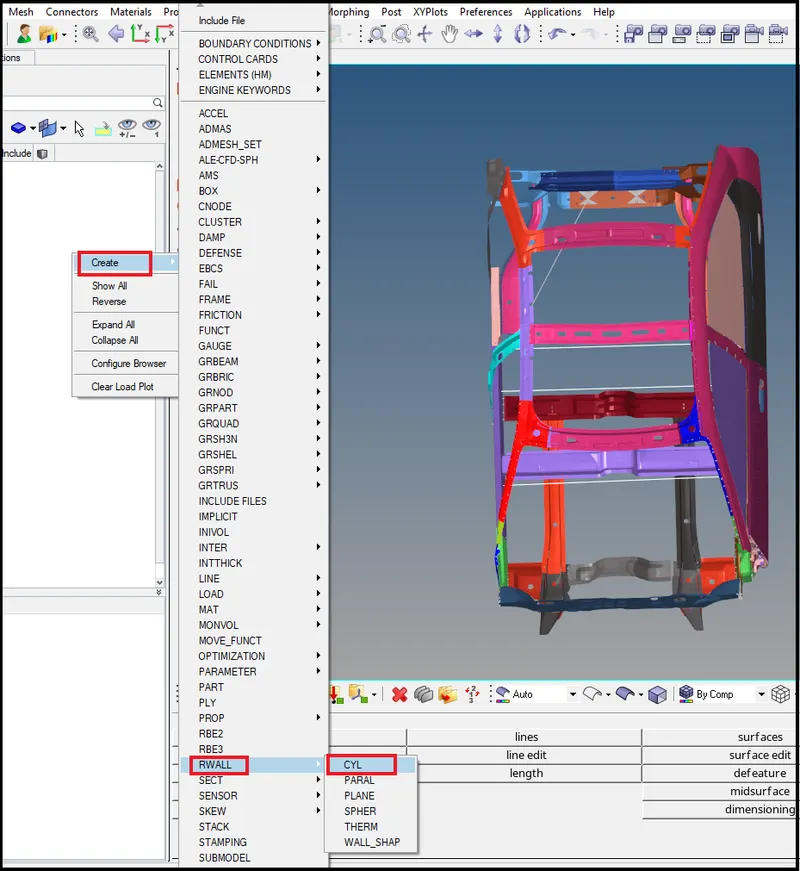
Now create a rigid wall card,
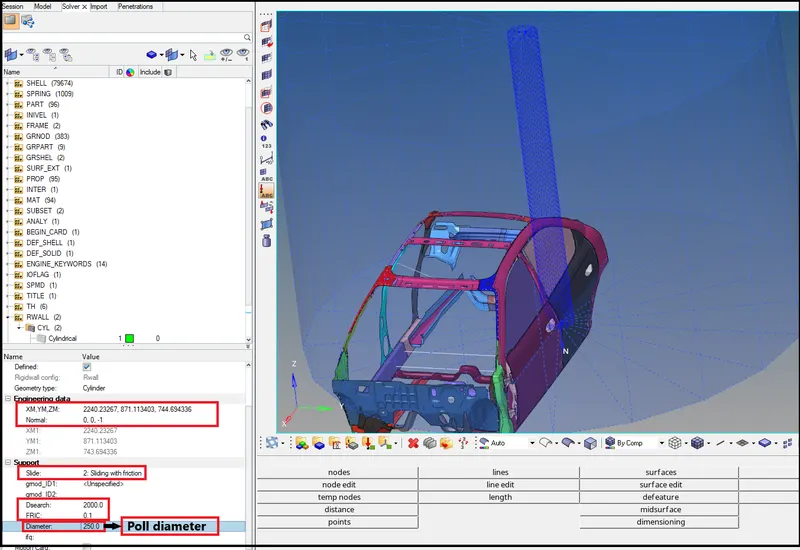
- Select a point on the car body, coordinates will get displayed.
- Normal value to define the z-axis of the pole and it will give normal of the pole.
- Give sliding friction as 0.1 and D search value like 2000 to cover the whole car body.
- Since we can see that pole is intersecting so now we will change the coordinates to move it at some distance from there.
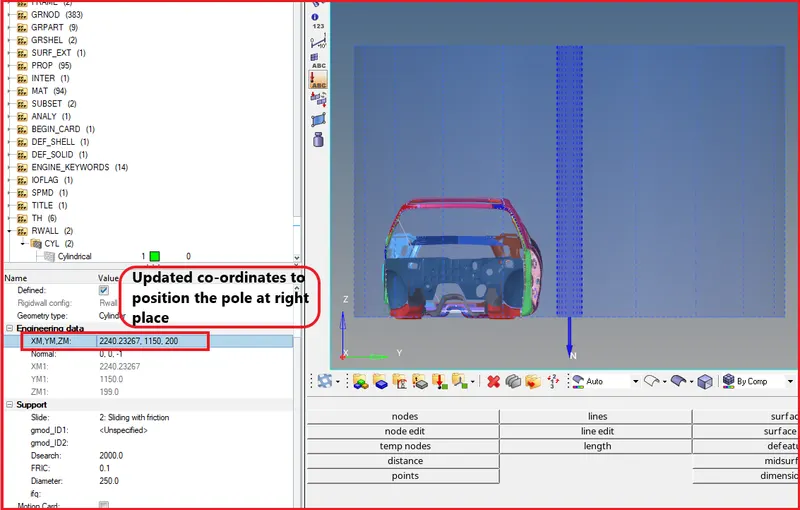
- Infinite cylindrical Rigid wall created now.
6. Perform mass balancing in hypermesh.
- For mass balancing first, we will check the initial mass of the model for that,
- Go to Tools > Mass details > Mass, It will show the initial mass as shown below as 188.4 kg.
- To reach the mass value of 700kg we need to add 511.6 kg mass more.
- For mass addition, we will use the ADMAS option.
For Add mass
Go to Solver Browser > Create > ADMAS
- We will choose type-1, which will distribute the mass over the nodes which we give as shown below.
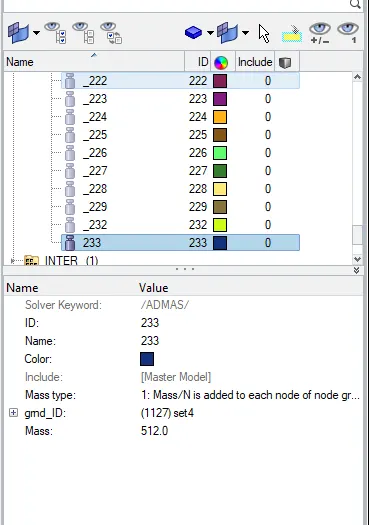
- Similarly, we will add mass over the floor panel to reach 700kg mass.
- And to place COG at the right place on the rail.
- Now we can see the COG location and target mass as 700 kg.
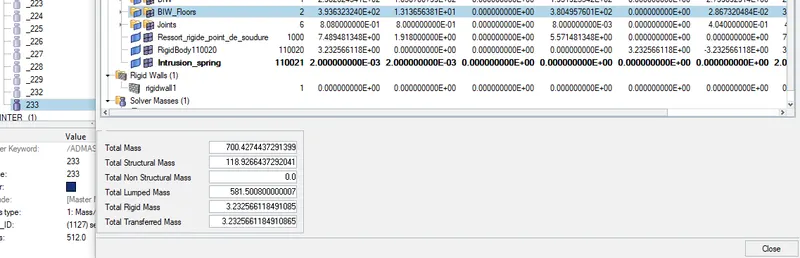
7. Give an initial velocity of 20mph(mile per hour) or 8.9408 m/s
Create > Boundary condition > INVEL
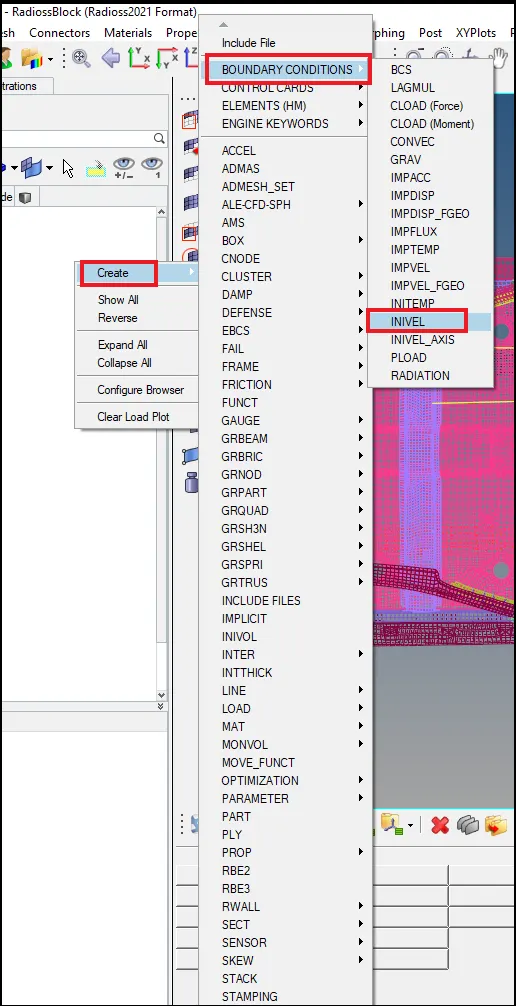
Now create INIVEL card here,
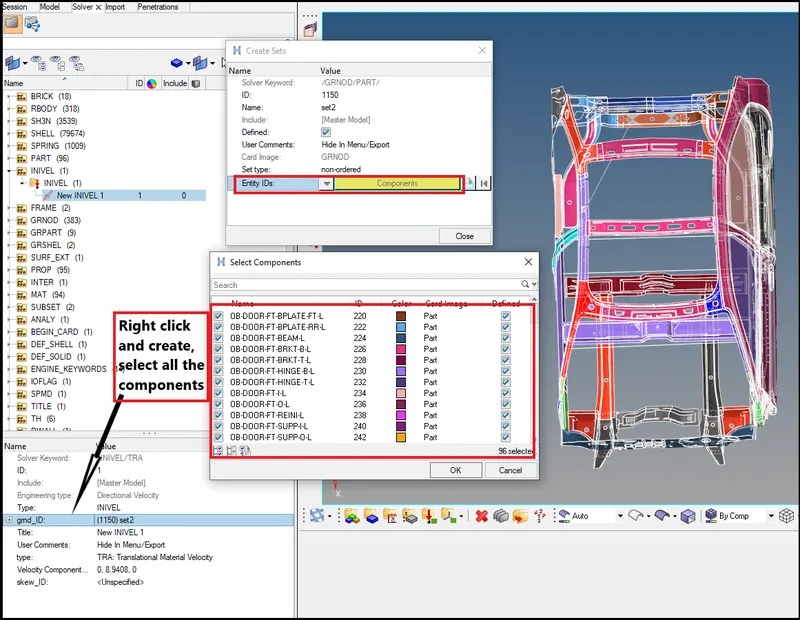
- Select all components because we are going to give the initial velocity for the whole BIW parts.
- After selecting component give velocity in Y- direction 0f 8.9408 m/s.
8. Give time step for Brick, Noda, and Inter as 0.0001 milliseconds with respective scale factors.
To give time step go to Model browser> cards > ENG_DT_BRICK
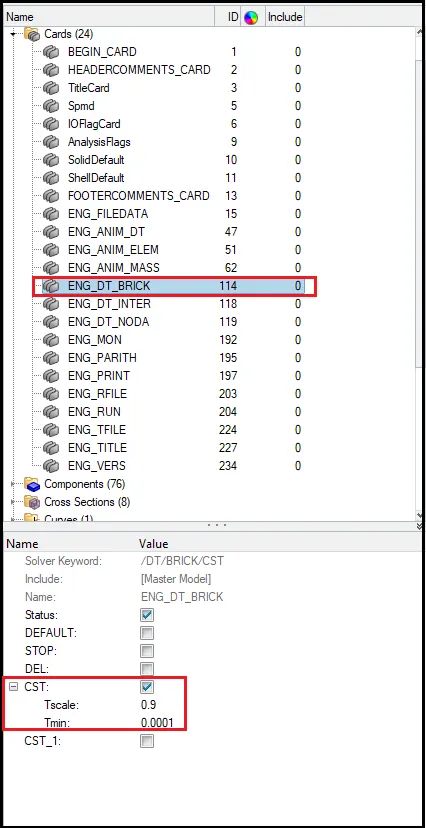
- Give CST type and add value for scale factor and time step.
- Similarly, we will do for NODA.
- But here we will give a scale factor of 0.67.
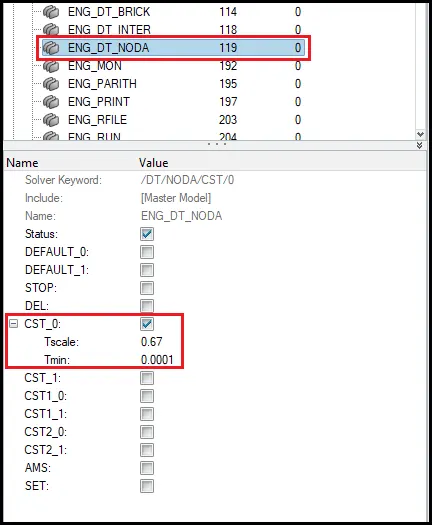
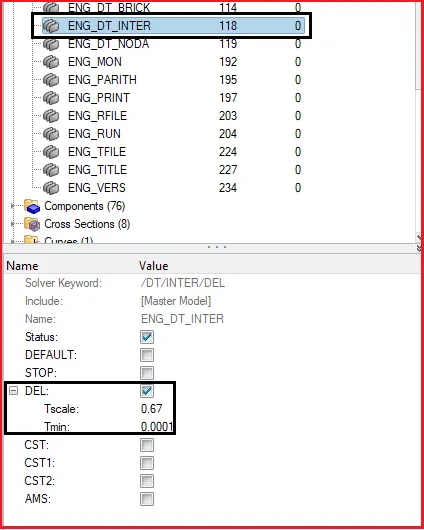
- Now we will give the time step for the interface and we will choose DEL here.
- DEL will activate the delete element command if the time step goes below the given time step.
9. Create sections on the Driver seat rail and middle rail.
- we are creating sections to analyze the amount of force is traveling from that region.
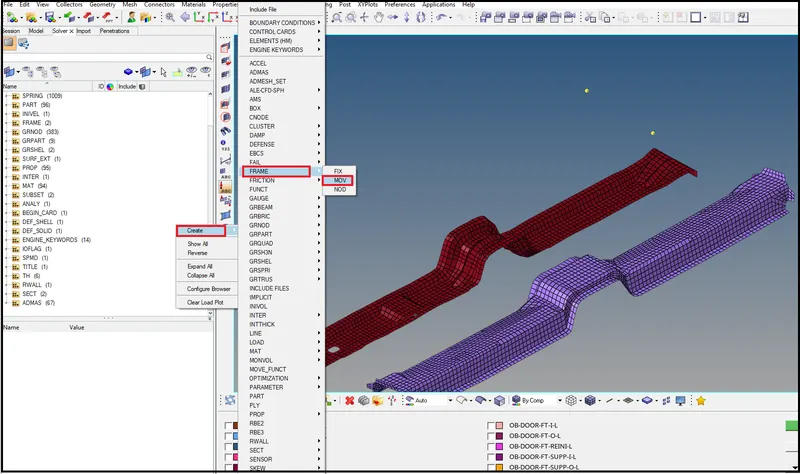
- Select nodes in a way that the frame z-axis should come perpendicular to the global coordinate system.
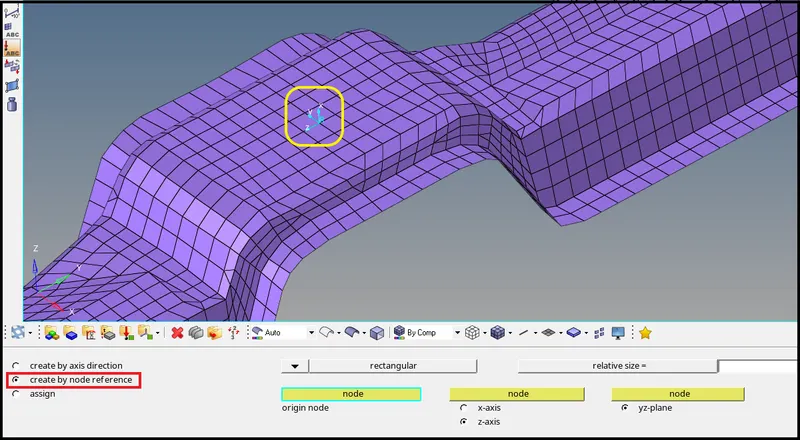
- The frame is created now.
Now after the frame we will create a section,
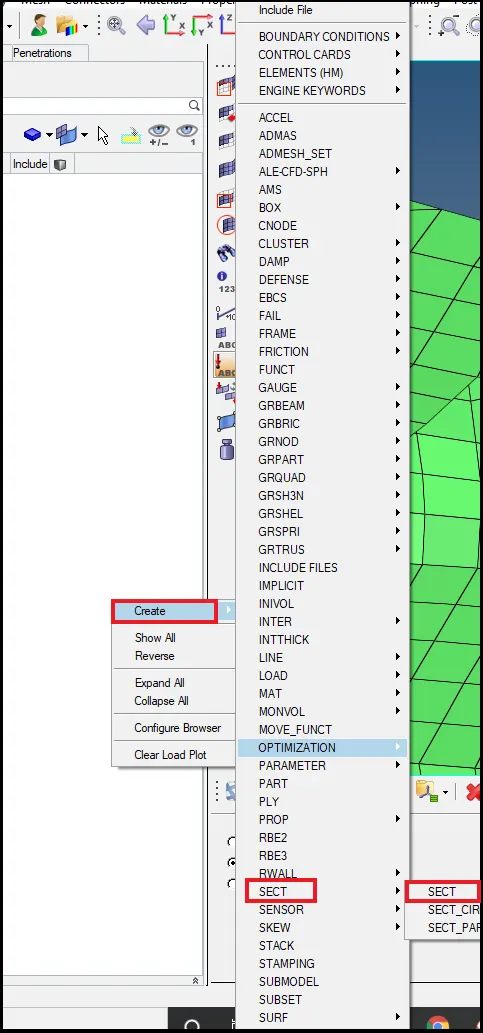
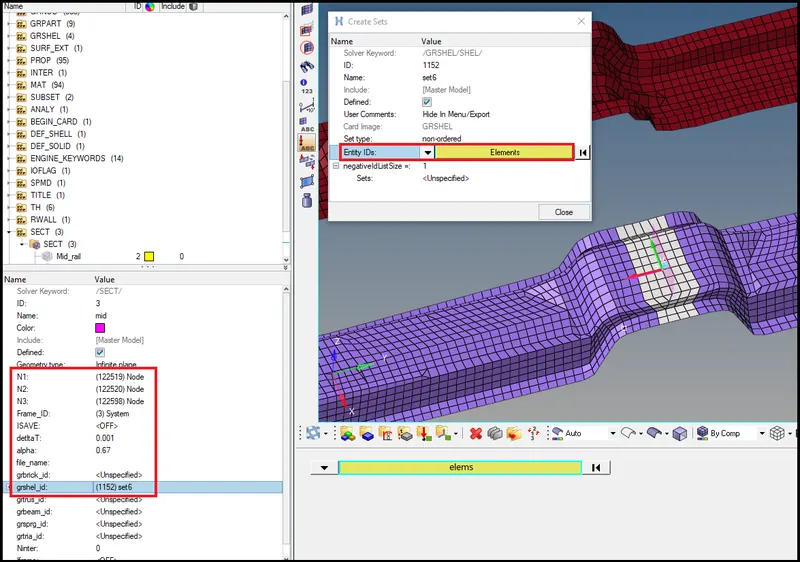
- We can select the N1, N2, and N3 in the same way we selected the nodes for the frame.
- Then we can see the red, blue, and green arrows which is showing the section plane.
- Then in frame id select the frame which we have created earlier.
- Now select the elements in the region where we are going to create a section, for that right click on gshell_id and create and edit and select elements.
- Put the factors value of deltaT=0.001 and alpha=0.67.
- Hit on proceed and we can see the section is created successfully.
- Now we can review this section.
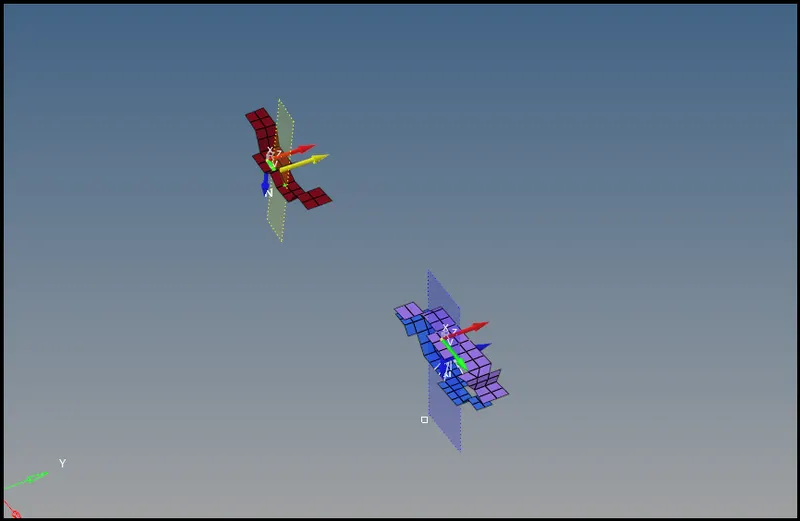
10. The intrusion at B pillar, hinge pillar, and fuel tank region.
- Here we will deploy an intrusion spring to measure the deformation.
- This means how much spring length will change, will tell the length of BIW deformed in the passenger compartment.
Go to Geometry > Temp node > select nodes > add.
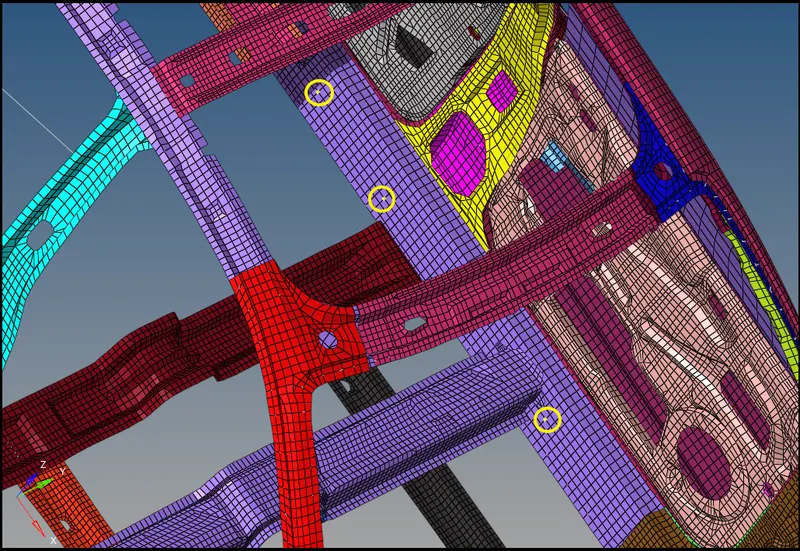
- Here select the opposite side node carefully, it should be the exact opposite with object symmetry.
- Now deploy spring connection between nodes,
Go to 1D > Spring >Spring2 > Select nodes
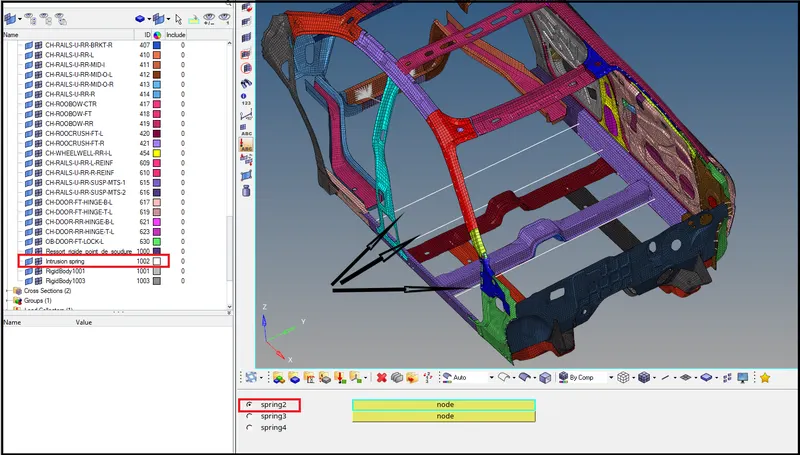
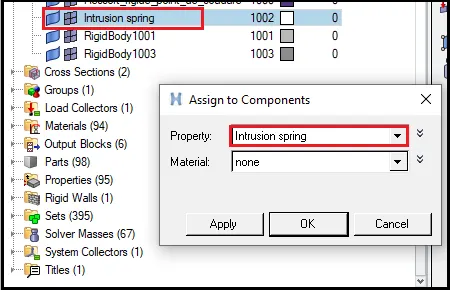
- Create a different collector for this intrusion spring so that we can assign property for this spring.
- Now create a property card for intrusion spring.
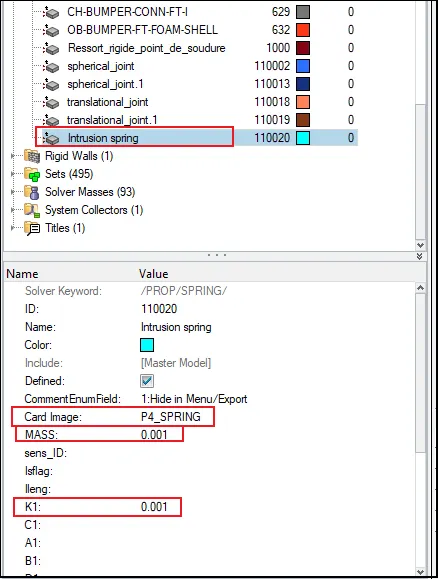
- Select as P4 spring and mass value as 1gm and stiffness 1N/mm.
- Also, assign this property to the intrusion spring collector.
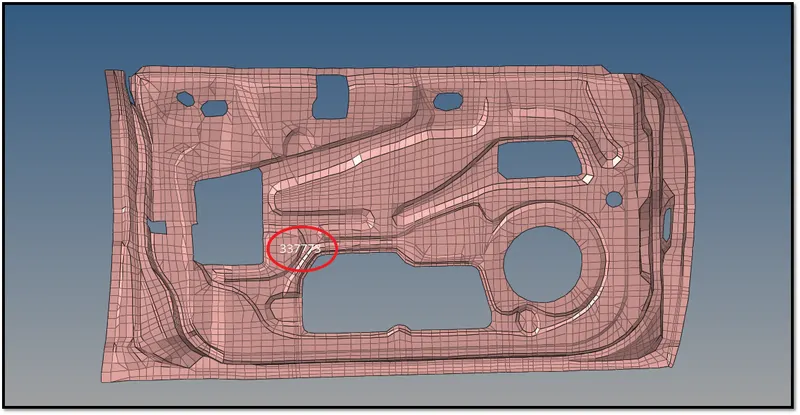
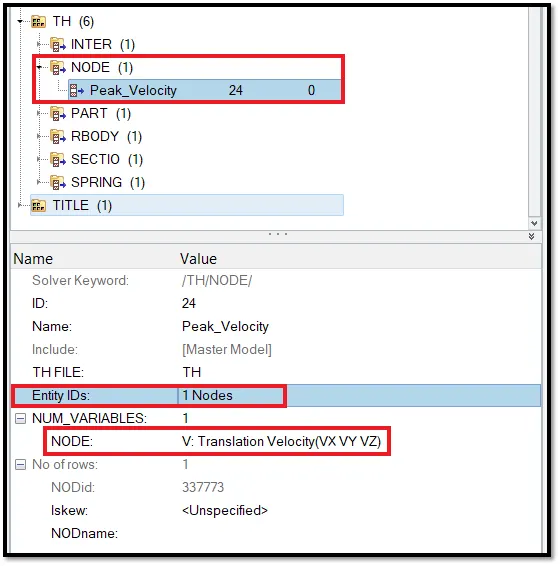
11. Create Peak Velocity of Inner Node of the Door-
- Here we have to create a peak velocity, To create a peak velocity, First, we have to create a node.
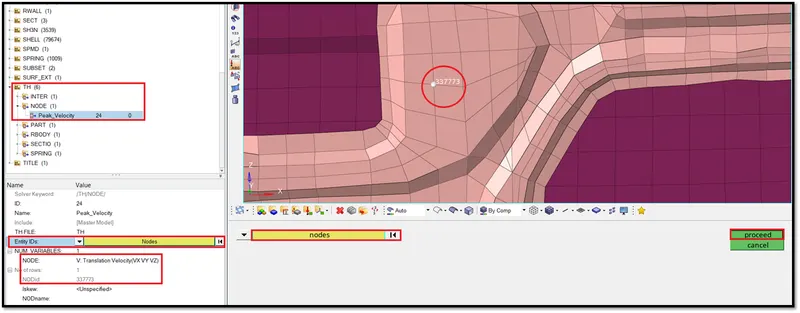
- We have to give peak velocity at the given node [337773].
- Select the node by id and enter the id number and click on. The node number will be displayed, We have to create a node there and request TH for that node.

12. Output Request-
a). TH for Sectional force in the cross member.
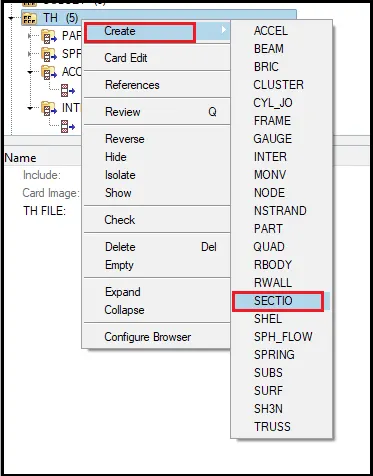
- Select all sections we had created.
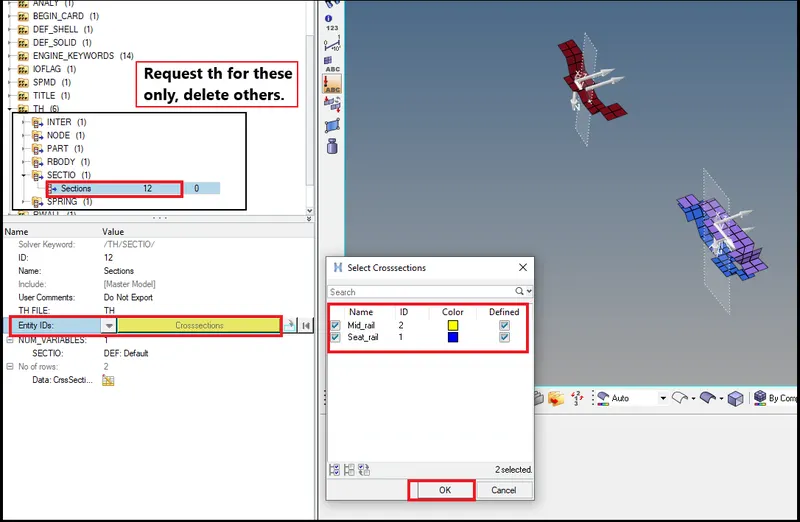
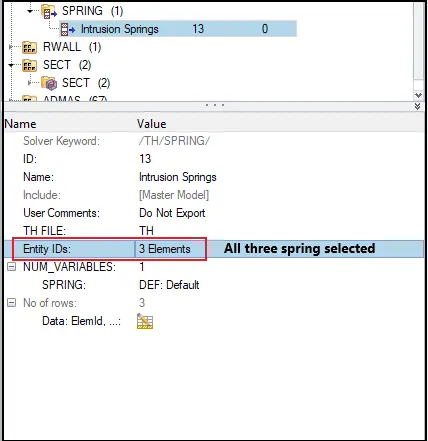
b). Now request for TH file for intrusion spring at B pillar, hinge pillar, and fuel tank region.
c). TH for Peak velocity of the inner node of the door.
- Create a TH for that node. Because to know the peak velocity at that point.
- So, We have to request TH for that Node.
- To create a TH for that node, Right Click on the Solver Browser >> Create >> TH >>NODE. Which is shown below
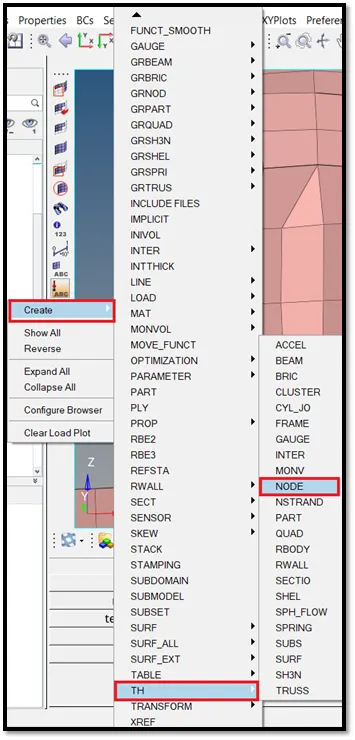
- In the Entity IDs option, Select the Node.
13. Perform model checker.
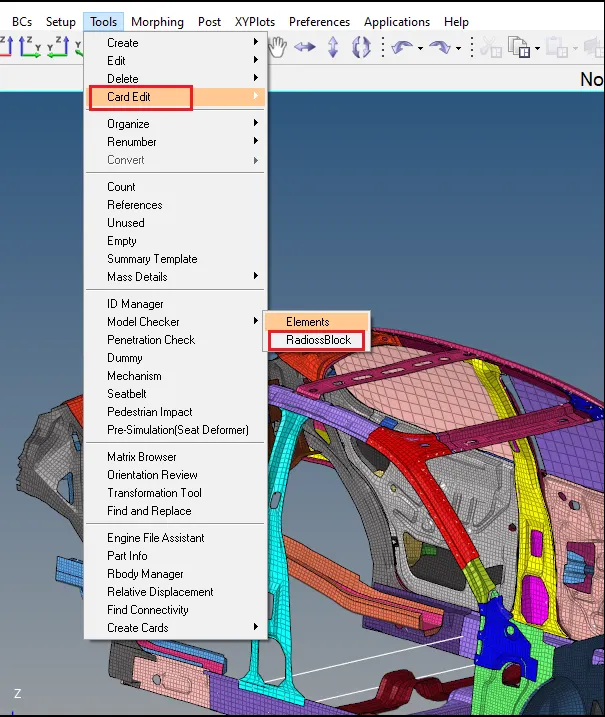
- Now run the model checker.
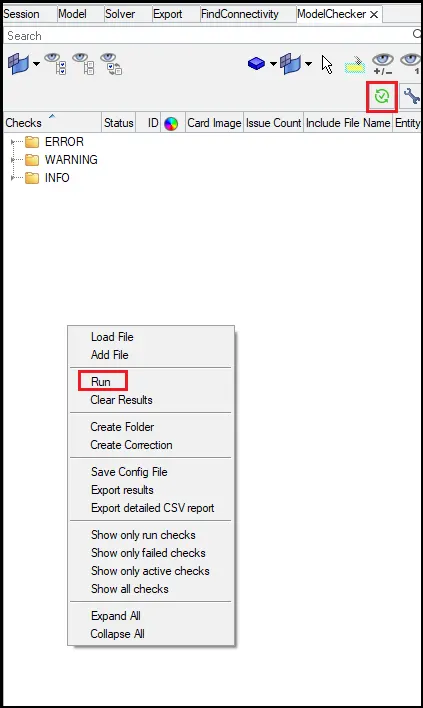
- It will some groups of warnings, Null and unused sets.
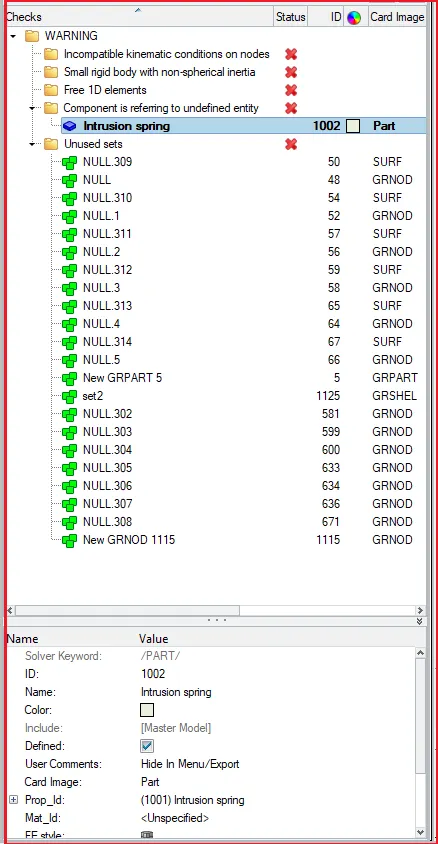
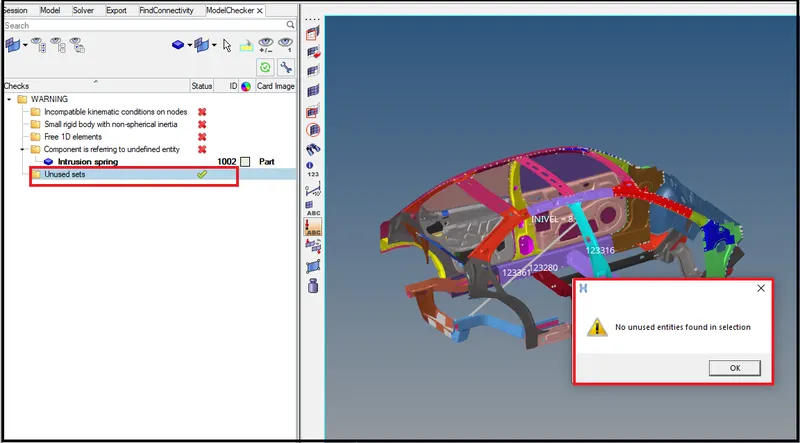
- We can delete unused sets from Tools>unused> select all unused sets>delete.
- Go for delete the unused sets again and again until it will show no unused entity found.
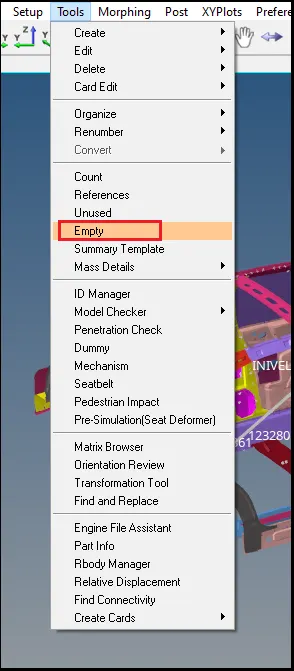
- Similarly, go for deleting empty sets.
- Select all empty sets.
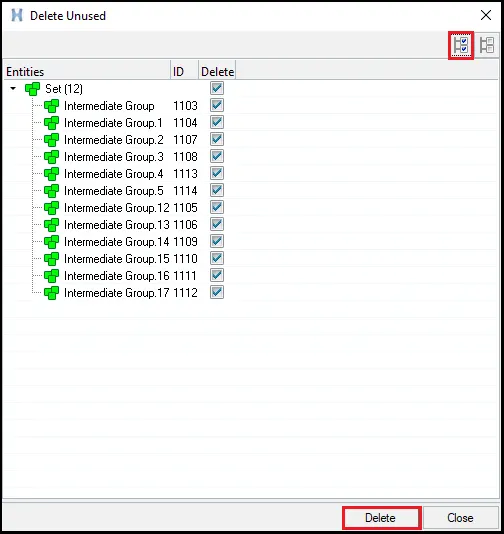
- Go for delete the empty sets again and again until it will show no empty entity found.
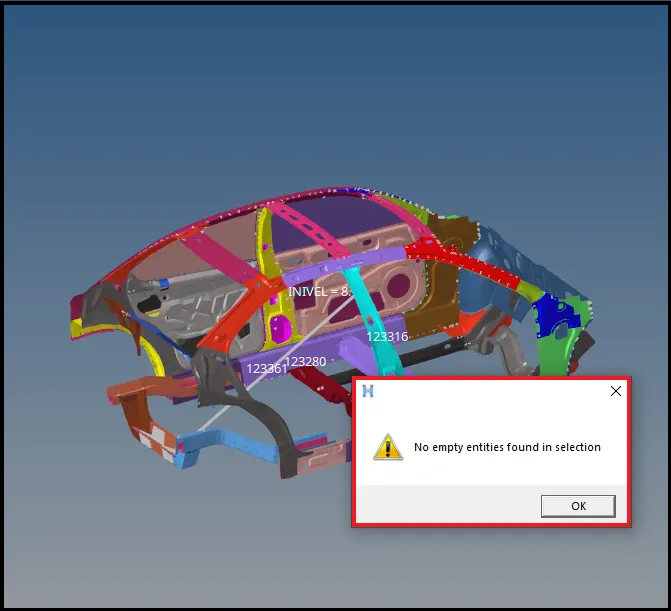
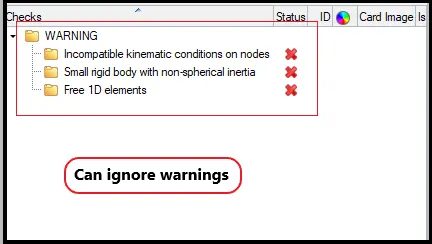
Now run model checker again,
warnings will show which we can ignore.
Run the simulation:
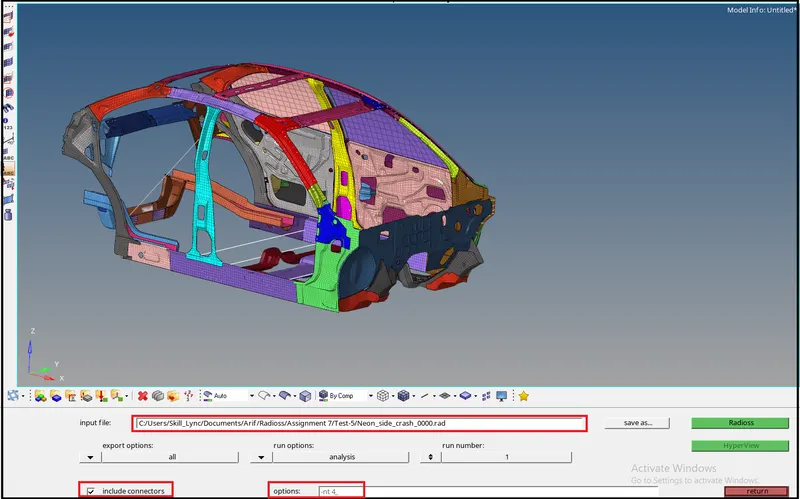
- To run the simulation go to Analysis > Radioss.

- After clicking Radioss click on the input file and save it in a new folder as Test-1 as shown below figure.
- Check the include connectors and option as -nt 4.
- N indicated how many cores will involve to run the simulation.
- It will make simulation faster.
- After that click on Radioss, it will start the simulation.
- And wait until the new window popup and show as Radioss job completed.
- After running the simulation we will get the animation file, h3d file, and also T01 file.
- Check for all the files.
- Now open out file and check all the details.
- Here we can see all variables in the out file about energy error and mass error also.
- So for checking the maximum loss check the last cycle details.
|
|
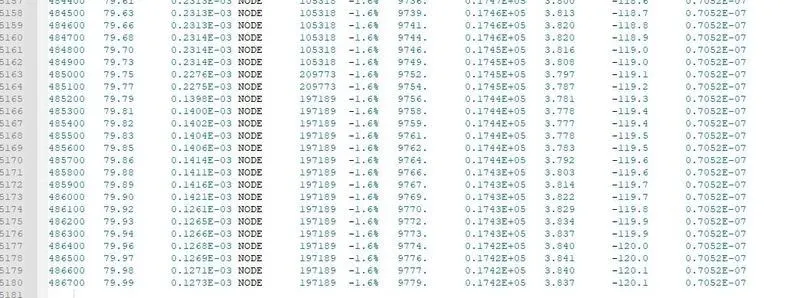
- Here in the last cycle of the simulation, we have maximum energy losses where,
Energy error = -1.6 % Acceptable (Range is -15% to +5%)
Mass Error = 0 Acceptable (Range is 0 to 2%)
So the resultant energies are,
- Internal Energy 9779
- Kinetic Energy 0.1742E+5
- External work -120.1
- No of cycles 486744
Result Plots-
- Review the simulation using Hyperview.
- Plot the graphs using Hypergraph-2D
- Review the simulation using Hyperview.
Split the screen into two-part-
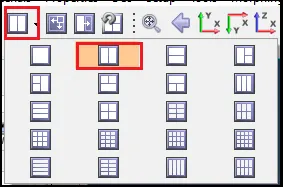
- Now after splitting the screen open hyper view after switching into in 2nd screen.

- In the hyper view, the window import the h3d file for a simulation run.
Animation-
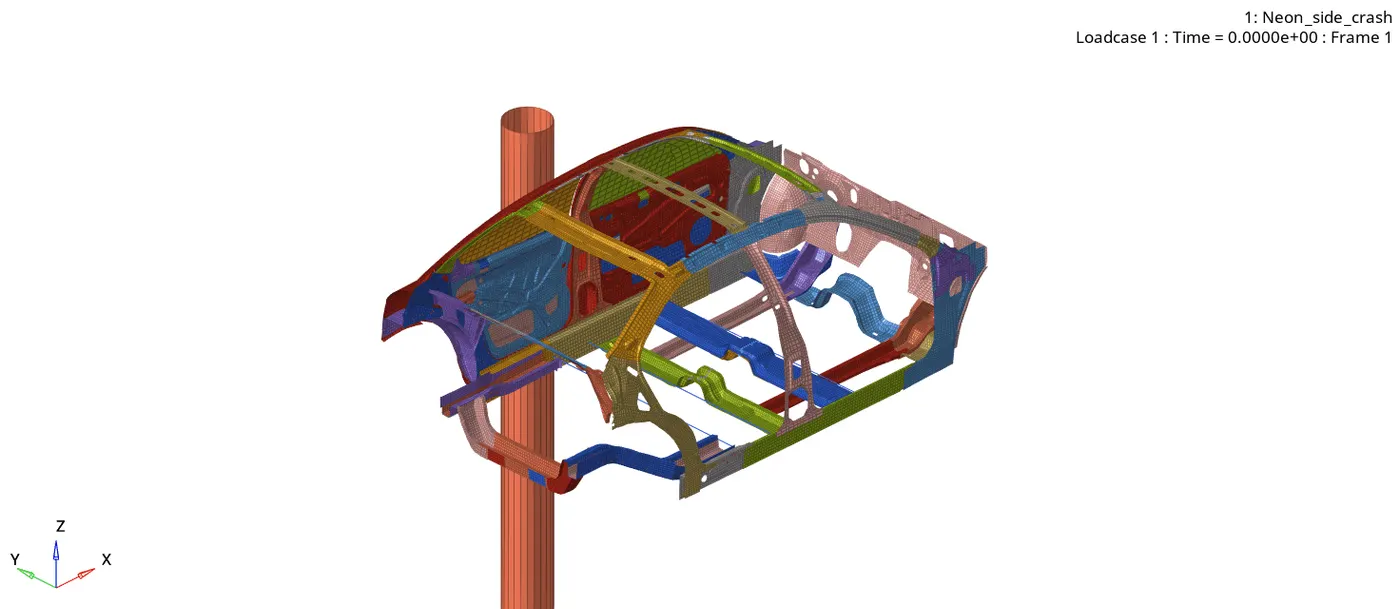
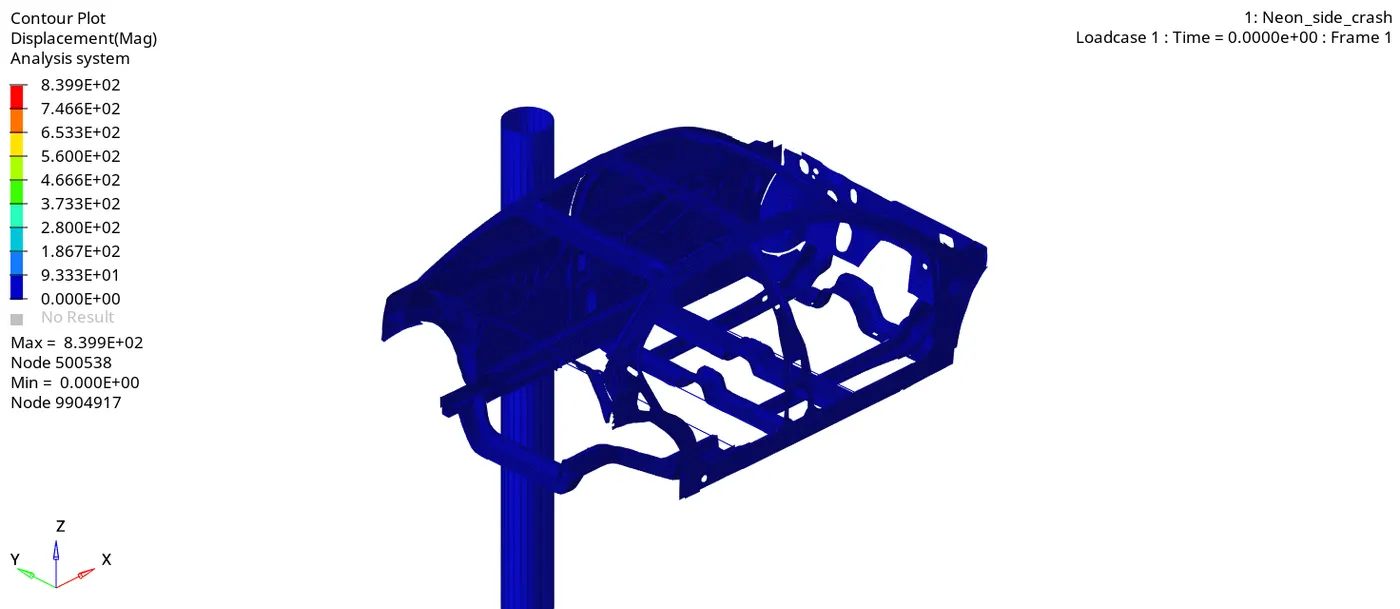
- Now after importing the h3d file on hyper view GUI go for contour activation.
- In contour, it will show the simulation graphically and contour lines of load and other properties variation.
- To activate contour go to Toolbar > contour as shown below.
- Go to Contour > Displacement > apply contour.

- similarly for Von-mises:
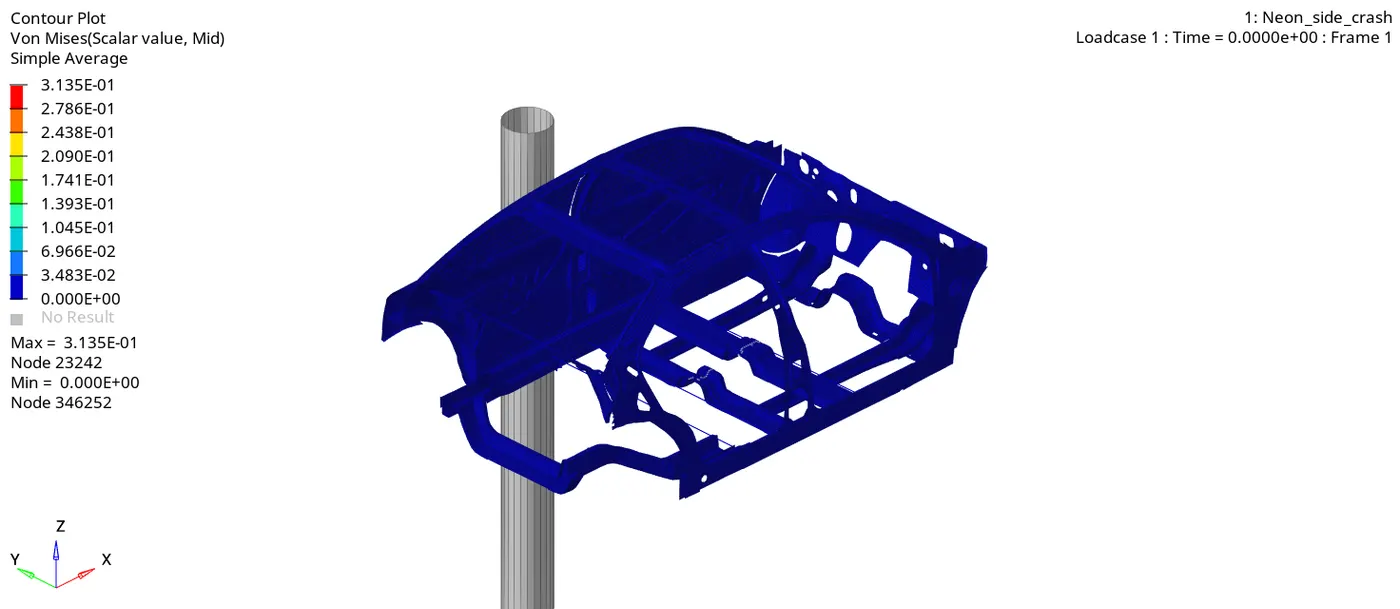
- According to the simulation, we can see that when a car impacts on a pole then firstly force is coming to the structural body is the outer part of the gate then b-pillar. And then it transfers continuously from inner rails to crossectional rails of BIW.
- As the force is transferring throughout the body in y-direction the amount of force is going to decrease cause at every stage some amount of force going to absorb in every stage.
- From the above simulation, we can see that the stress distribution over the BIW is somewhat fine, with very less area with stress concentration.
- Since this BIW body doesn't have any CCB assembly, engine assembly, chassis system, etc. So the deformation will be different from the actual car body.
Plot the graphs using Hypergraph-2D
- Now split the window in 3Part and open hypergraph-2D in the new window.
- After opening the hypergraph window import the T01 file in Hypergraph.
First, we will plot the graph which we have requested,
A). Section forces-
1. Driver Seat rail-
- In the direction of velocity, we have two main section rail.
- On those two we will draw a graph of the amount of force coming.
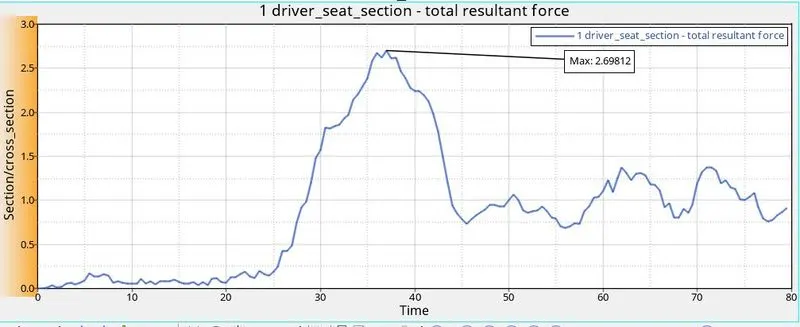
- In the seat rail section, the force obtained is 2.698 KN.
2. Mid rail-
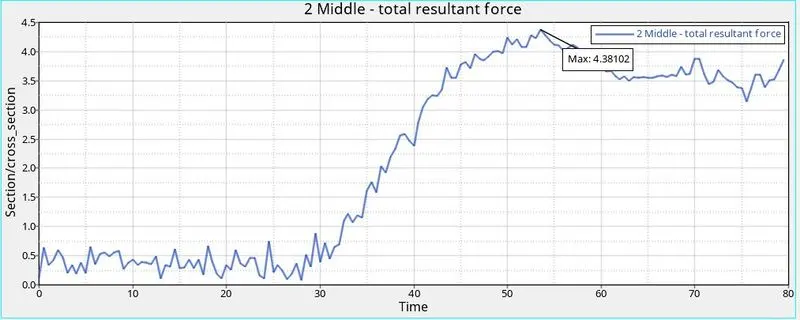
- In the mid-rail section, the force obtained is 4.38KN.
B).Intrusion graphs-
- Here we will see a lot of intrusion in spring deployed on a different section.
- It is because here in this model lot of structural parts are missing, mainly CCB assembly, seating system, chassis part, and additional rails.
Graph For Fuel tank intrusion-
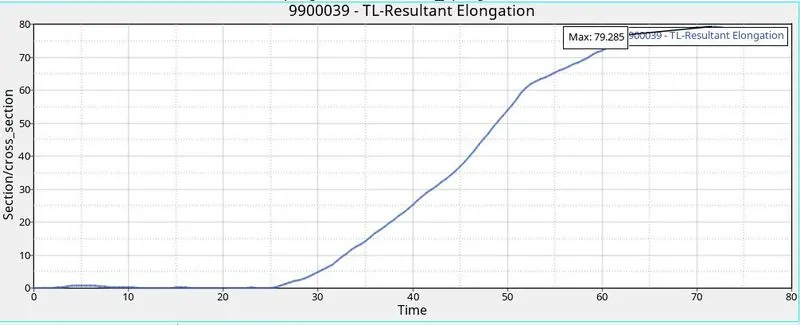
- Intrusion in spring at the location of the fuel tank obtained is 79.28mm.
Graph For B-pillar intrusion-
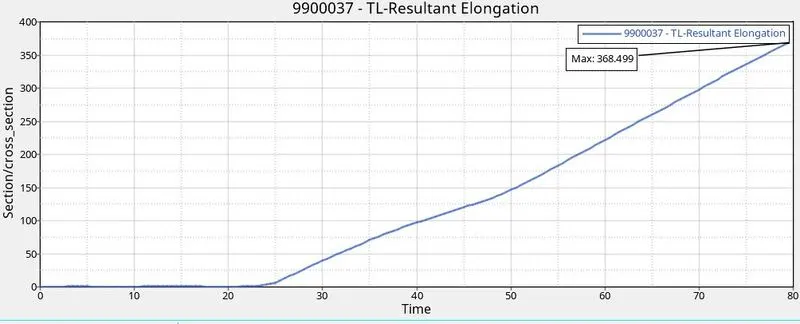
- Intrusion in spring at the location of the B-pillar obtained is 368.49mm.
Graph hinge pillar tank intrusion-
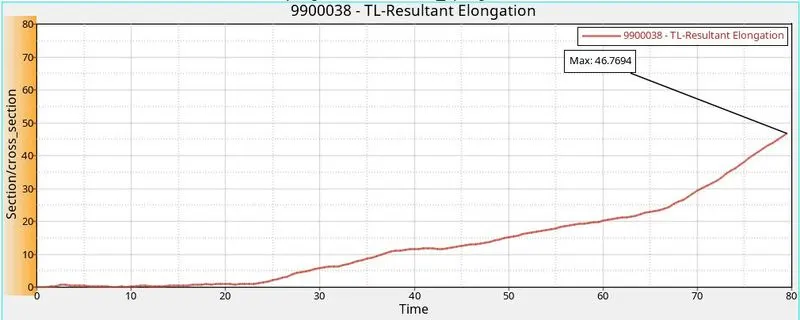
- Intrusion in spring at the location of the hinge pillar obtained is 46.77mm.
C). Peak velocity graph-
- In the peak velocity graph, we can see the velocity is about constant(8.94m/s) until it impacts the pole.
- After the impact, the velocity decreases slightly due to folded deformation and then increased little is because of the inertia action of the pole and car body.
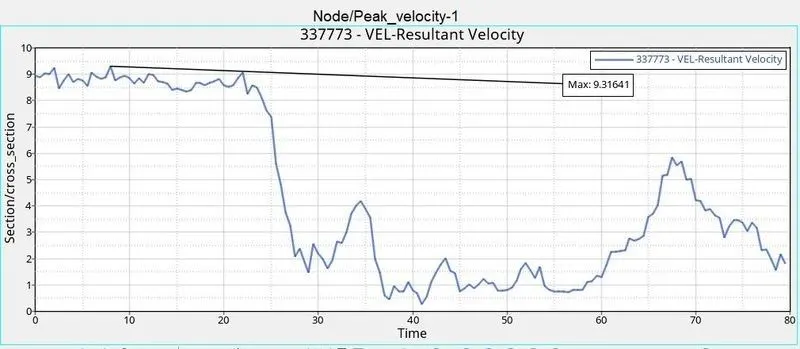
- The Peak velocity is 9.31m/s.
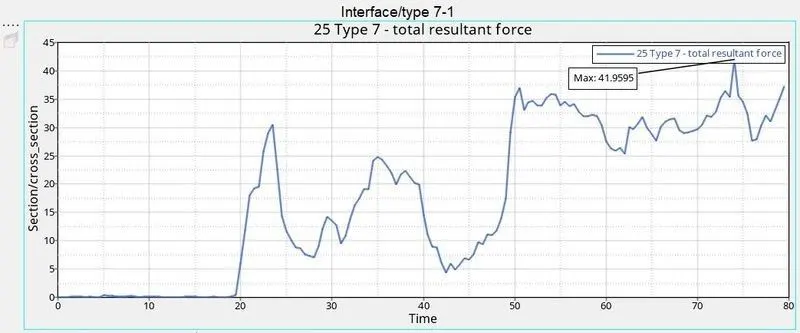
D). Interface
- This graph is showing the force generated due to self contact with respect to time.
- So the maximum amount of force-generating due to self contact is 41.9595KN.
E). Global Energies-
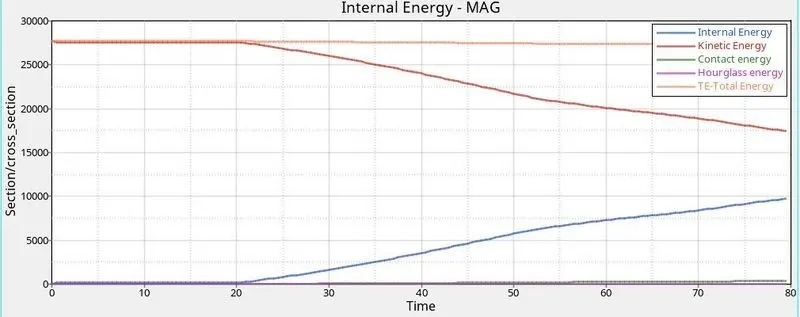
- Now we will study the energy variation throughout the simulation.
- Here is the cumulative graphical variation of all types of energies involved in the simulation.
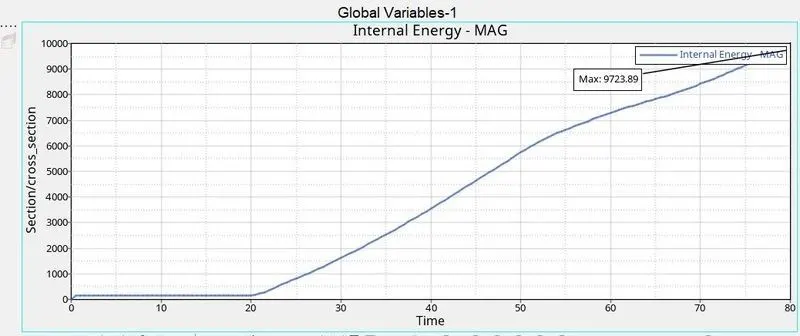
Internal Energy-
- At time t=0 internal energy will be zero, and as impact begins the amount of force causing the stress due to which strain starts taking place and deformation happens.
- So due to deformation some internal energy will start storing within the body and keep increasing as deformation increases in the body.
Kinetic Energy-
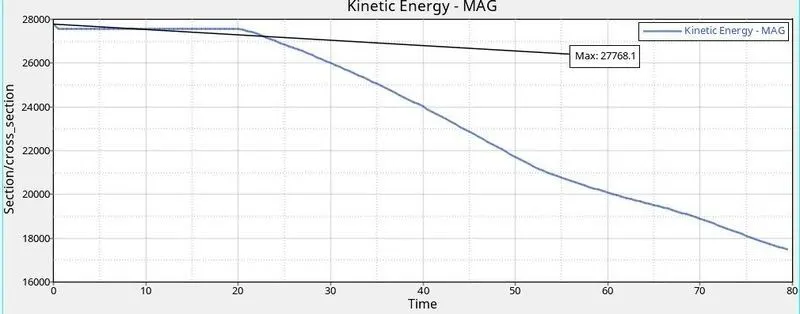
- Since we have given an initial velocity to the car body 0f 8.94m/s and car body itself has its mass so according to the kinetic energy formula.
- 1/2 mv^2 = 27768.1kJ(kilo joule)
- The value shown by the graph below is less than the calculated value is just because of energy error.
Contact Energy-
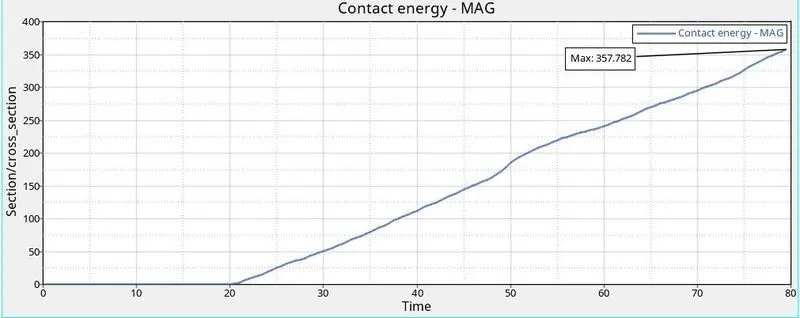
- Contact energy is due to the self contact of FE elements of the car body.
- So according to the graph, the maximum value of contact energy is 357.78KJ.
Hourglass Energy-
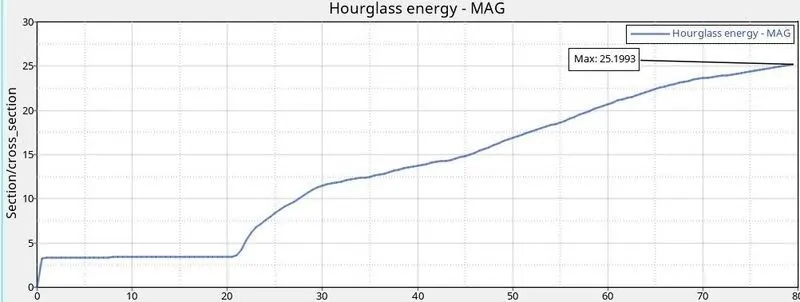
- Since we already used shell parameters, instead of that we observe some amount of hourglass energy.
- This hourglass happens in some region where goes below the given timestep due to stress concentration in the coarse mesh.
- For that, we particularly work on that region to refine the mesh.
- But here the value is 25.1993KJ less than 10% of the internal energy value(10% of 9723.89 is 972.389KJ).
- So this hourglass value is acceptable.
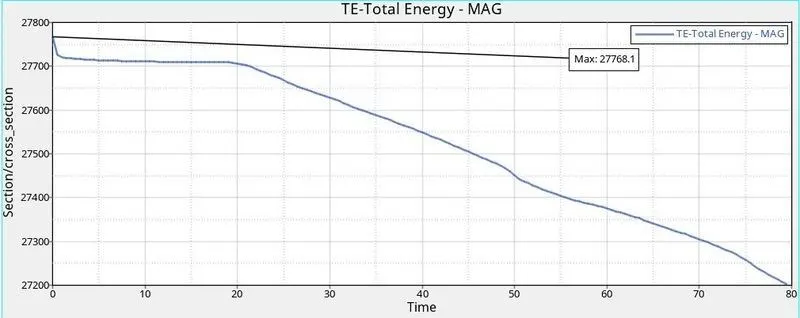
Total Energy-
- The total energy is a combination of all energies present here,
- The maximum value of total energy is found 27768.1KJ.
Result-
- Mass balancing is done for the given BIW for a final value of 700kg.
- Created Typ-7 Interface contact for BIW self contact.
- Created cylindrical rigid wall with friction value as given.
- Timestep value is given for all types of elements and contacts.
- Initial velocity 8.94m/s is also given to the BIW body.
- An intrusion spring is created to measure the deformation of the car in the y-direction.
Learning Outcome-
- How to balance mass in hypercrash and hypermesh.
- How to create a cylindrical rigid wall for side pole crash.
- How to create interface contact and set all the required parameters.
- How to give initial velocity to car and time step values for brick shell and interface.
- How to request for TH file which will be used in post-processing of the simulation.
- Learned how to create frames and sections to determine sectional forces and their importance.
- Get to know what are standards used for crash analysis like FMVSS, Euro-NCAP, etc.