Side crash test on car using Hypermesh and Radioss
AIM
* Simulation for side pole crash using Radioss and Hypercrash.
OBJECTIVES
- Check the unit system and either follow [Mg mm s] or [Kg mm ms].
- Create appropriate interface with friction 0.2 and recommended parameters.
- Make sure of no penetrations and intersection.
- Correctness on rigid bodies if any issues.
- Create rigid wall with friction 0.1.
- Compare the model weight with the full scale 300k nodes model and use added masses to reach target weight 700kg while getting CG about the required range.
- Initial velocity should be assigned as 18 mph.
- Use model checker to ensure good quality.
- Time-step :0.5 to 0.1 microseconds.
- Run 80 ms.
METHODOLY
- Import the model in Hypermesh/ Hypercash.
- Terminate the free parts if it is not possible to connect with the component.
- Assign contact interface, kinematic conditions and boundary conditions.
- Create rigid wall and assign given value for initial velocity.
- Add mass to reach the target weight.
- Create data history for cross sections, intrusions and velocity of specified node.
- Run the simulation in Radioss workbench and plot the graphs obtained.
SIDE POLE CRASH TEST
Side impacts have a significant detrimental effect not just on the car but also the occupants because of the absence of a crumple zone. Roll over tests are conducted to test a car’s ability to support itself in a dynamic impact. More recently dynamic rollover tests have been proposed over static crush testing. The purpose of side impact crash tests is to assess the risk of injury to vehicle occupants in the event of a side impact crash and to develop techniques for minimizing this risk. Many agencies and research organizations have recommended a variety of methods of performing and evaluating side impact crash tests. Each group has specific goals in proposing side impact test and evaluation criteria: the motor vehicle manufacturing community seeks to improve the performance of vehicles, the biomechanics research community seeks to implement more effective occupant protection strategies, and the roadside safety research community seeks to develop roadside safety hardware that performs well in side impact crashes. Ultimately all these groups are seeking to reduce the risk to vehicle occupants by improving the part of the vehicle-occupant-roadway system for which they have responsibility. Often research communities develop procedures and evaluation criteria in isolation from each other leading to difficulty in exchanging, interpreting, or using information. Ensuring that procedures and evaluation criteria are consistent with other disciplines wherever possible can greatly improve the quality and quantity of information exchange and thereby help researchers and developers to find solutions more quickly. The purposes of this paper are to (1) present recommendations for performing side impact crash tests of roadside hardware, (2) describe the experience to-date in using the recommendations, (3) examine side impact test and evaluation criteria from the perspective of harmonizing roadside safety standards with the other existing standards wherever possible and (4) to identify areas needing additional research.
Passenger car subjected to side impact loading
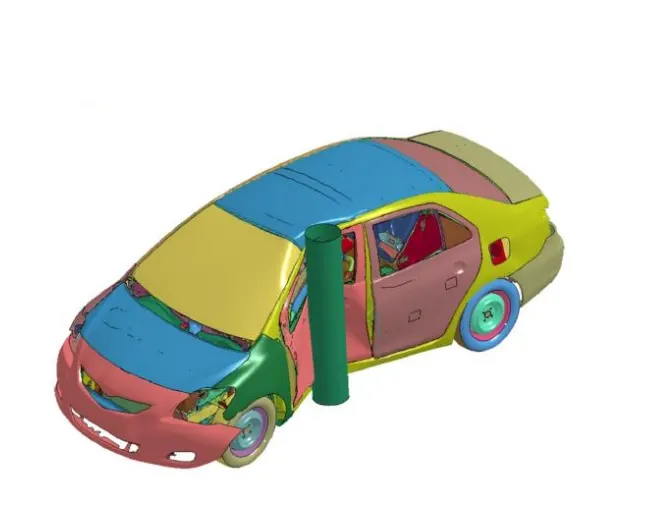
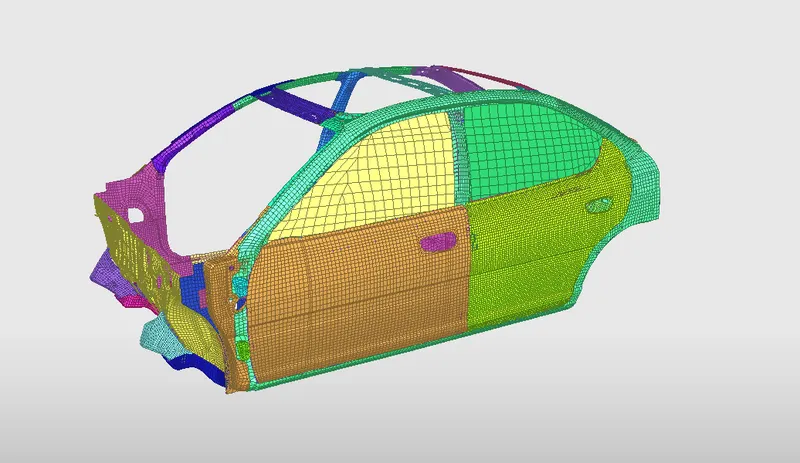
A numerical model of a light-weight passenger car, developed by the National Crash Analysis Center NCAC (2011) of The George Washington University under a contract with the Federal Highway Administration (FHWA) and National Highway Traffic Safety Administration (NHTSA) of the United States Department of Transportation (US DOT), was used to simulate a side impact collision with a rigid vertical 154mm diameter pole on the front side door at 8 m/s (29 km/h), using an explicit solver. The complete model consisted of 771 parts with a total of 974,383 elements. The model comprised a fully functioning suspension and steering subsystem, as well as all major structural components, but excluded any interior components or restraint systems. The element sizes of components were discretised in accordance with simulation processing time and accuracy relative to the rest of the vehicle. For example, the engine block was modelled as an isotropic hypo-elastic material with a comparatively coarse solid block mesh using hexa (brick) elements, as it remained largely undeformed in crashes relative to the rest of the vehicle. The windshield and door windows were modelled as a modified piecewise linear plasticity material without the inclusion of damage mechanics. The chassis was modelled with shell elements using the piecewise linear plasticity material model, and joined with spot-welds. The HAZ (Heat Affected Zone) of the spot-welds were accounted for by means of the spot-weld material definition in LS-DYNA. The tyres and damper joints were modelled as an elastic and nearly incompressible continuum material respectively. Failure criteria were not set for any component definitions. Material data for all main mechanical components were obtained through testing of samples extracted from vehicle parts as implemented into the model by NCAC (2011).
PROCEDURE
* Open the model in Hypercrash by importing the given rad file.
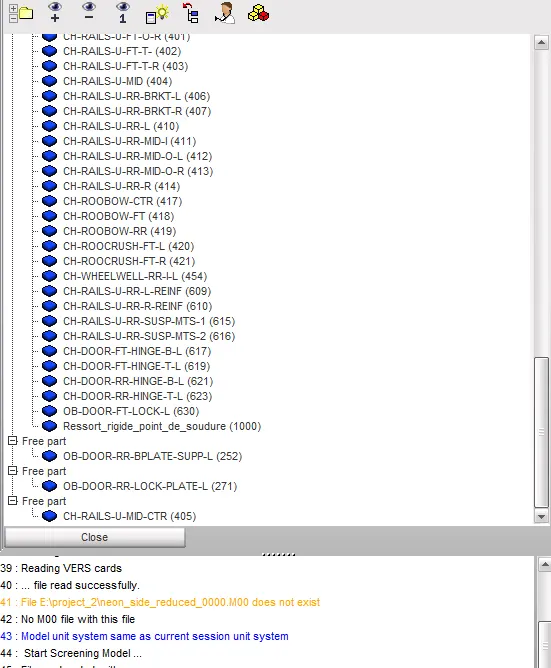
* Run the model checker for connectivity and terminate free parts if present.
* Make sure the free parts are not acting as a necessary component in the model or else appropriate connection should be given to the particular component.
* In this model the free parts are connected to the respective parts of the model as the parts are necessary while running simulation.
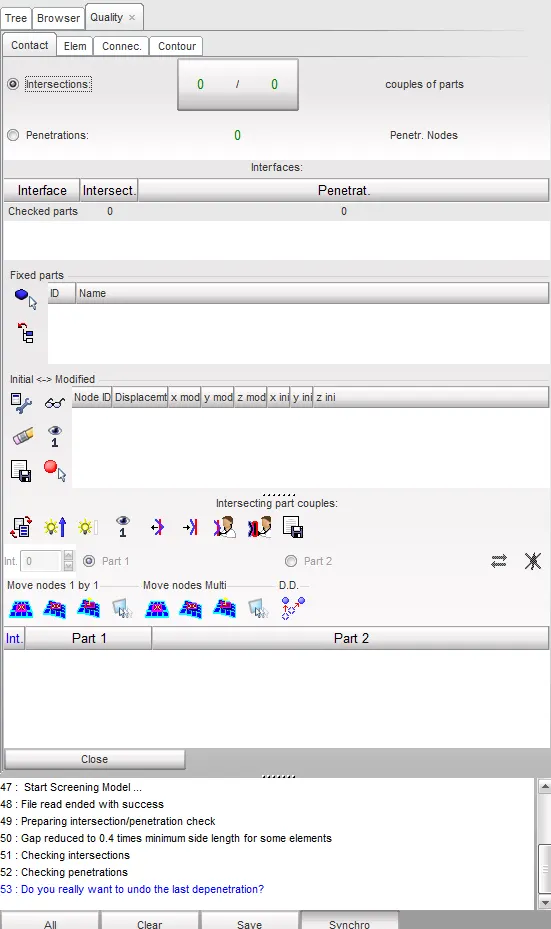
* Check for penetrations and intersections using quality check in Hypercrash because presence of any sort of penetrations or intersections leads to wrong result.
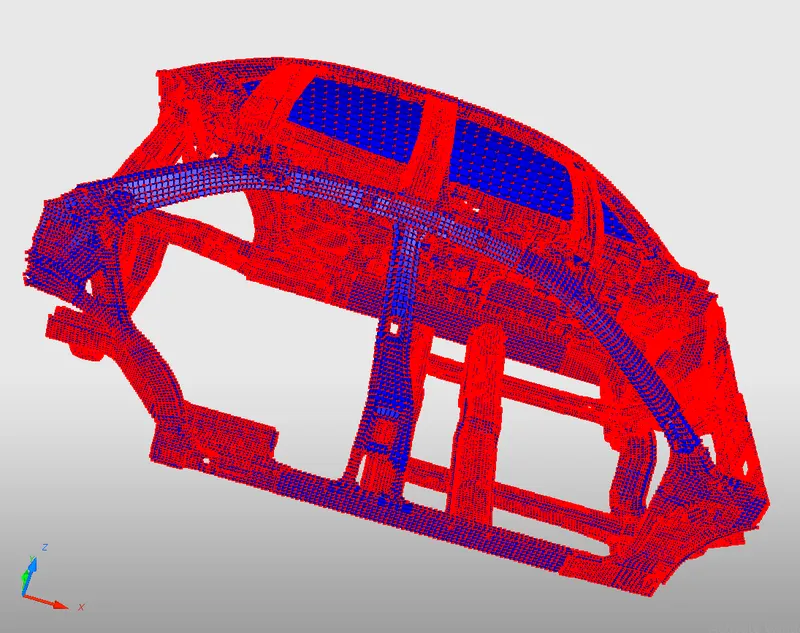
* The model is free of penetrations and intersections as shown below.
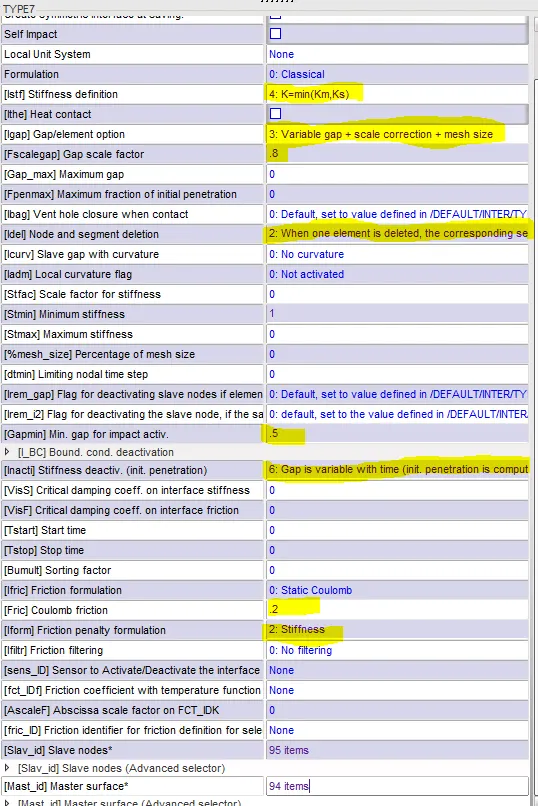
* Introducing type 7 interface in a group for all the components.
* The recommended parameters for type 7 are assigned as shown below.
* Determine the nodes and elements in interface by masking all the 1D elements.
Rigid Pole
* Rigid pole allows for an easy way to define an interface between a rigid surface and nodes of a deformable body.
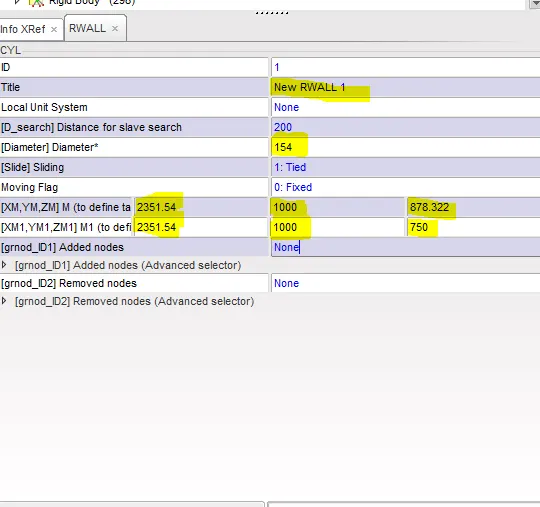
* A rigid pole is defined as surface type and a group of slave nodes. Each wall can be fixed or moving and is a kinematic condition.
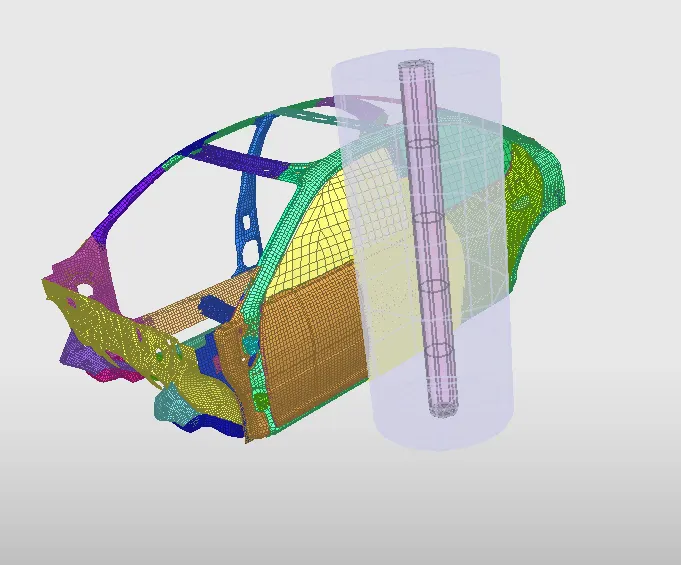
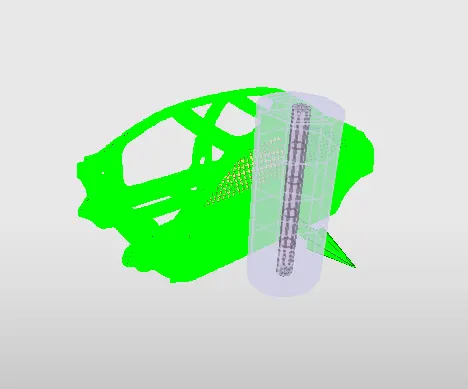
* The model is imported in Hypercrash and the Rigid pole with the given friction is created as shown below.
* For side crash testing the diameter of the pole is considered as 154mm and it is placed near to the B pillar.
COG
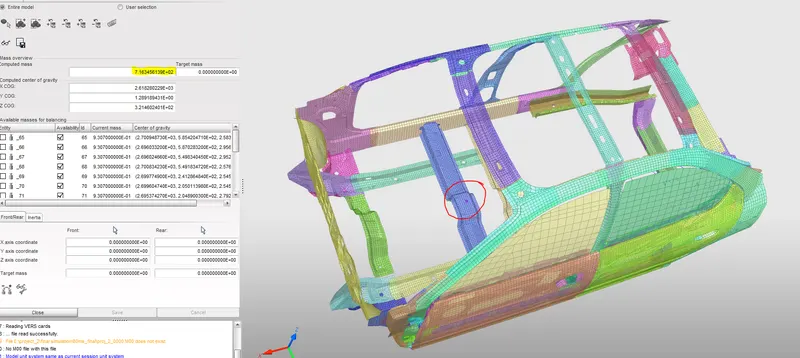
* Considering the total mass of the vehicle, it has to be balanced with the given reference model.
* In addition of mass, added mass is used from Load case in Hypercrash and the weight is balanced by giving additional masses to defferent nodes in the model and the target
* The addition of mass is given in that way to make the COG falls in the middle of the car as shown below.
Initial Velocity
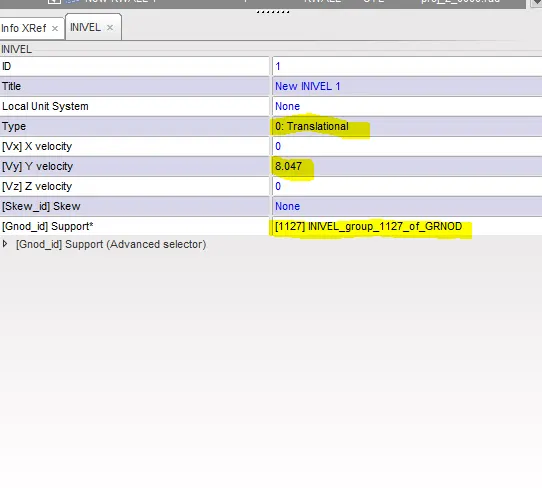
* Initial velocity defines an initial velocity on a group of nodes and no function is required in this case but the velocity in X,Y Z directions should be assigned.
* The initial velocity is given as 18 mph and since different unit system is followed here it is converted and assigned as 8.047 in the initial velocity card as shown below.
* The direction is given as Y axis because hereby it is assumed that the vehicle is approaching to the rigid pole at the given speed following the global coordinates.
CROSS SECTIONS
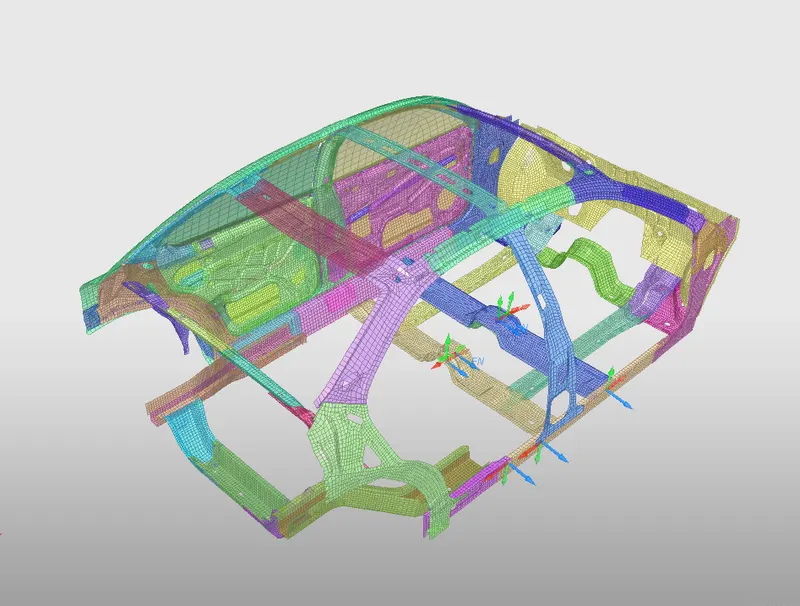
* Cross sections are created in cross beams as per the question and it is shown below.
* A local coordinate is introduced to the cross section with the help of skew.
* Time step is given as 0.1 here to capture all the data related to the force acting at the particular section in a specified time frame and the filter coefficient is given as 0.67.
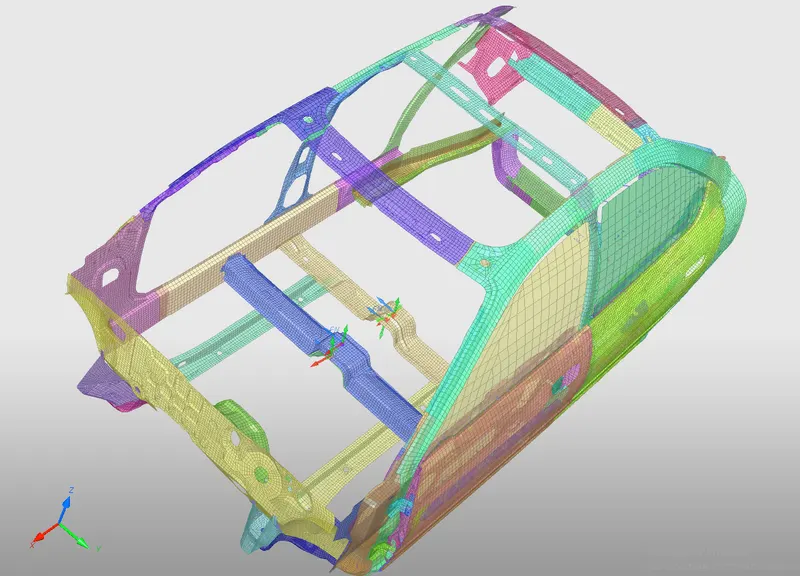
* To find the Intrusion at B pillar,hinge pillar and fuel tank region, three nodes are selected from the particular regions and a skew is introduced for each node as per shown below.
OUTPUT REQUEST
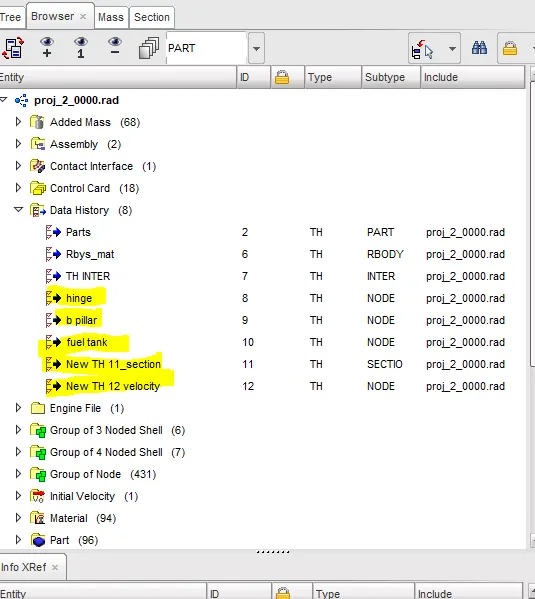
*Introducing the output request for gathering all datas and graphical representations at certain areas in the BIW model to analyse the variation of forces and displacements in different nodes throughout the simulation.
* In Hypercrash create new files in data history to generate outputs for the cross sections, intrusions of nodes and peak velocity of inner node of the door.
Time step & Model Checker
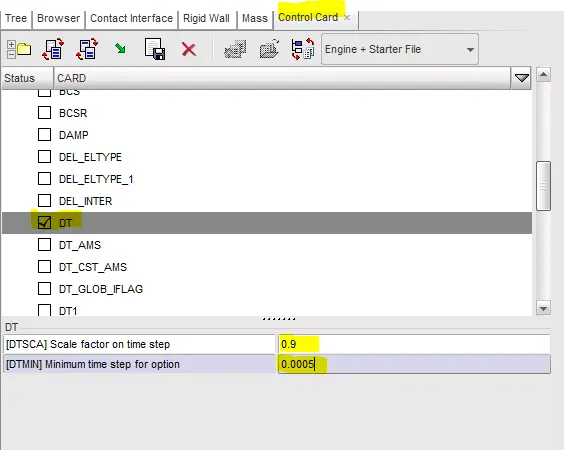
* The time step is assigned as 0.00051 milli second in the DT file in data history and the final simulation time is 80ms.
* The model checker helps in showing up the errors and warnings before running the simulation.
OUT File
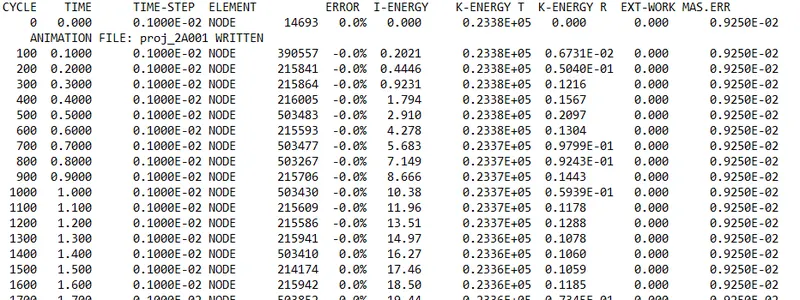
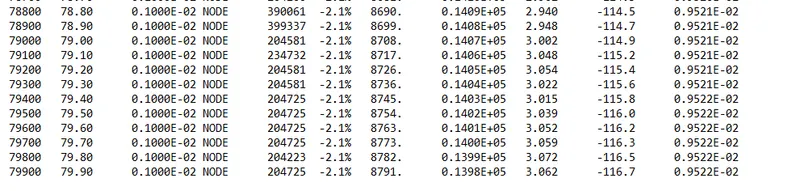
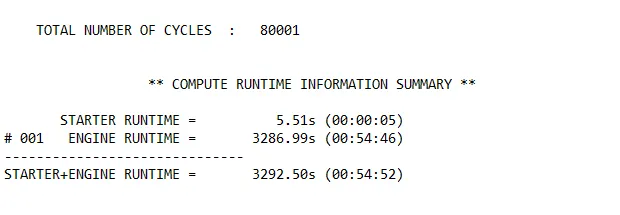
* The standard energy error percentage is between +5 and -15 and in this simulation the energy error percentage is noted as -2.1 which is within the acceptable range.
* The mass error percentage is noted as 0.0095 which is less than 1% and so the simulation is stable.
Animation Output
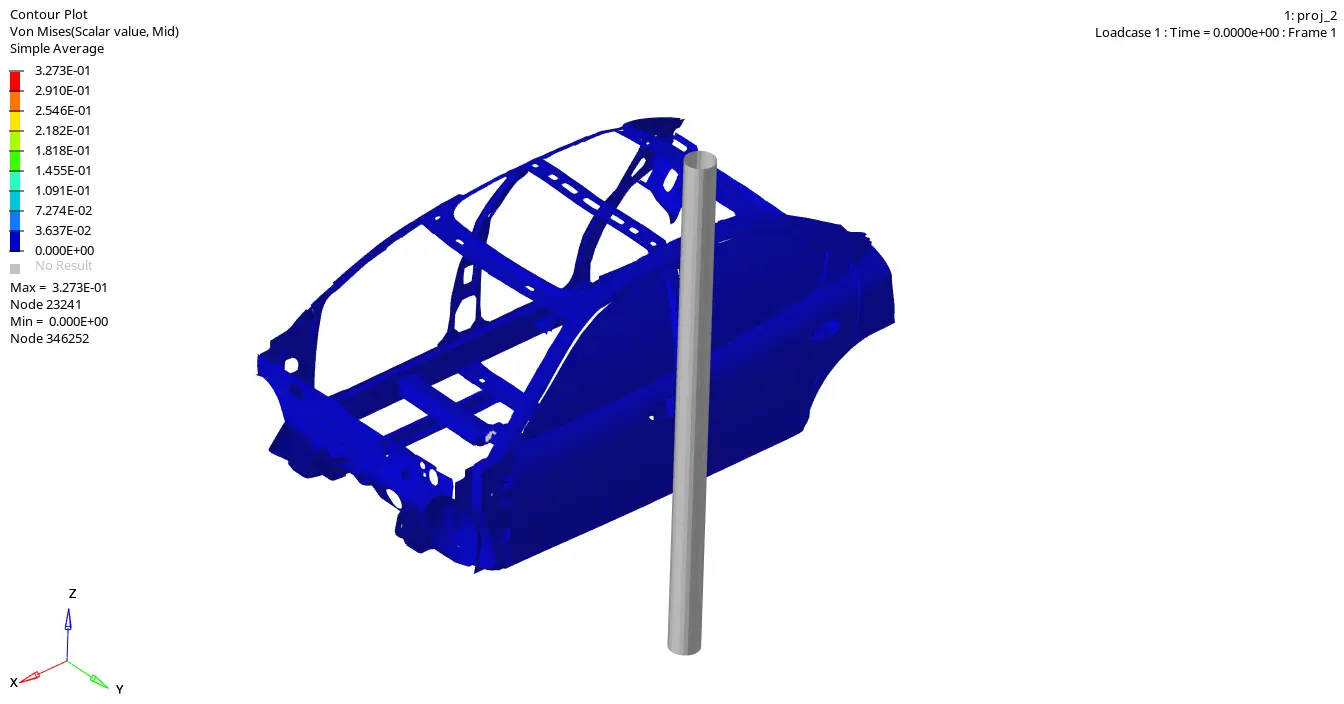
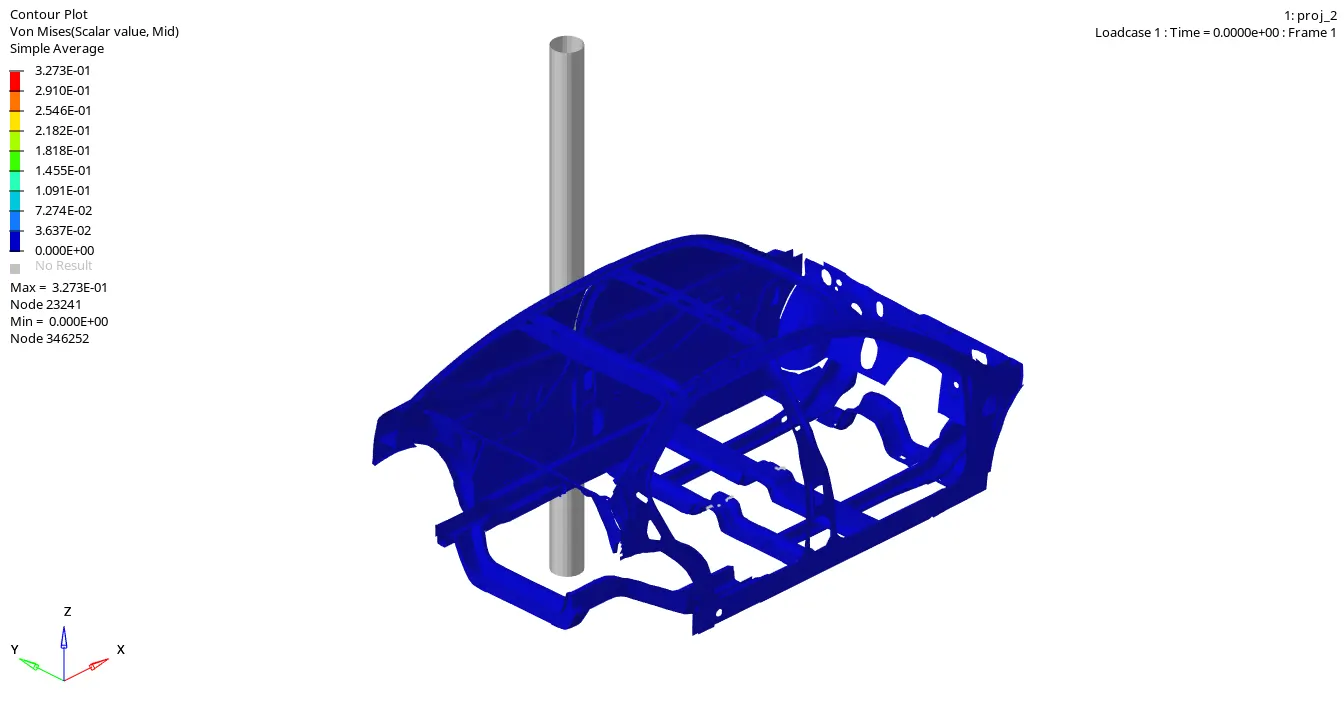
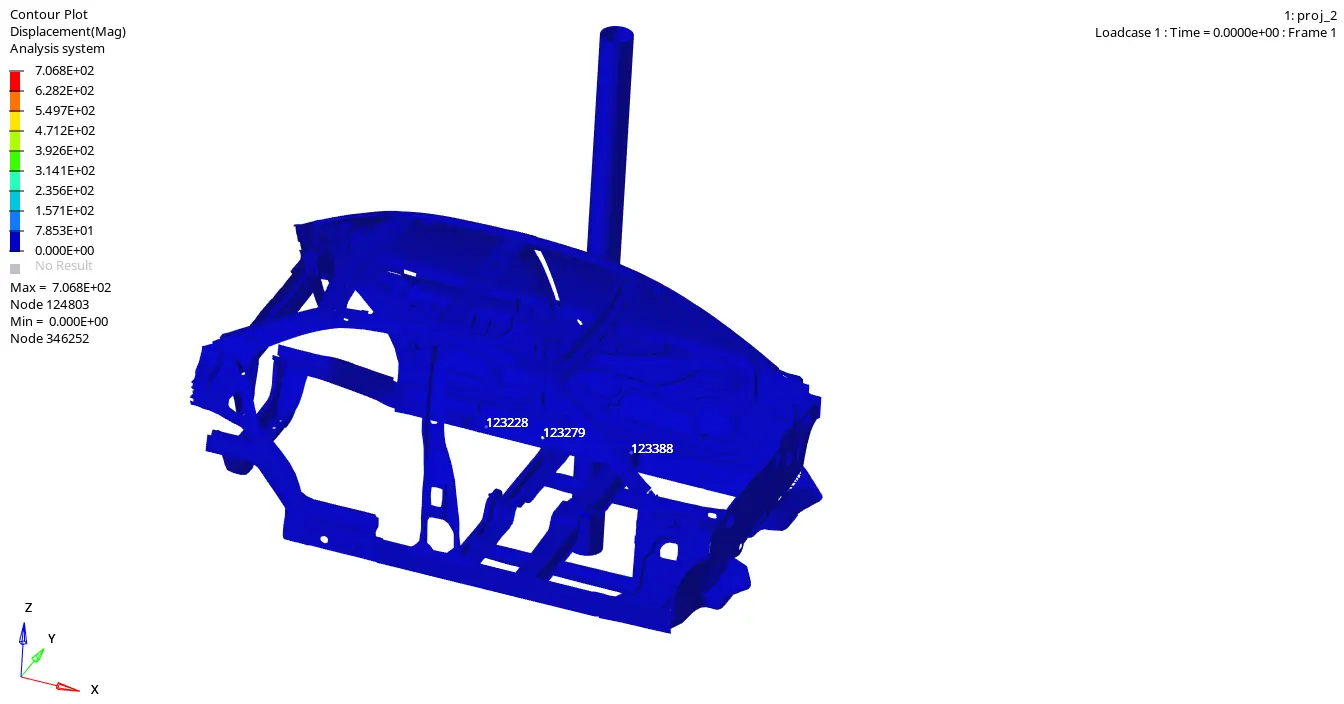
* Animation file is generated with the help of Hyperview workbench in Radioss. As per the animation in the initial stage the deformation takes place to the front door and the B pillar. Since the pole is cylindrical and vertical the area of the force applied to the BIW model is less and so the components comes in contact with the rigid pole starts absorbing energy and transfers to the rear door as well as the cross beams of the BIW model as shown above.
* Due to the acceleration of the BIW model the force applied by the rigid pole is more and so the absorption of energy by the components which comes in contact with the pole is high which leads to the deformation of all neighbouring components.
DISPLACEMENT
ENERGY PLOTS
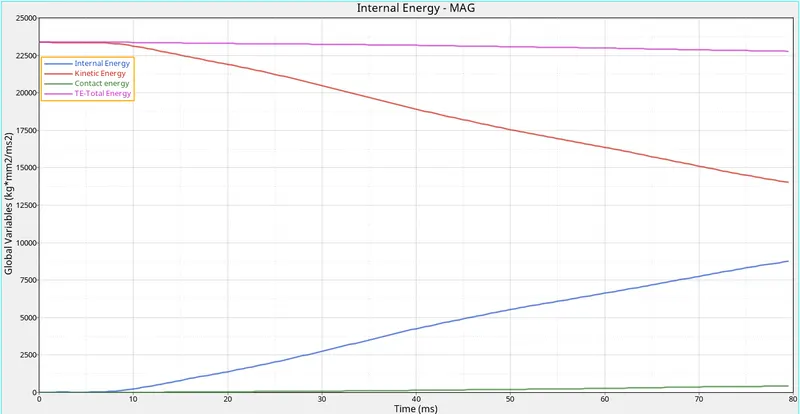
* Due to the kinetic energy the components opposes against the force applied by the rigid pole resulting in decrease in kinetic energy and increase in internal energy. The contact energy is almost stable throughout the simulation.
SECTIONS
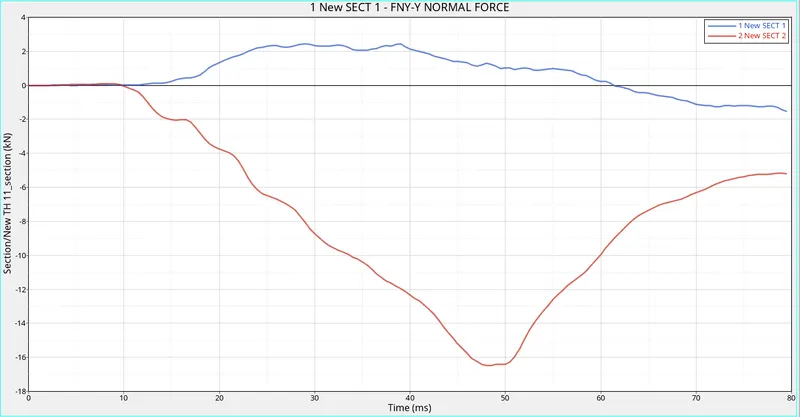
* The forces acting on the cross sectional areas of the cross bars are shown above. The normal force acting on the first cross bar is less compared to the second bar as it supported by another component which makes it more rigid whereas the second cross bar gets deformed easily due to its minimum stiffness and the force acting is negative.
INTRUSIONS
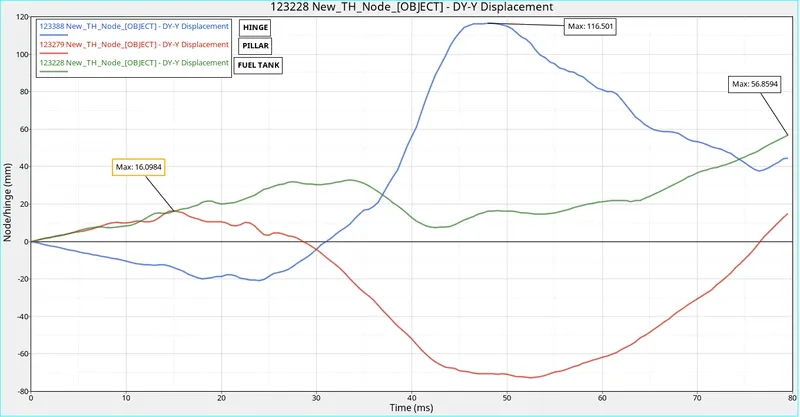
* The diplacement of three nodes from the specfied areas are shown above. The displacement of the node at the hinge portion is large compared to the other areas as the node on the hinge is close to the rigid pole where it makes large deformation.
* The maximum displacement of hinge node is 116.501 mm, pillar node is 16.09 mm and the fuel tank node makes a displacement of 56.85 mm.
* Improving material, strengthening elements or any sort of reinforcements of fuel tank helps in reducing intrusion.
PEAK VELOCITY
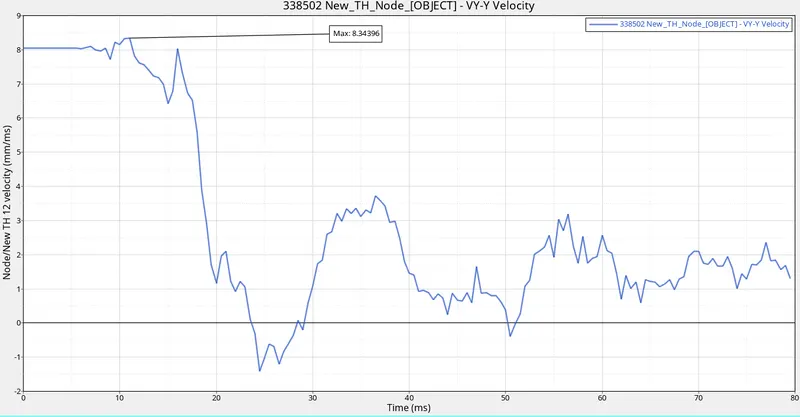
* The node near to the node makes a greater displacement attaining a peak velocity of 8.34 mm/ms which is slightly greater than the velocity of the vehicle. This is because as the model comes in contact with the pole at a certain speed the model gets deformed on the high absorption of energy and due to this deformation a force is developed which leads to a greater velocity of the node.
CONCLUSION
* As per the study the absorption of energy is more in B pillar and the cross members as both of the parts gets deformed adversely.
* Reniforcement is required at the cross members and material improvement or strengthening elements in B pillar.
* The results are used to assess both the crashworthiness and to investigate the ways to improve the design.