Side Crash Analysis of an Automobile
Side Crash Analysis of an Automobile
Objective:
To study and analyse the impact on the lateral structure of an automobile during a crash (T-Bone crash).
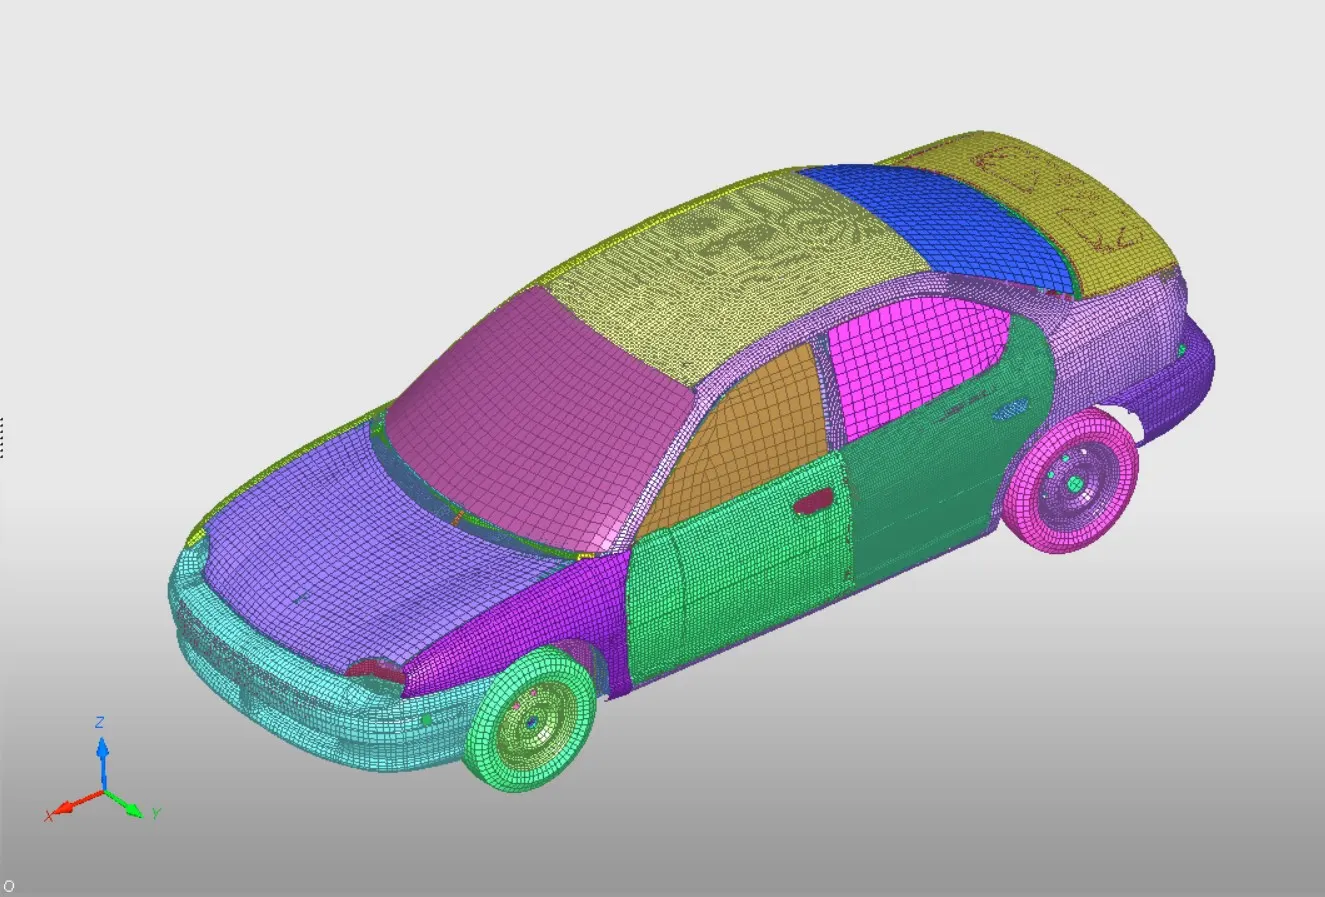
Procedure:
Step 1: Import the solver deck (.rad) file and ensure all the recommended shell properties are assigned.
Step 2: Make a new directory/folder and run the simulation, so that the new files for each case are organised.
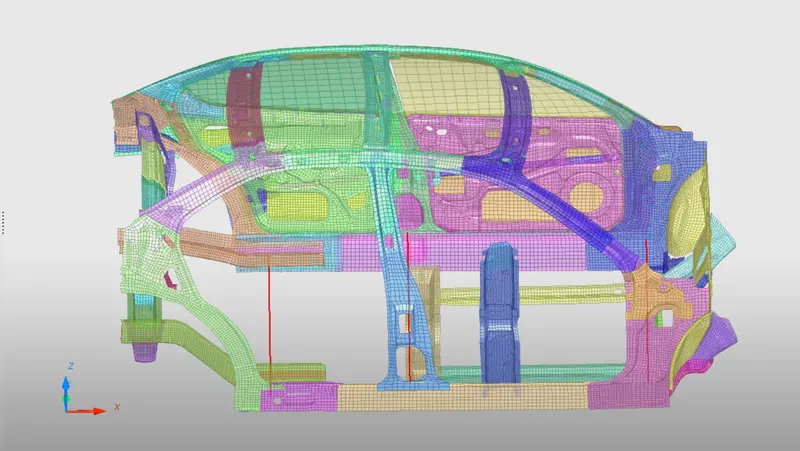
Step 3: The reduced model of the lateral structure of an automobile with only one pair of passenger door is set up for the analysis owing to the student license constraints on node number limitations. The setup process involves making multiple relevant changes to the imported model.
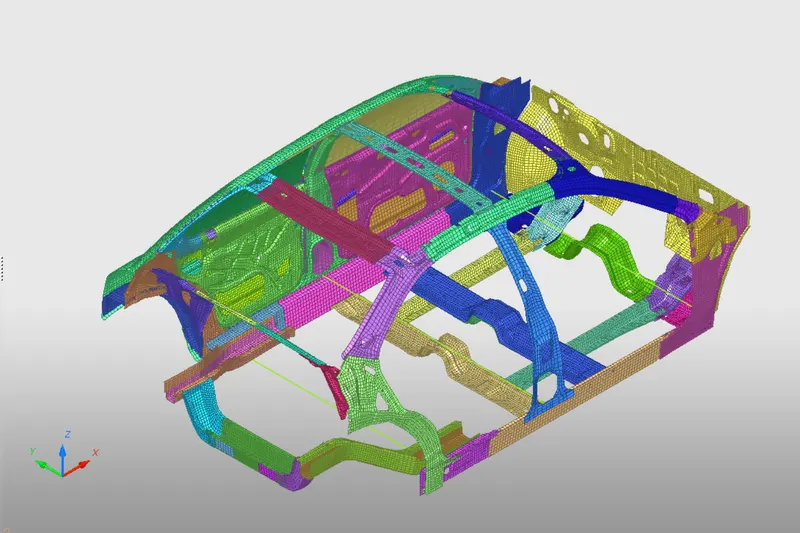
Step 4: The model checker is used to ensure no errors, before executing the simulation.
Step 5: Then create a split-window layout to accommodate HyperView and HyperGraph 2D, to open and read data .h3d and T01 files in respective layouts.
Step 6: The resulting data is then tabulated and compared to fetch the results.
Simulation Setup:
- The consistency in the unit system must be confirmed throughout and kg, mm, ms is followed in this analysis study.
- There were some preset interfaces and solver mass components on import. This can be deleted as they are redundant.
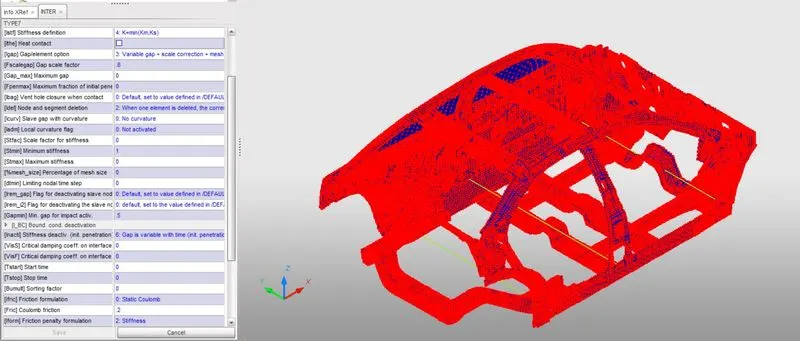
- The contact interface of Type 7 is created as per the given specifications with the best-recommended options.
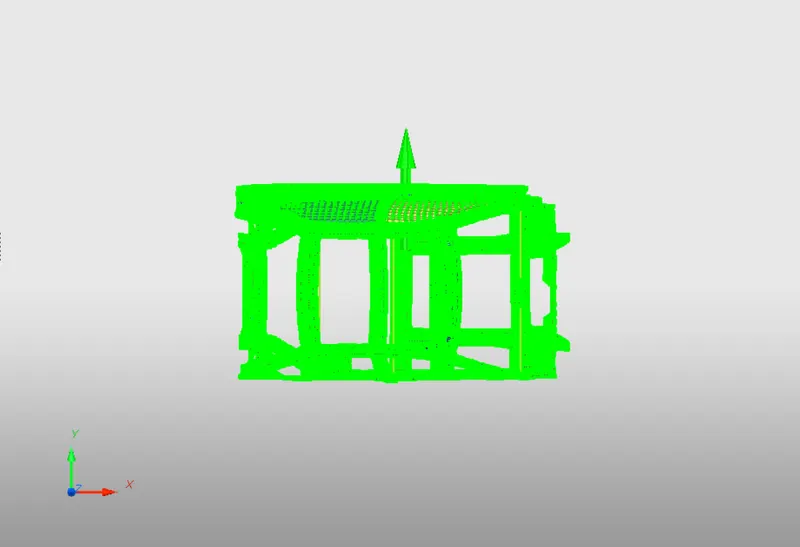
- An initial velocity of 35mph (15.65 m/s or 15.65 mm/ms) towards positive X-direction is added on the entire structure.
- A side pole is constructed with the standard industrial properties. The specifications of the constructed side pole are below mentioned.
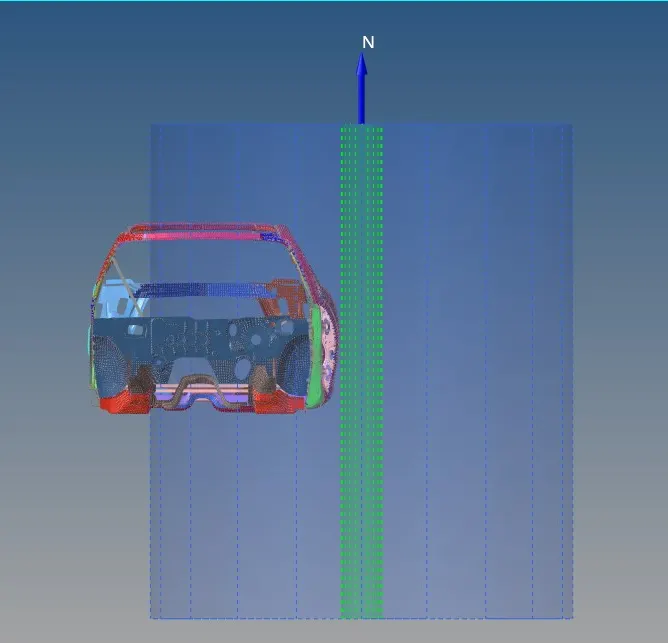
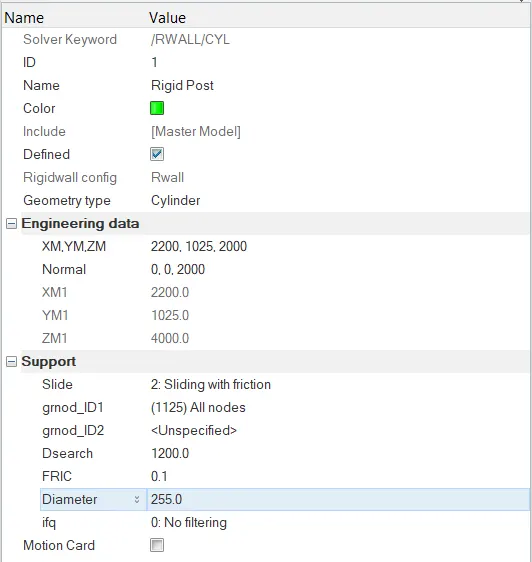
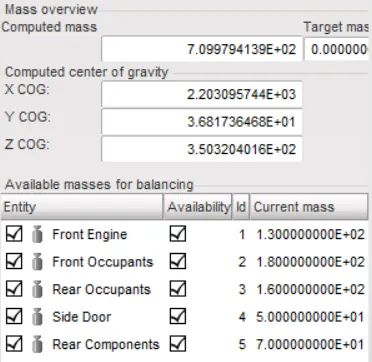
- The model used here is a reduced version of the complete structure, that weighs 700 kg, so the reduced model is added with solver masses at reasonable locations, to compensate for the mass reduction and also to the shift the Center of Gravity of the model to its actual position as in the original complete version. The initial mass of the reduced lateral structure is 120 kg. Solver mass components of 590 kg are added to replicate the original complete structure. The added mass components and the shifted CoG and its locations are given below.
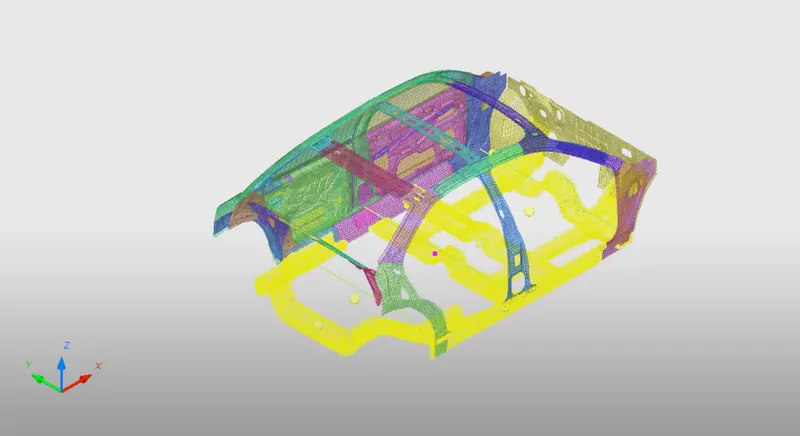
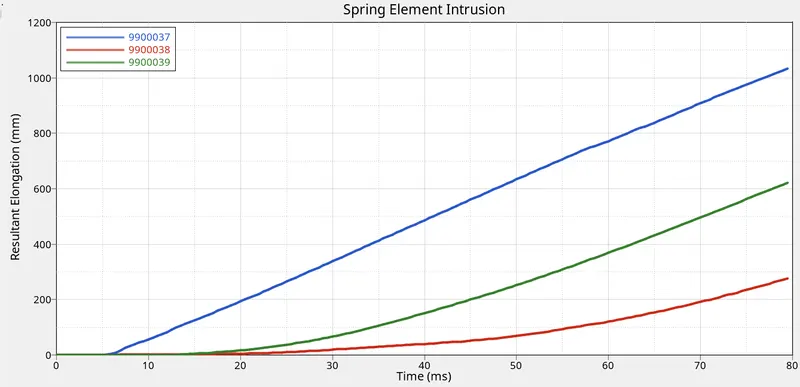
- To determine the intrusion in the B-Pillar, Hinge Pillar and Fuel Tank regions, three springs of mass, 0.02 kg and stiffness, 1e-07 kN/mm are added in the specified locations in the image below as dark red coloured components. The elongation recorded in the springs during the crash can be used to study the intrusion of the sidewall at different locations.
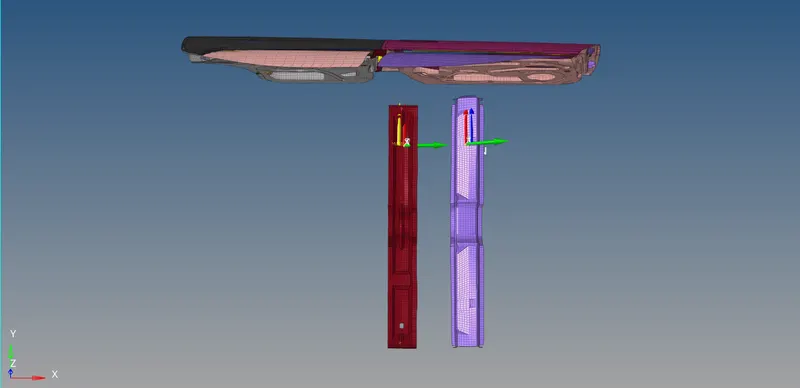
- The cross-sections are created across the two cross members to study the impact forces experienced on crash.
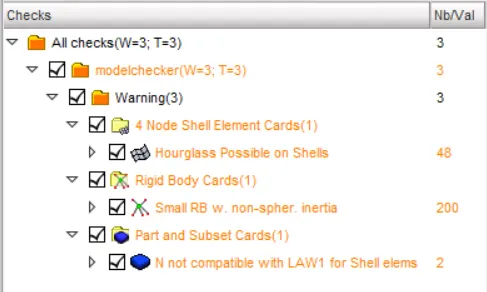
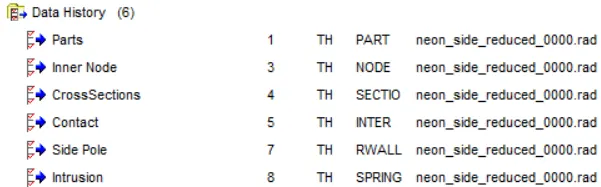
- The model is initially, intermittently and finally checked for any errors, that can result in incorrect results or even a no-execution state. The tree connectivity is performed for checking the proper connectivity of the various components. The penetration and intersection checks are also performed to avoid any flawed results. There is no penetration/intersection on the model. Then, the model checker is run to ensure zero errors before simulation runs. All the errors are rectified, eventually by applying appropriate corrections. Also, the output requests for different components are created in the model, as shown below, to extract the variable time history and other useful data for inference.
Simulation Data:
- The simulation is executed with Tfreq = 0.5 ms.
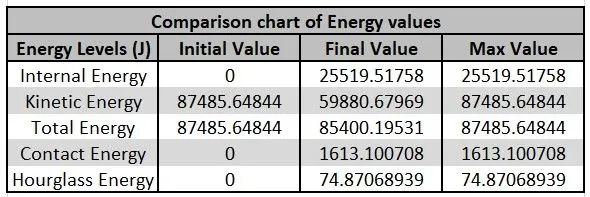
- The mass error and energy error are observed to be 0.6% (negligible) and -2.0%, respectively. Both these error values are well below the acceptable error limits.
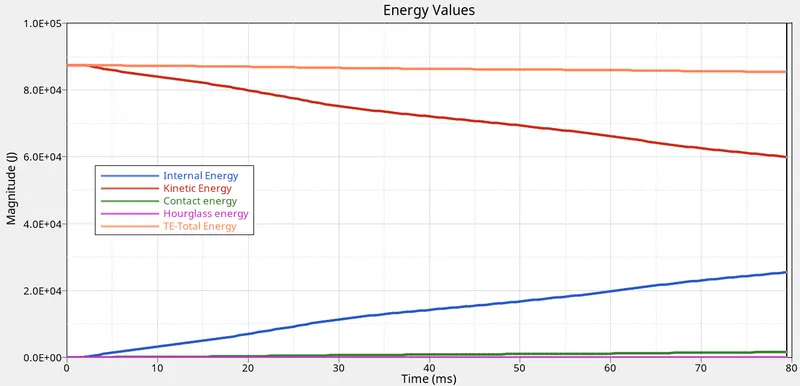
- The various energy values during the simulation are tabulated and depicted in the graph.
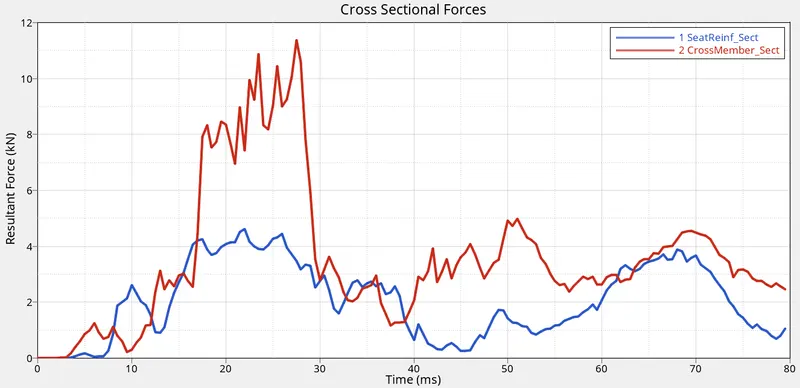
- The forces captured at the two different cross-sections are tabulated and the graphs are attached.

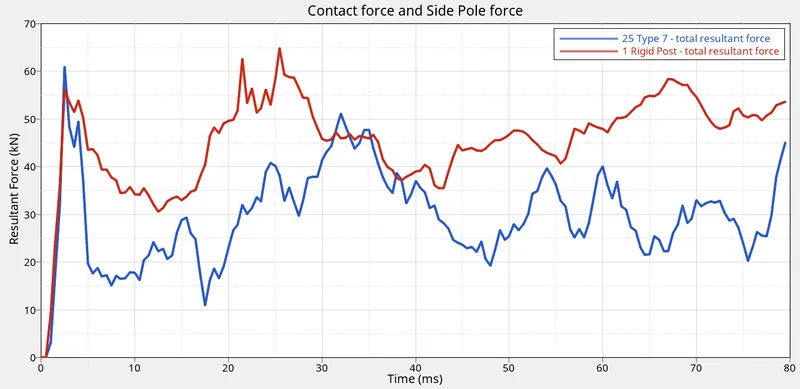
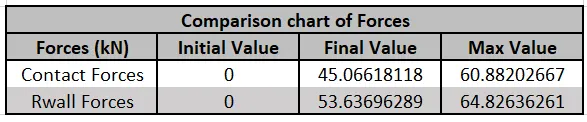
- The resultant Side Pole (RWALL) and Contact Interface forces generated due to the crash are also tabulated.
- The intrusion in the side wall at various locations (B-Pillar, Hinge Pillar, Fuel Tank) corresponds to the elongation read in the three springs created and the same is charted.

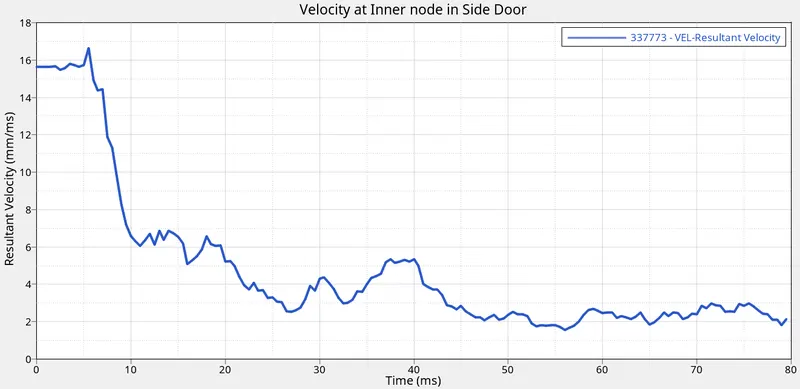
- The velocity at an arbitrary inner node of the side door is observed during the simulation and the peak velocity is observed as 16.65 mm/ms or 16.65 m/s.
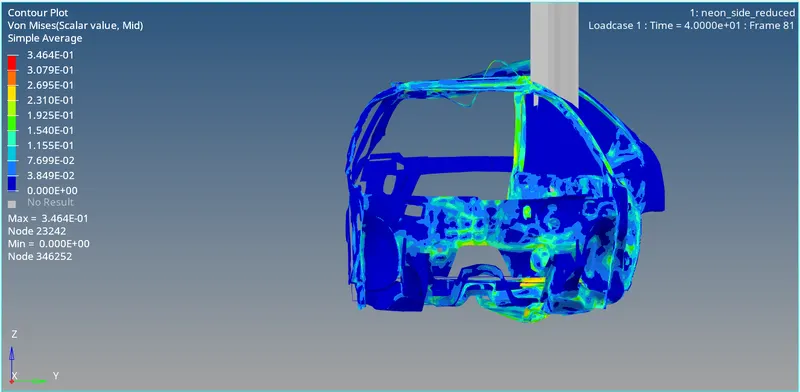
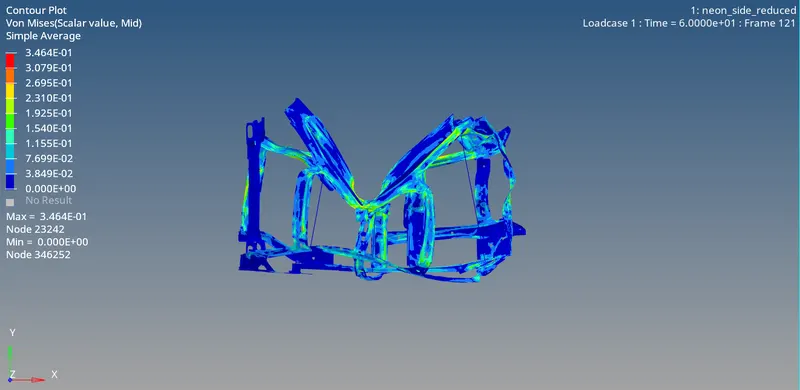
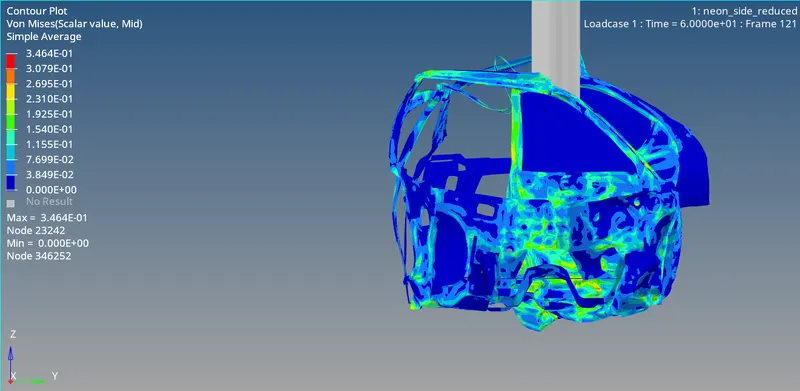
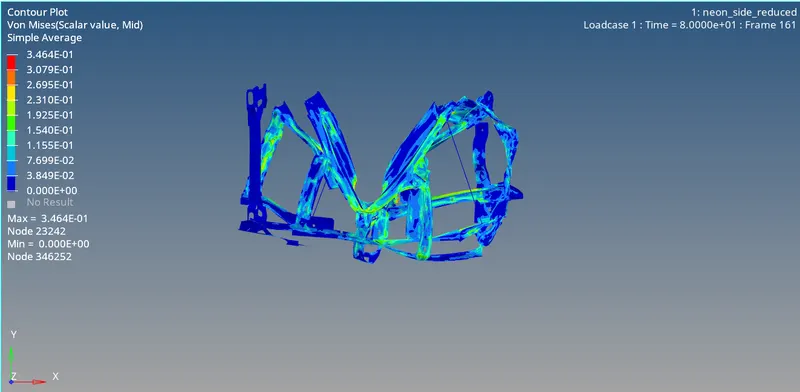
- The screenshots of the simulation are captured at multiple time frames - t = 0ms, 20ms, 40ms, 60ms, 80ms, and the same are attached, hereby.
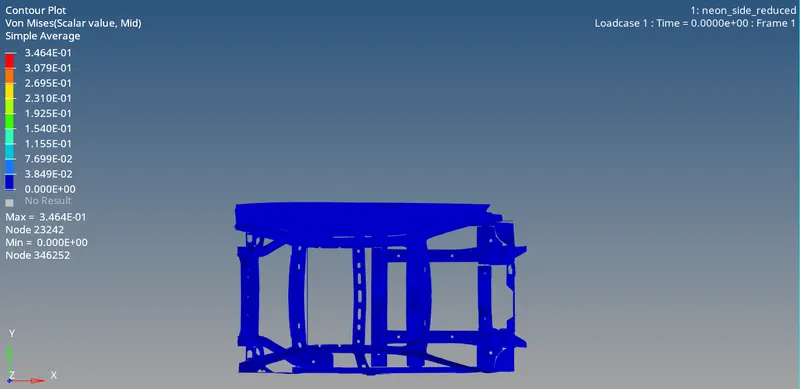
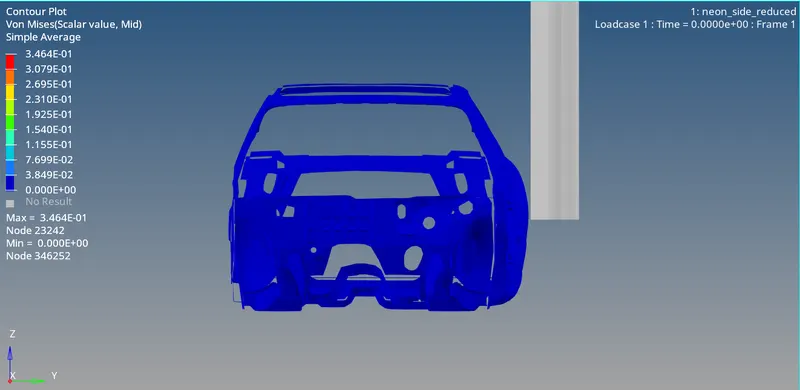
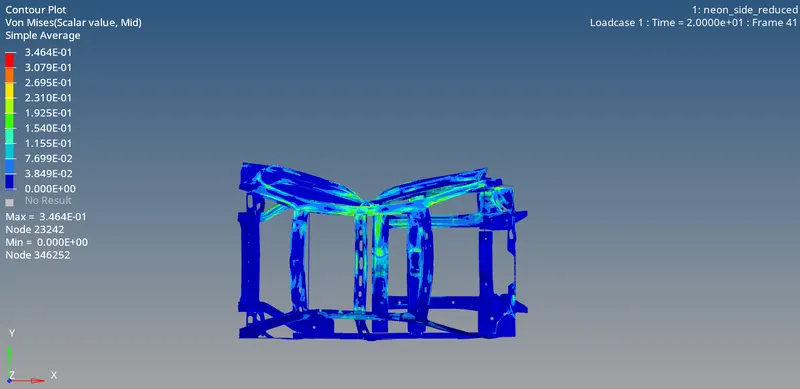
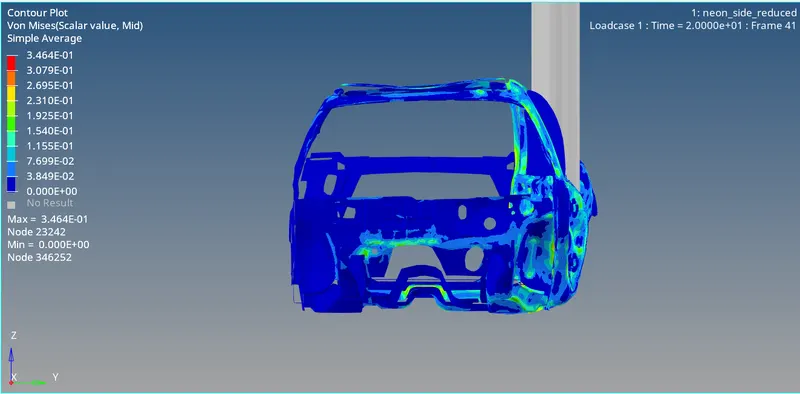
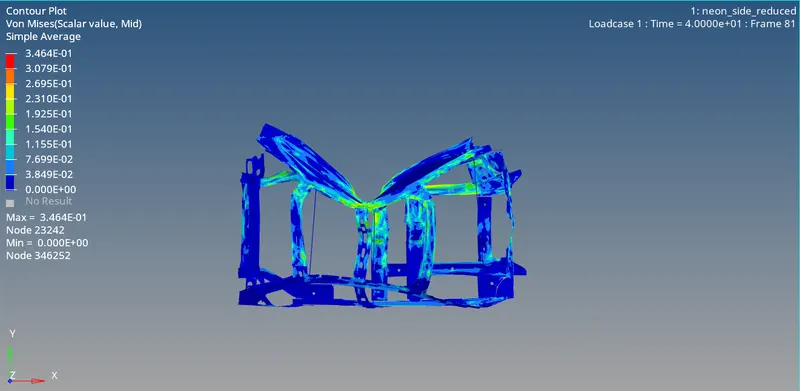
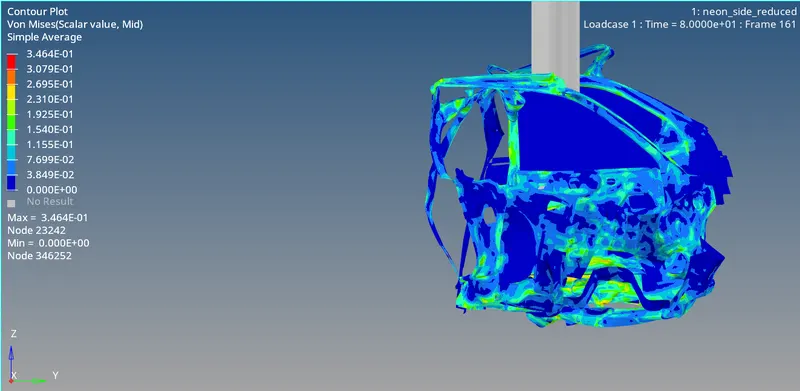
NOTE: There were some rendering issues in the software so the side pole is not displayed completely in the graphics area.
Results and Inference:
- The discrepancy in results compared to the original complete model or the actual scenario can be attributed to the missing components like engine, wheels and also other compromises made on the reduced model.
- The differences between the cross-sectional forces between the two cross members are evident as the cross-section created in the mid-rail component has observed more force compared to the cross member at the seat reinforcement cross member, as expected.
- The intrusions are estimated using the resultant elongation values of the springs created at the specified locations. The elongation values and the intrusions observed are in line with the crash simulation observed as the spring near the B-Pillar had intruded more than the other two.
- To mitigate the intrusion at the fuel tank region, we can add one more cross-member.
P.S. Due to upload size constraints the h3d file is not included in the zip file instead the animation gifs are uploaded as per the instructor's comment.