Frontal Crash Analysis of an Automobile
Frontal Crash Analysis of an Automobile
Objective:
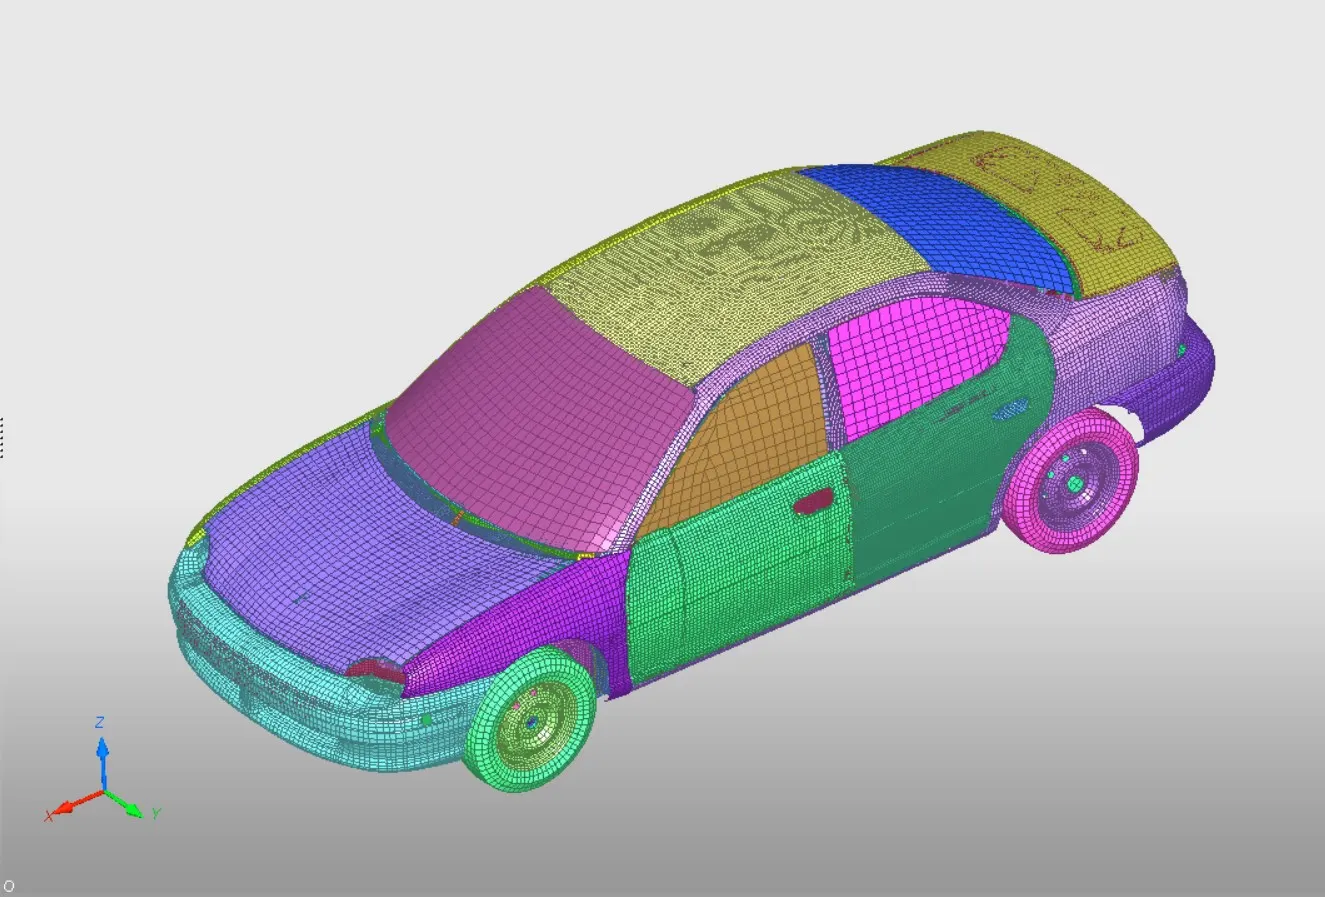
To study and analyse the impact on the frontal structure of an automobile during a crash.
Procedure:
Step 1: Import the solver deck (.rad) file and ensure all the recommended shell properties are assigned.
Step 2: Make a new directory/folder and run the simulation, so that the new files for each case are organised.
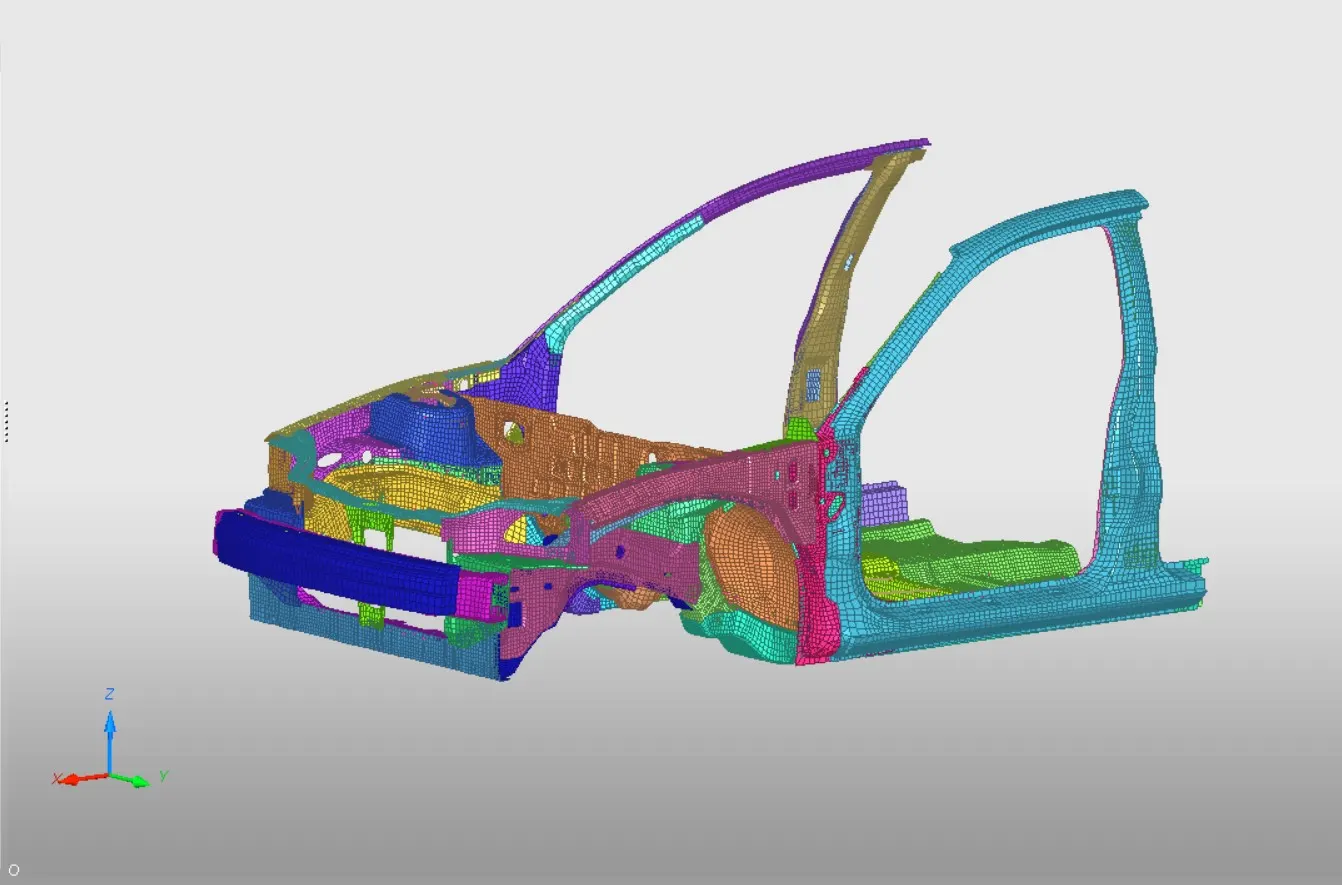
Step 3: The reduced model of the frontal structure of an automobile is set up for the analysis owing to the student license constraints on node number limitations. The setup process involves making multiple relevant changes to the imported model.
Step 4: The model checker is used to ensure no errors, before executing the simulation.
Step 5: Then create a split-window layout to accommodate HyperView and HyperGraph 2D, to open and read data .h3d and T01 files in respective layouts.
Step 6: The resulting data is then tabulated and compared to fetch the results.
Simulation Setup:
- The consistency in the unit system must be confirmed throughout and kg, mm, ms is followed in this analysis study.
- There were some preset interfaces and solver mass components on import. This can be deleted as they are redundant.
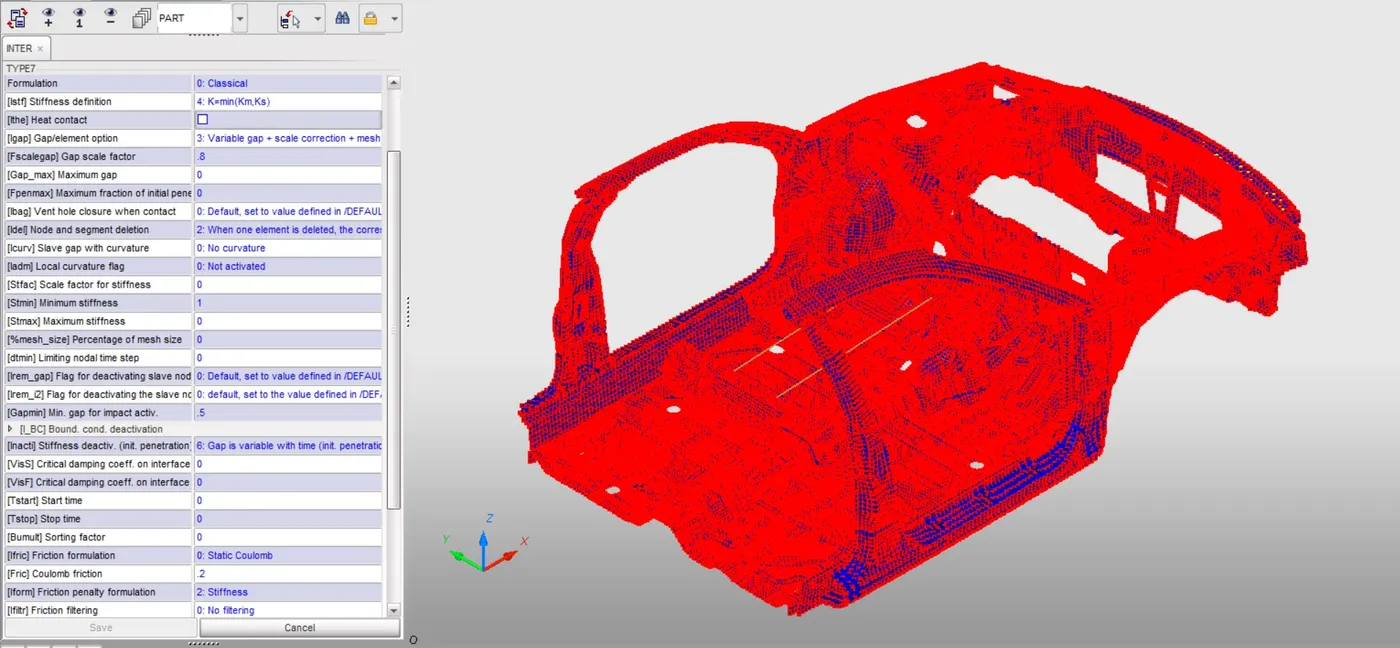
- The contact interface of Type 7 is created as per the given specifications with the best-recommended options.
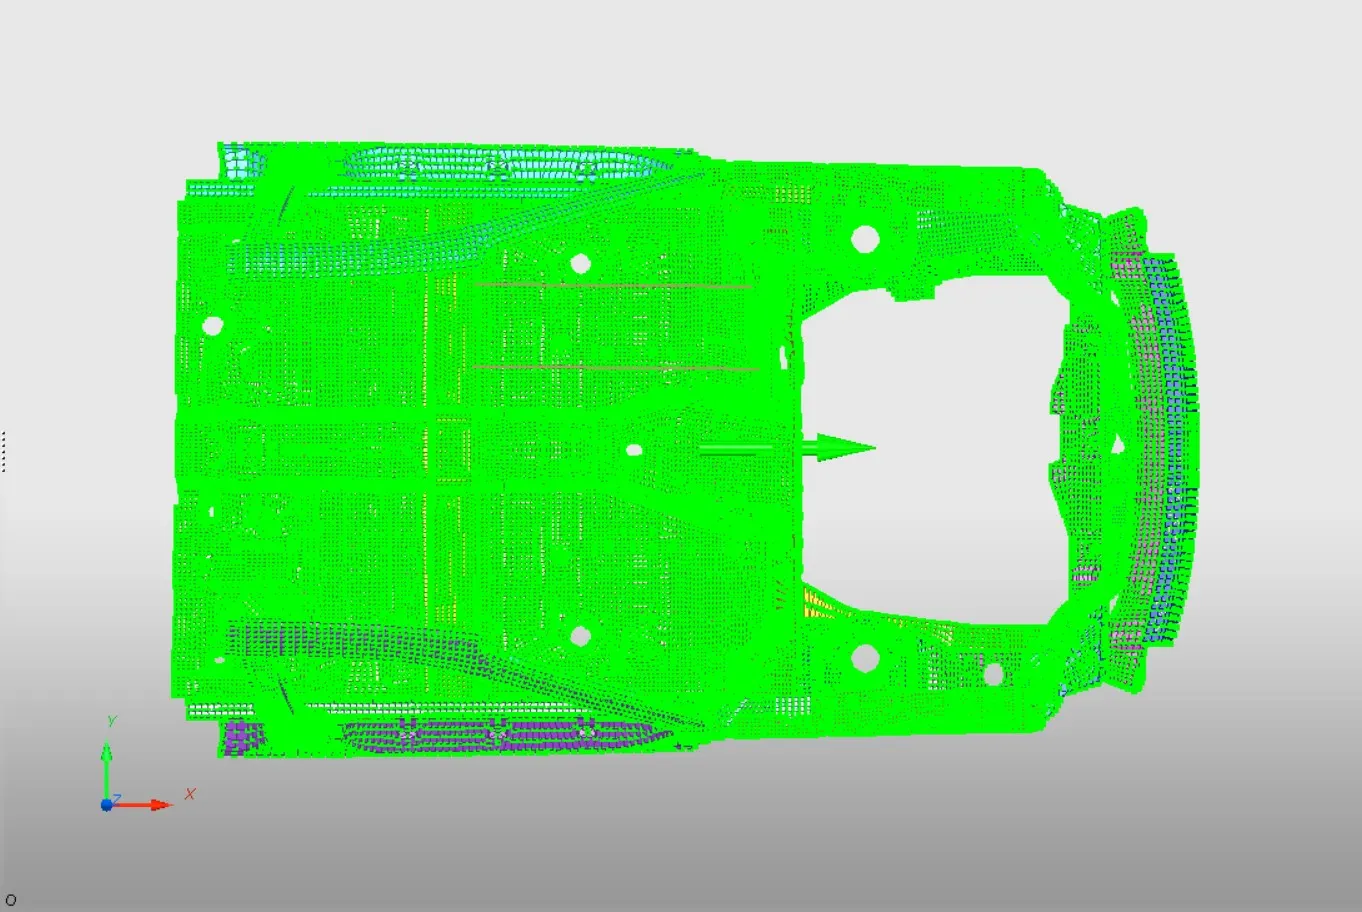
- An initial velocity of 35mph (15.65 m/s or 15.65 mm/ms) towards positive X-direction is added on the entire structure.
- A rigid wall is constructed with the prescribed properties, also referring to the complete car model file. The specifications of the constructed rigid wall are below mentioned.
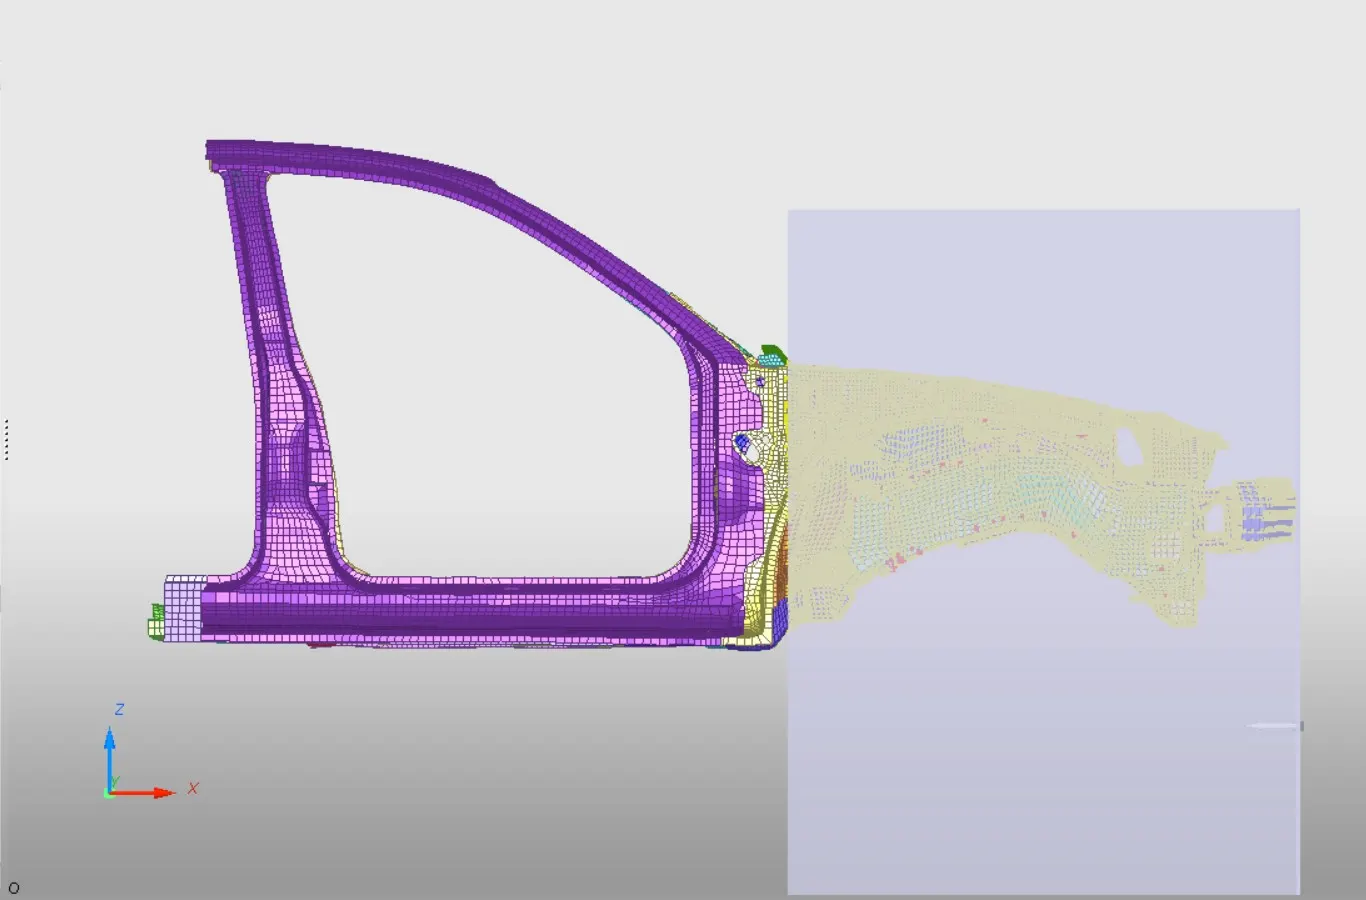
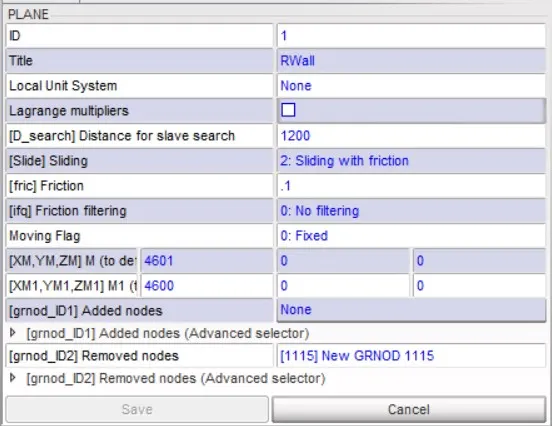
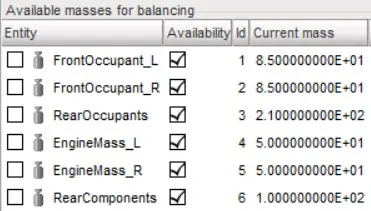
- The model used here is a reduced version of the complete structure, that weighs 700 kg, so the reduced model is added with solver masses at reasonable locations, to compensate for the mass reduction and also to the shift the Center of Gravity of the model to its actual position as in the original complete version. The initial mass of the reduced frontal structure is 188 kg. Solver mass components of 510 kg are added to replicate the original complete structure. The added mass components and the shifted CoG and its locations are given below.
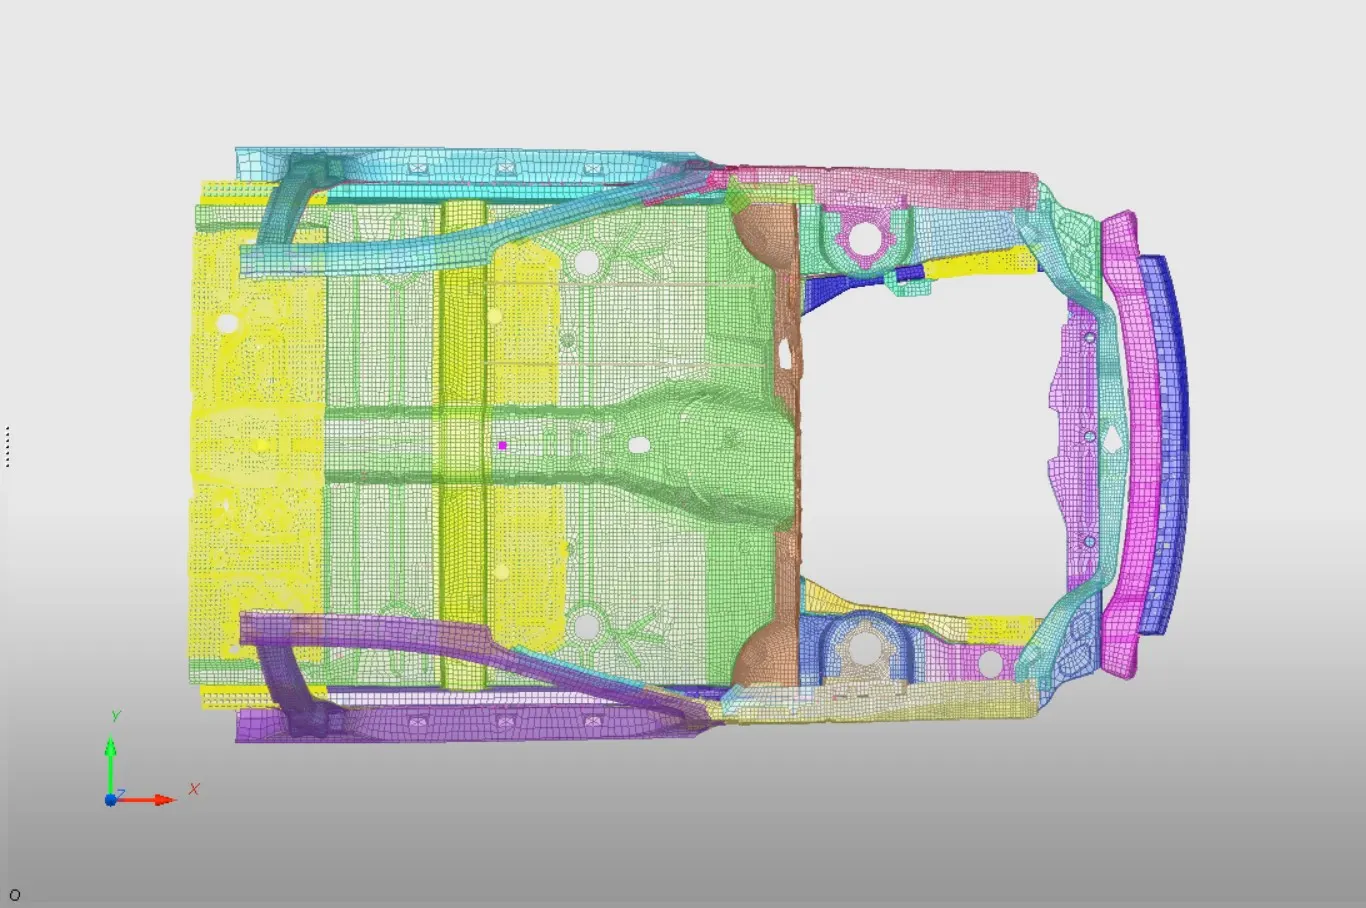
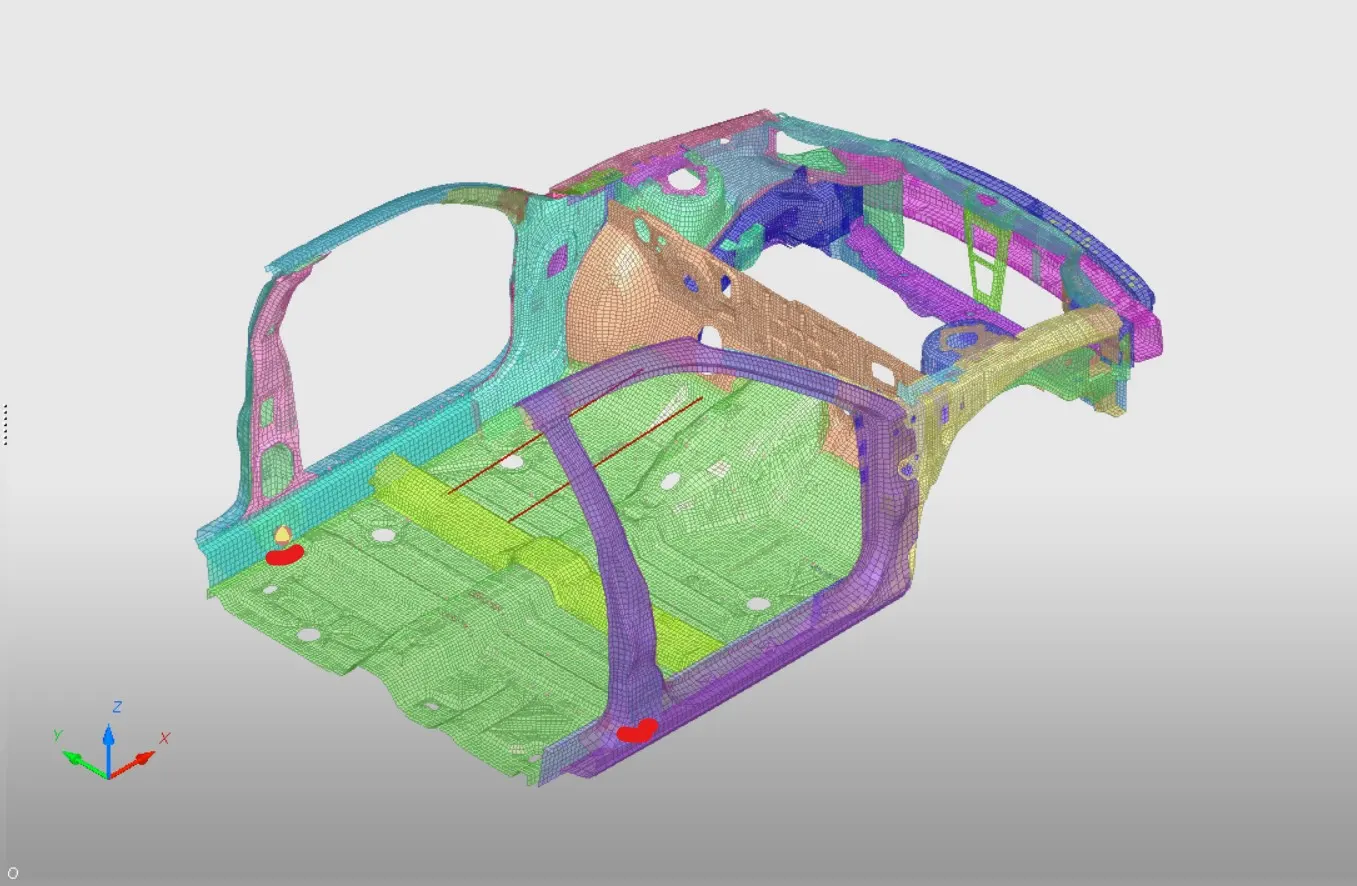
- To determine the intrusion in the driver legroom region and to ensure his safety, two springs of mass, 0.02 kg and stiffness, 1e-07 kN/mm are added in the specified nodal locations - 66695 and 66244. The elongation recorded in the springs during the crash can be used to study the intrusion of the dash wall. Also, two accelerometers are added to the bottom rocker rails, in the following nodal locations - 123346 and 124340, to observe the impact and the mitigation time to halt on a crash.
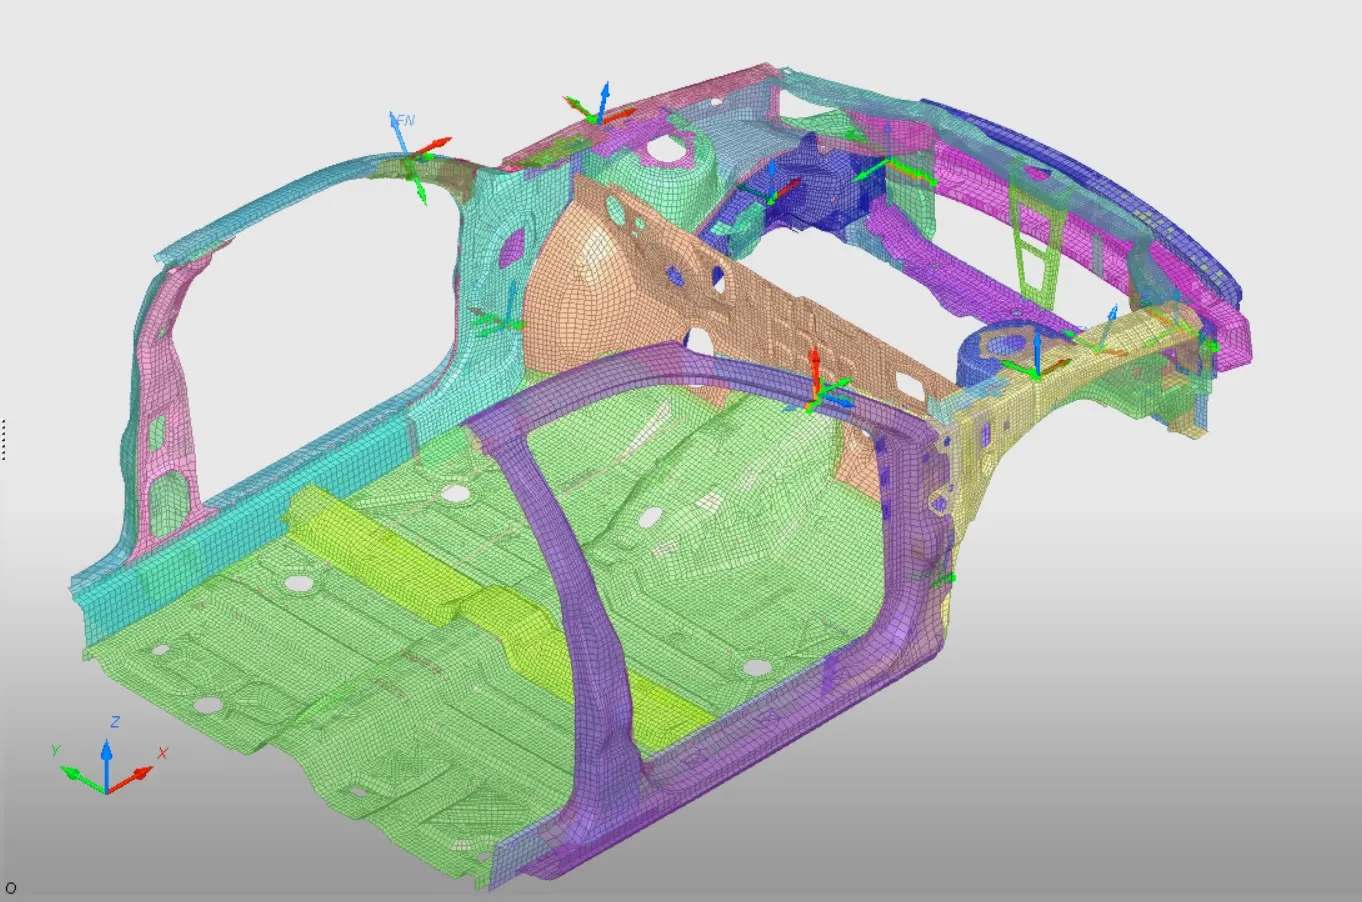
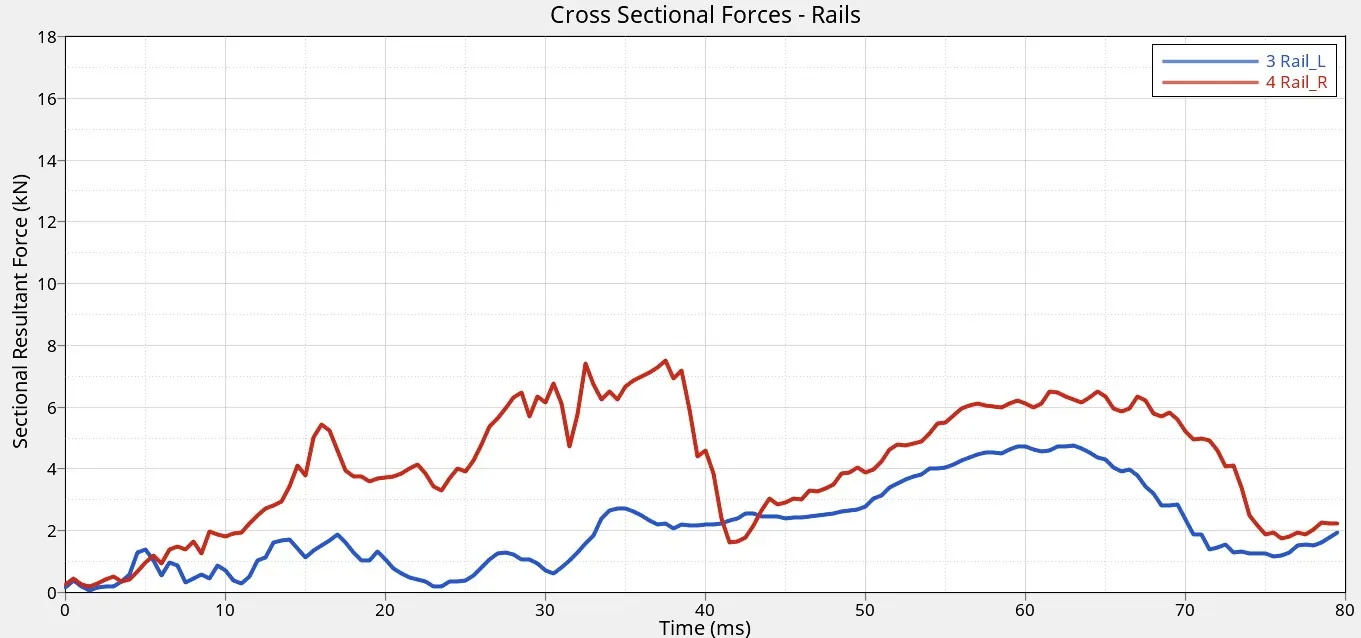
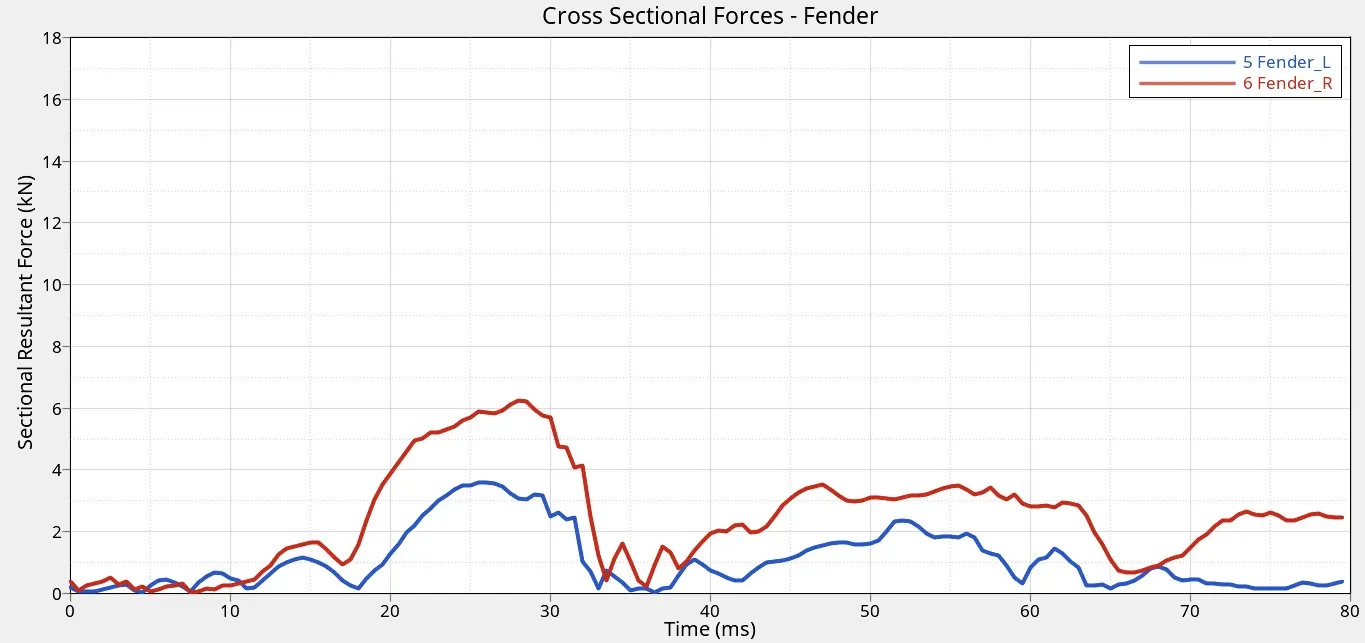
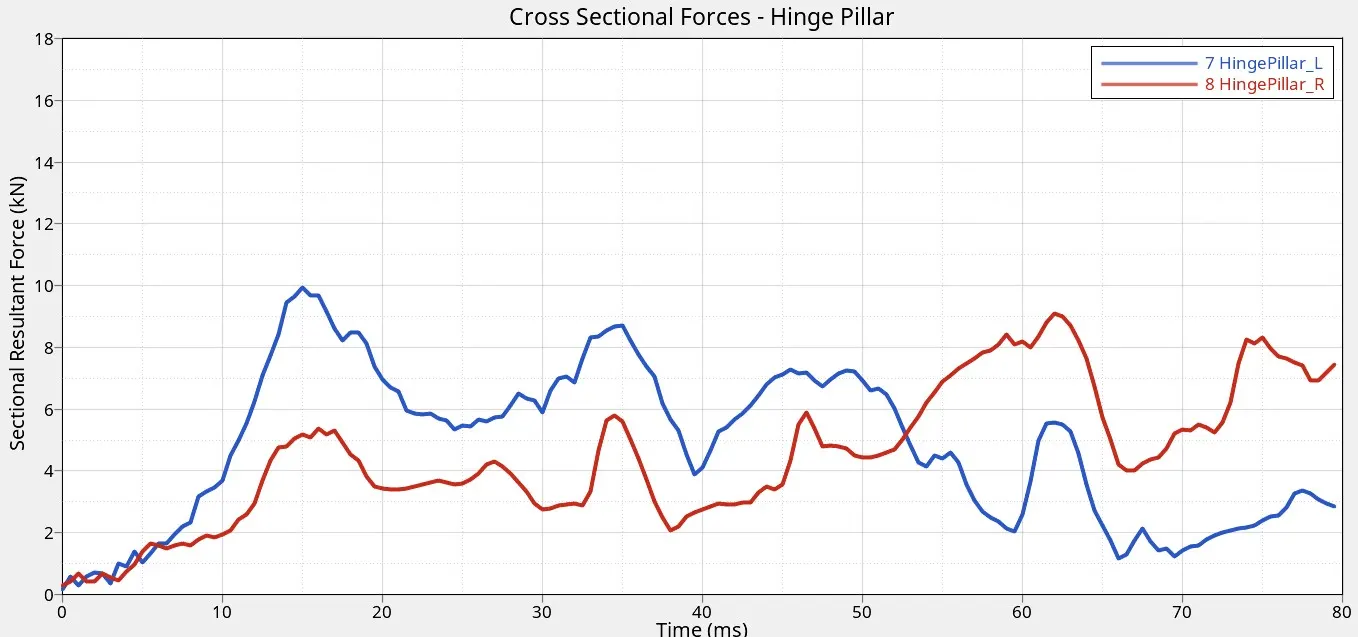
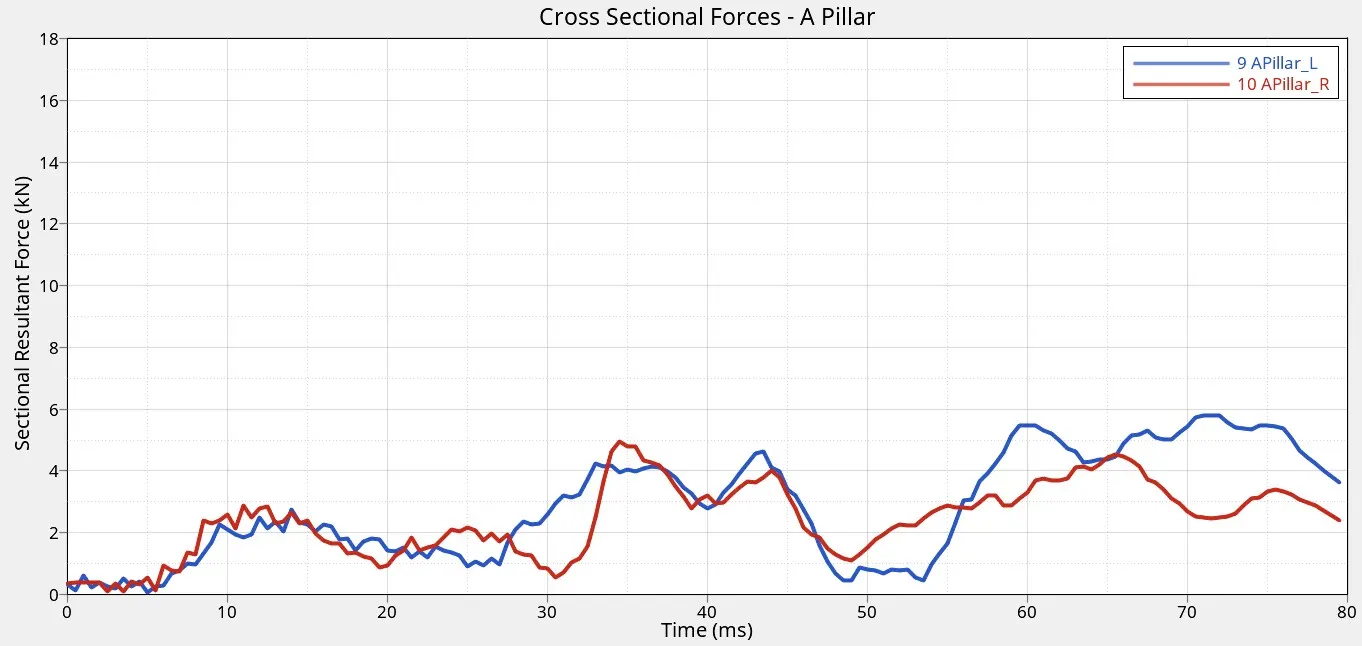
- The cross-sections are created across different components to inspect the impact force distribution in the structure, post-impact. The cross-sections are created at both symmetrical components of Shotgun, Rails, Fender, Hinge Pillar and A-Pillar as below.
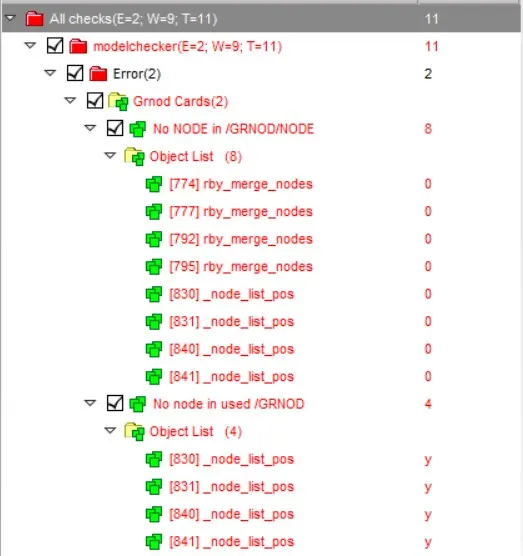
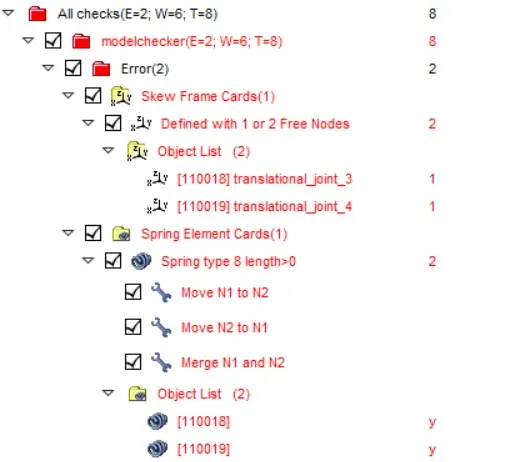
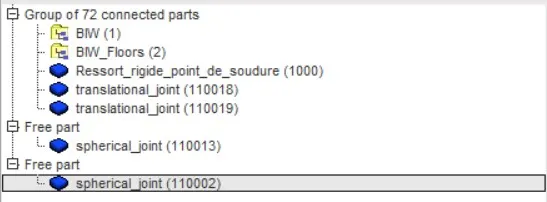
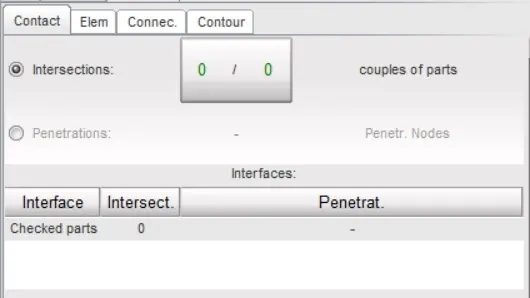
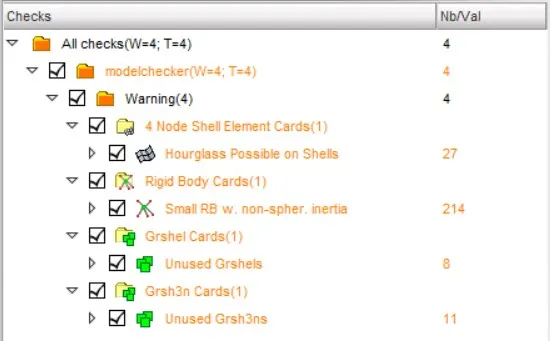
- The model is initially, intermittently and finally checked for any errors, that can result in incorrect results or even a no-execution state. The tree connectivity is performed for checking the proper connectivity of the various components. The spherical springs, originally attached to the other assemblies, existed in the model are removed as the part was not connected to any component. The penetration and intersection checks are also performed to avoid any flawed results. There is no penetration/intersection on the model. Then, the model checker is run to ensure zero errors before simulation runs. All the errors are rectified, eventually by applying appropriate corrections.
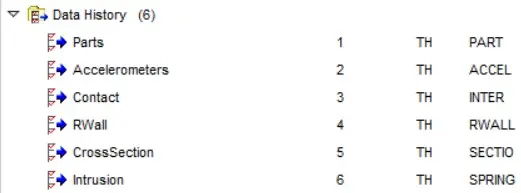
- Finally, the output requests for different components are created in the model, as shown below, to extract the variable time history and other useful data for inference.
Simulation Data:
- The simulation is executed with Tfreq = 0.5 ms.
- The mass error and energy error are observed to be 3% and -2.5%, respectively. Both these error values are well below the acceptable error limits.
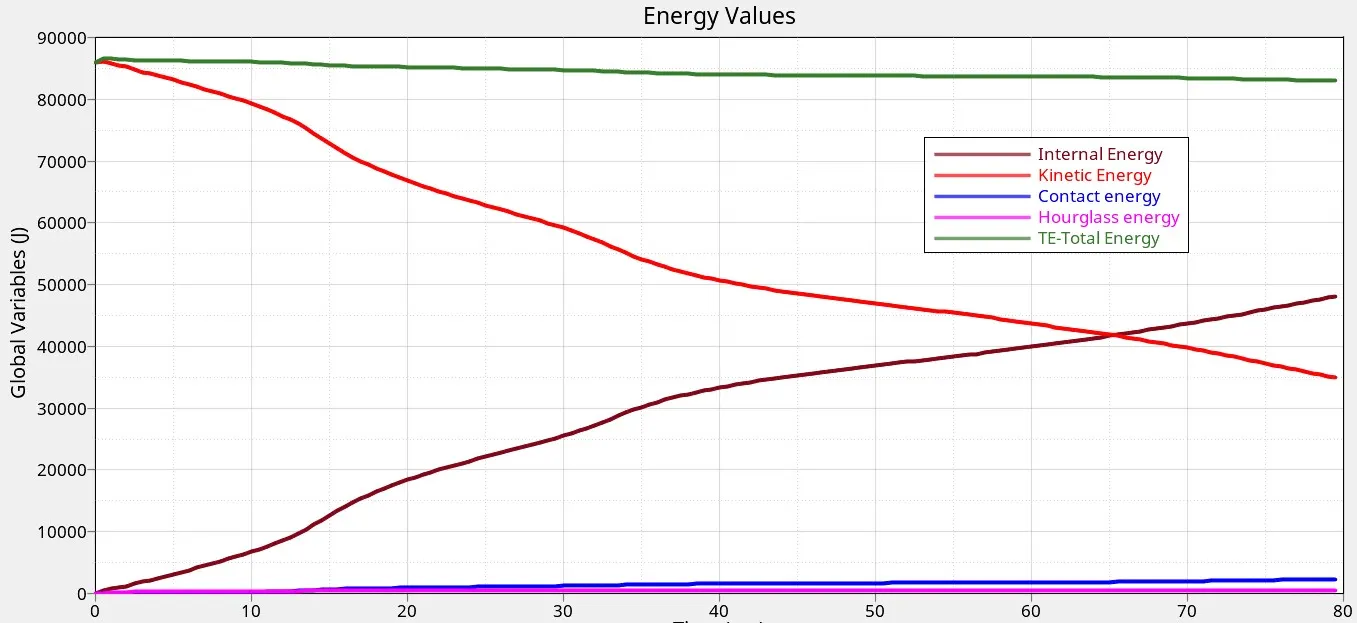
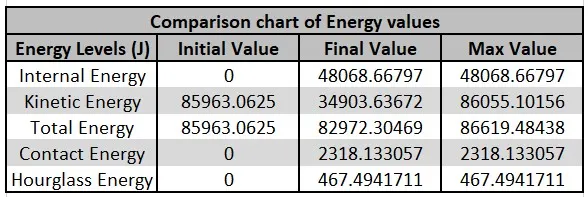
- The various energy values during the simulation are tabulated and depicted in the graph.
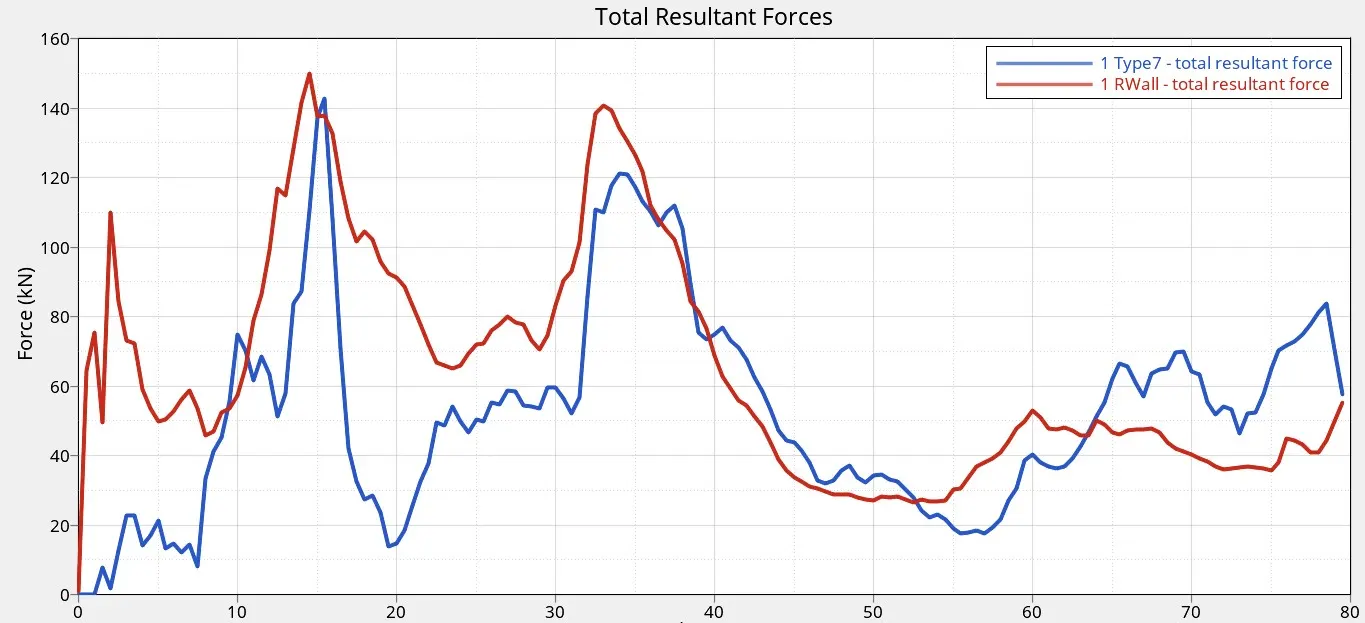
- The resultant R-Wall and Contact Interface forces generated due to the crash are also tabulated.

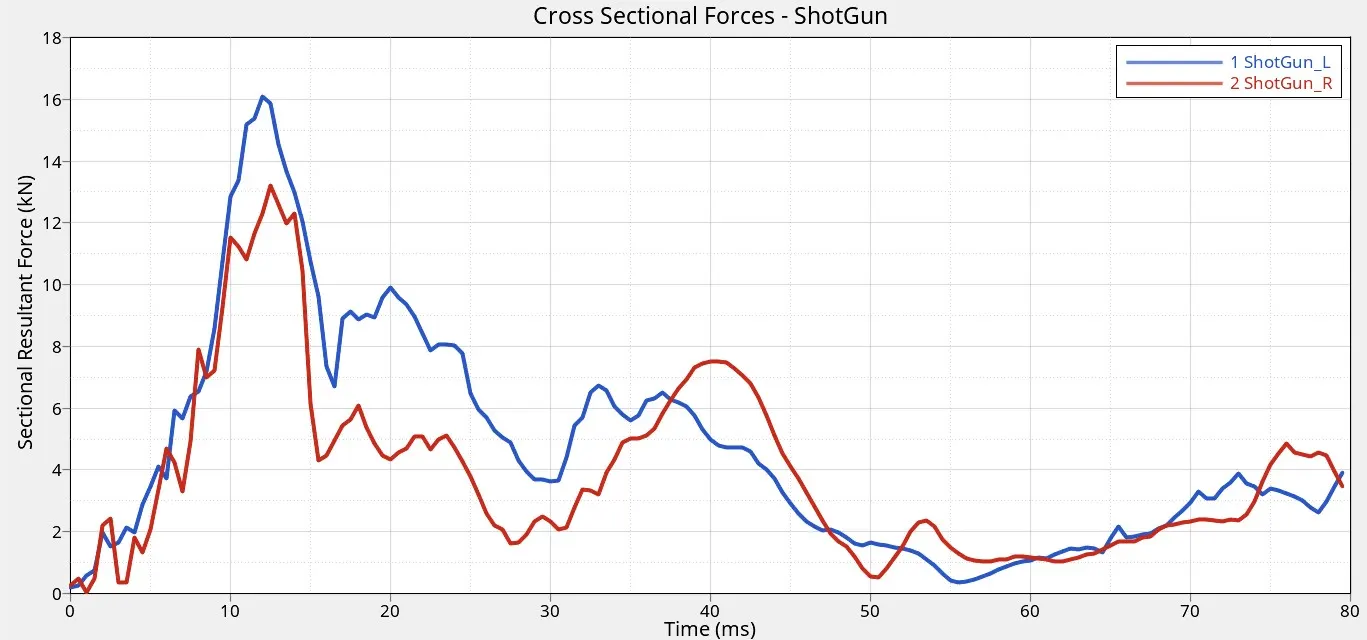
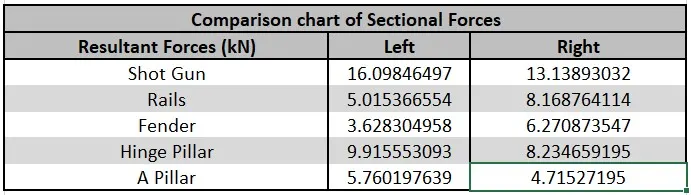
- The forces captured at the different cross-sections are tabulated and the graphs are attached.
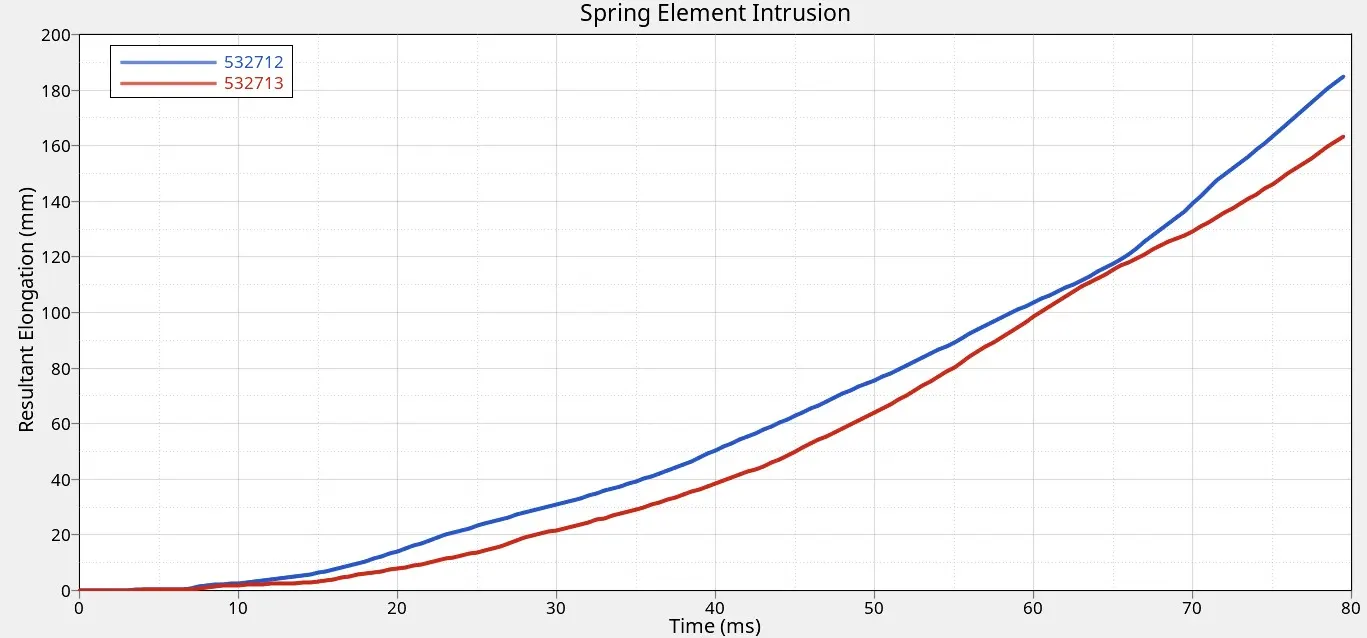
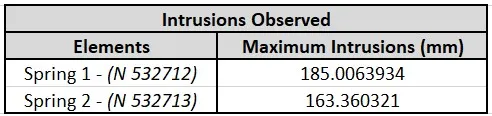
- The intrusion in the dash wall corresponds to the elongation read in the springs created and the same is charted.
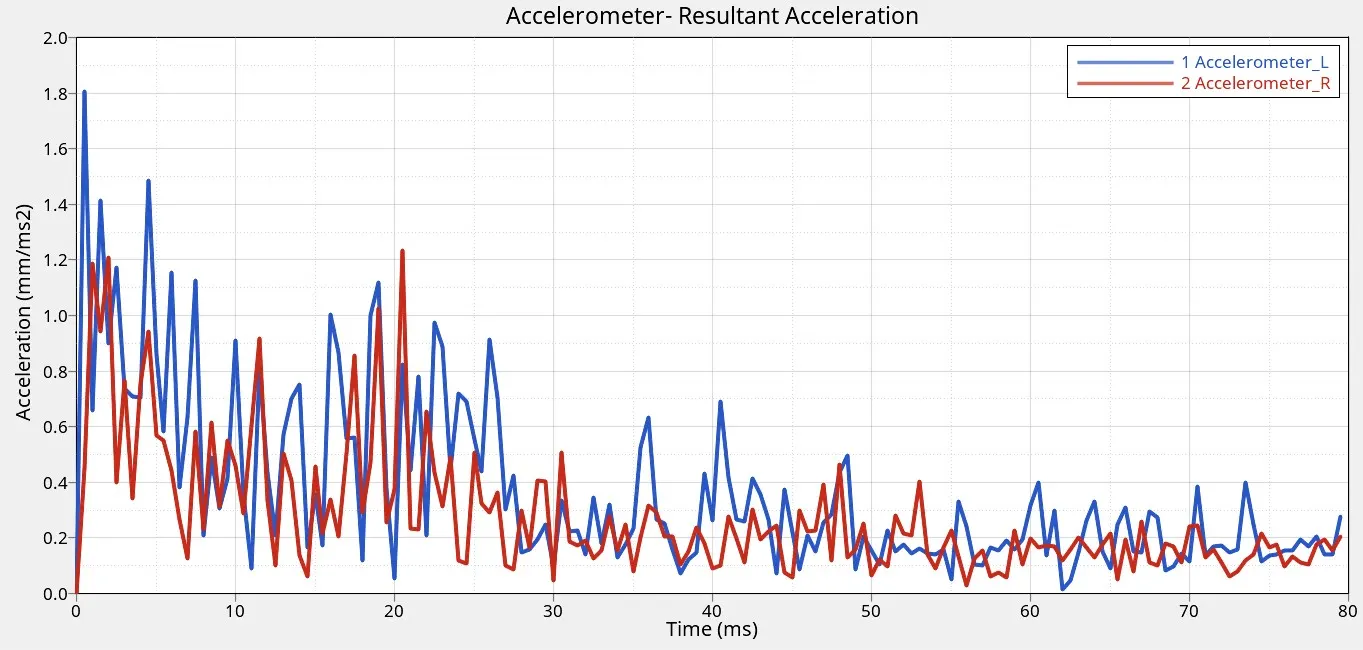
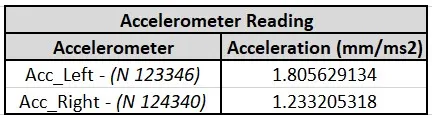
- The acceleration readings from both the accelerometer sensors are also captured.
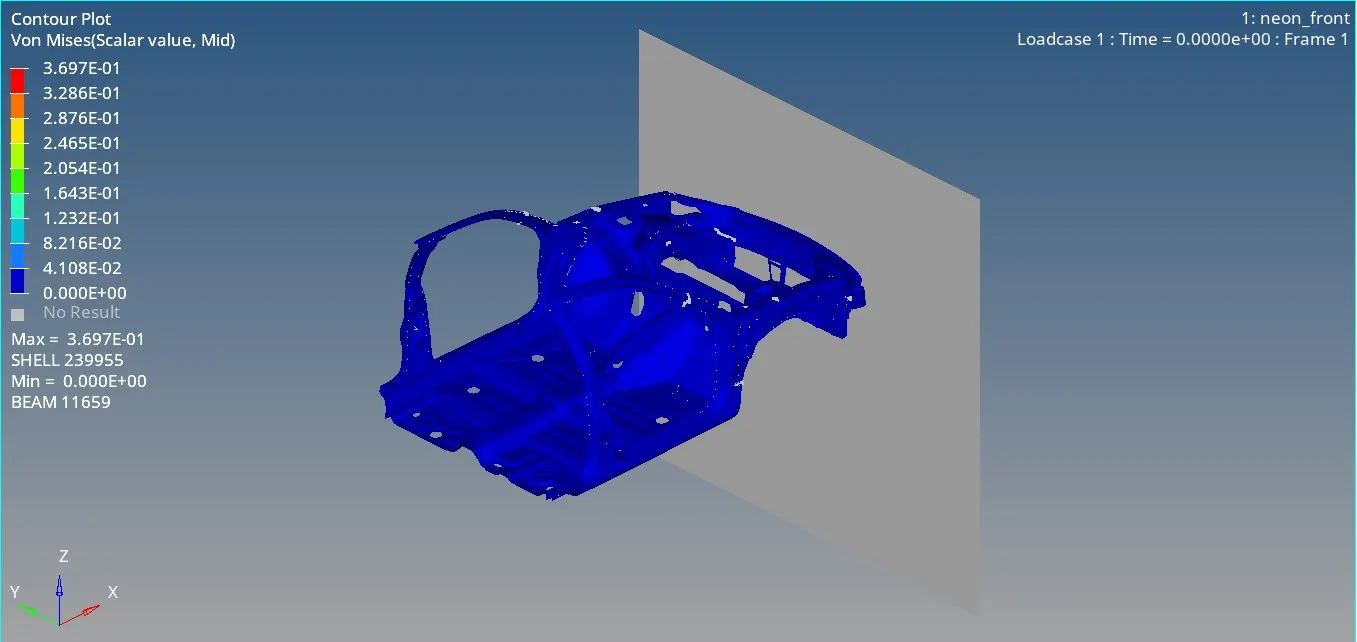
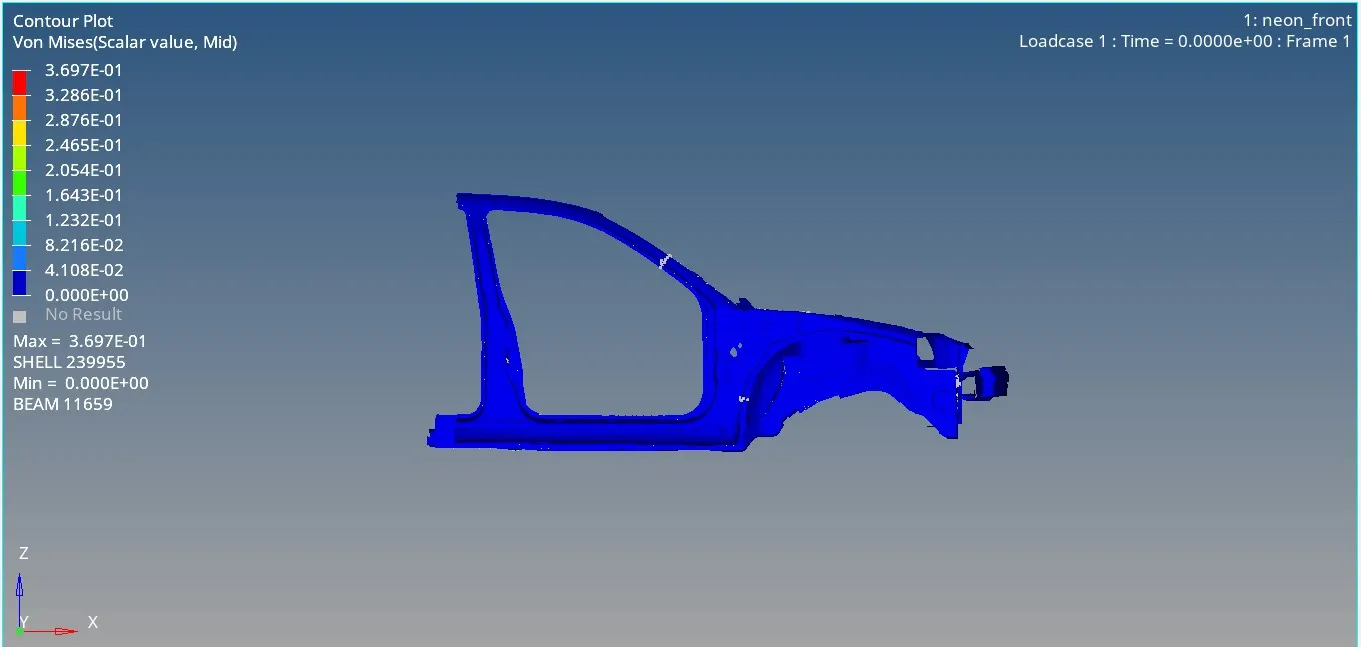
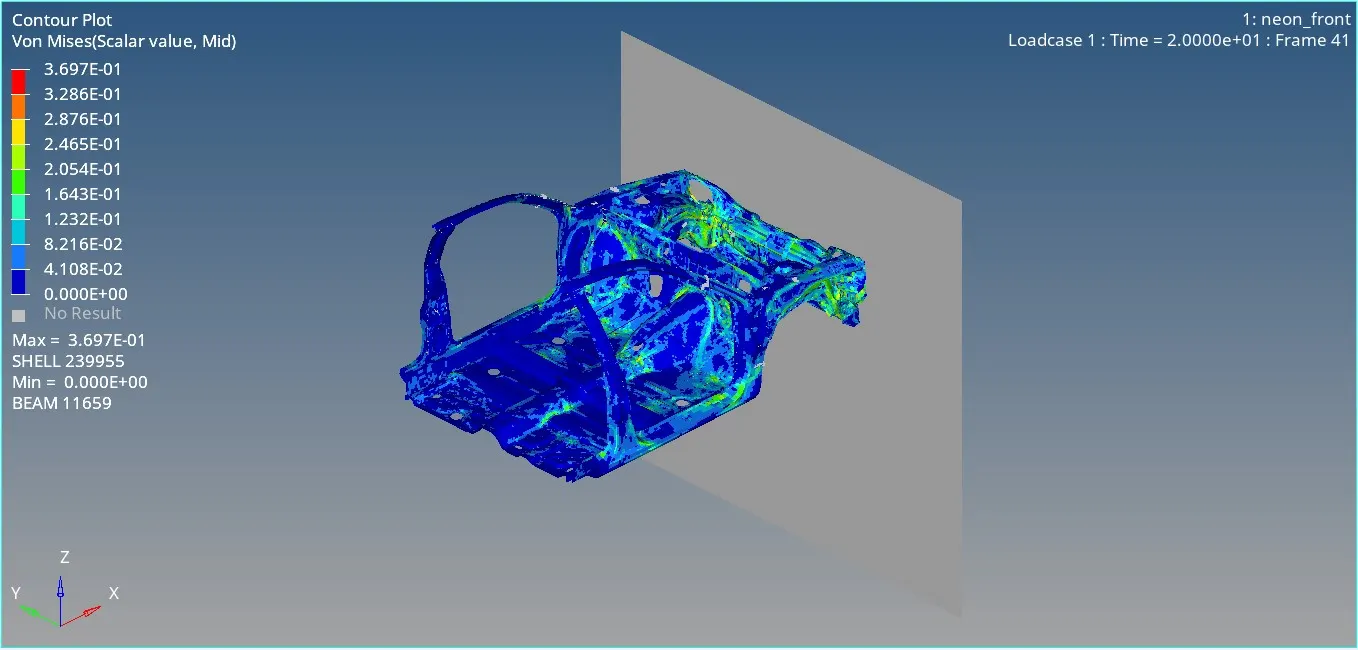
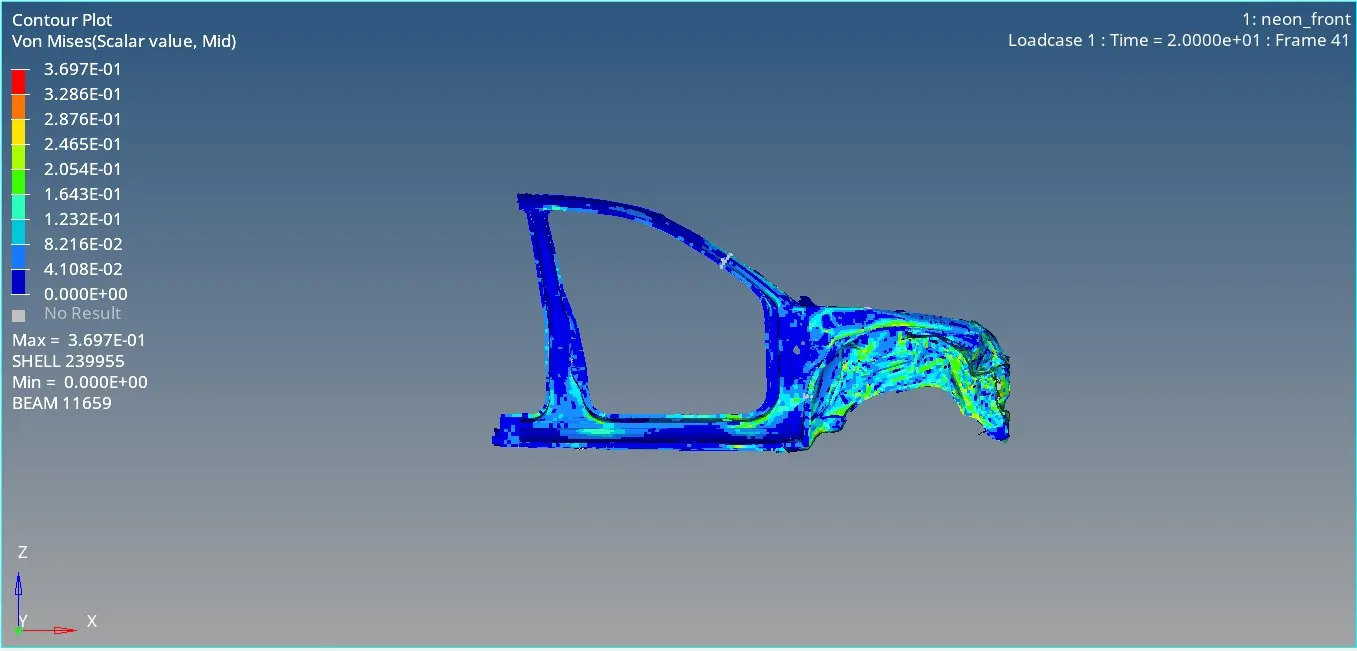
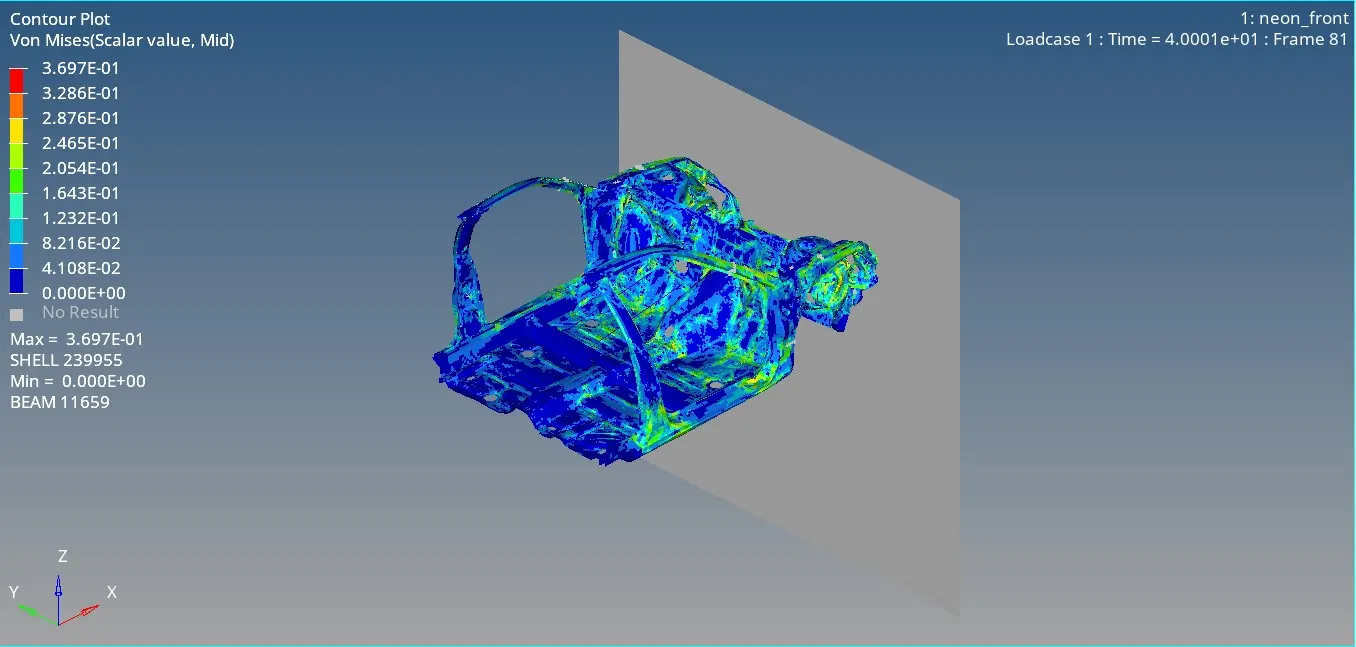
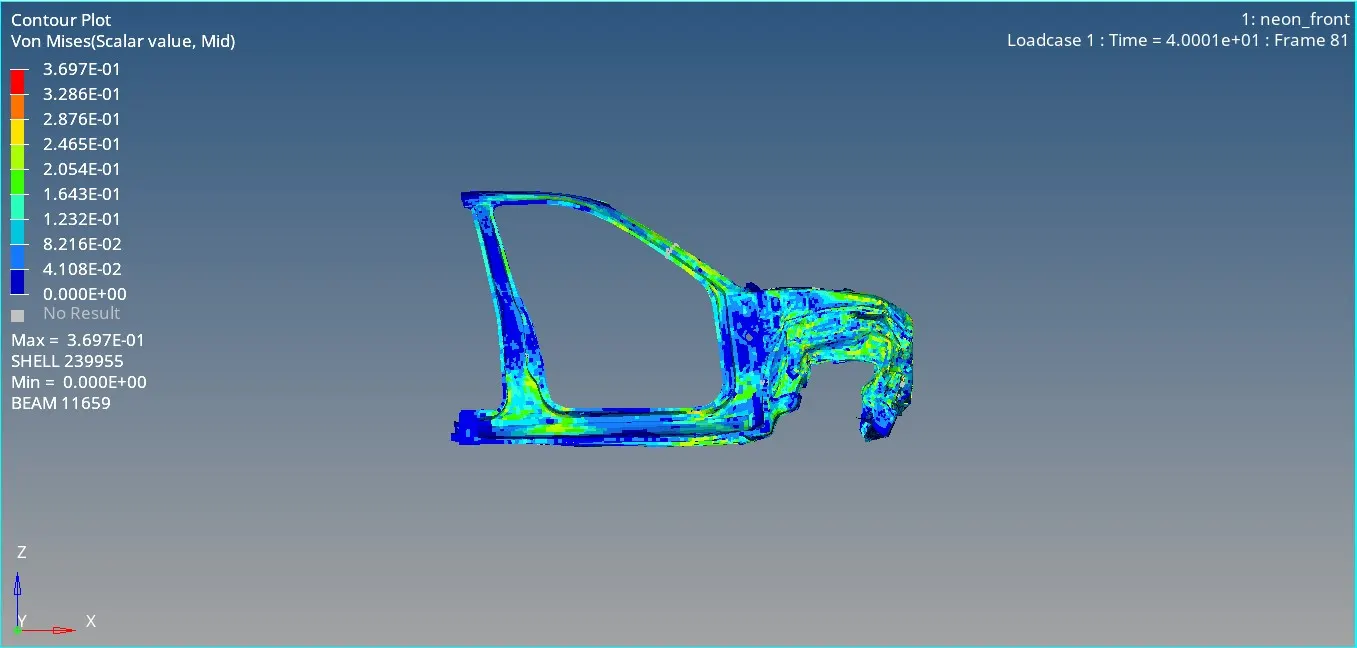
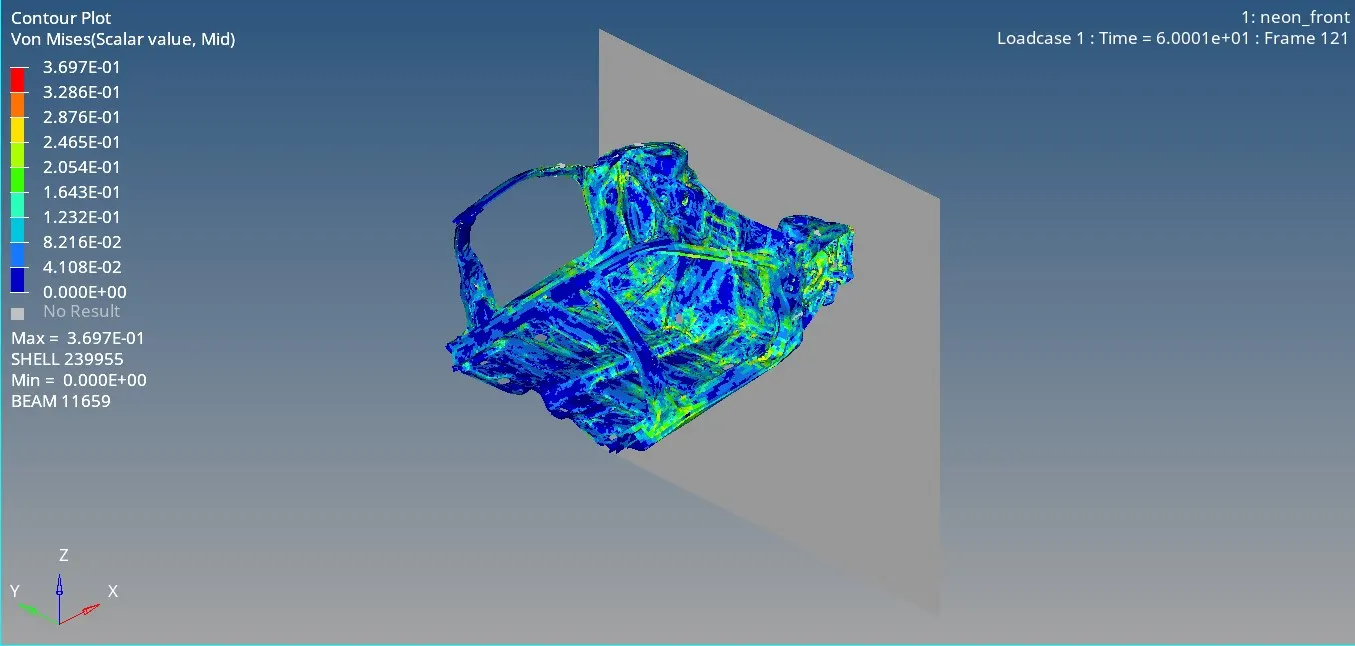
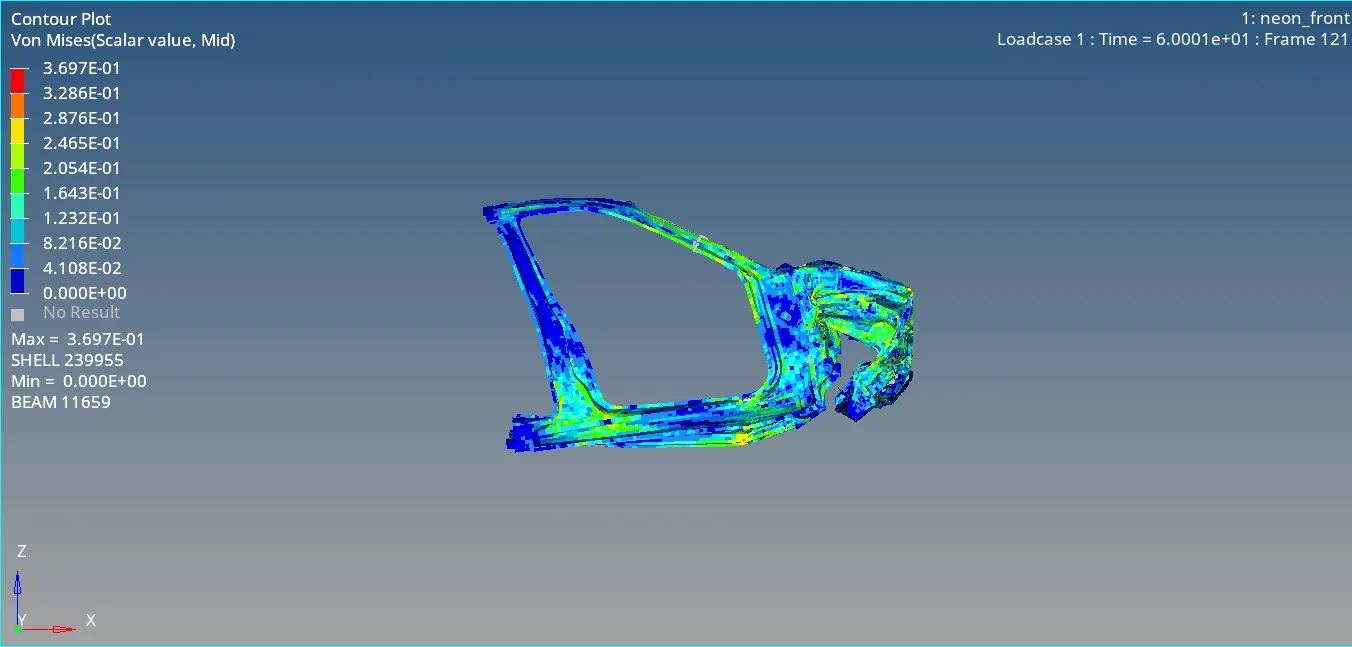
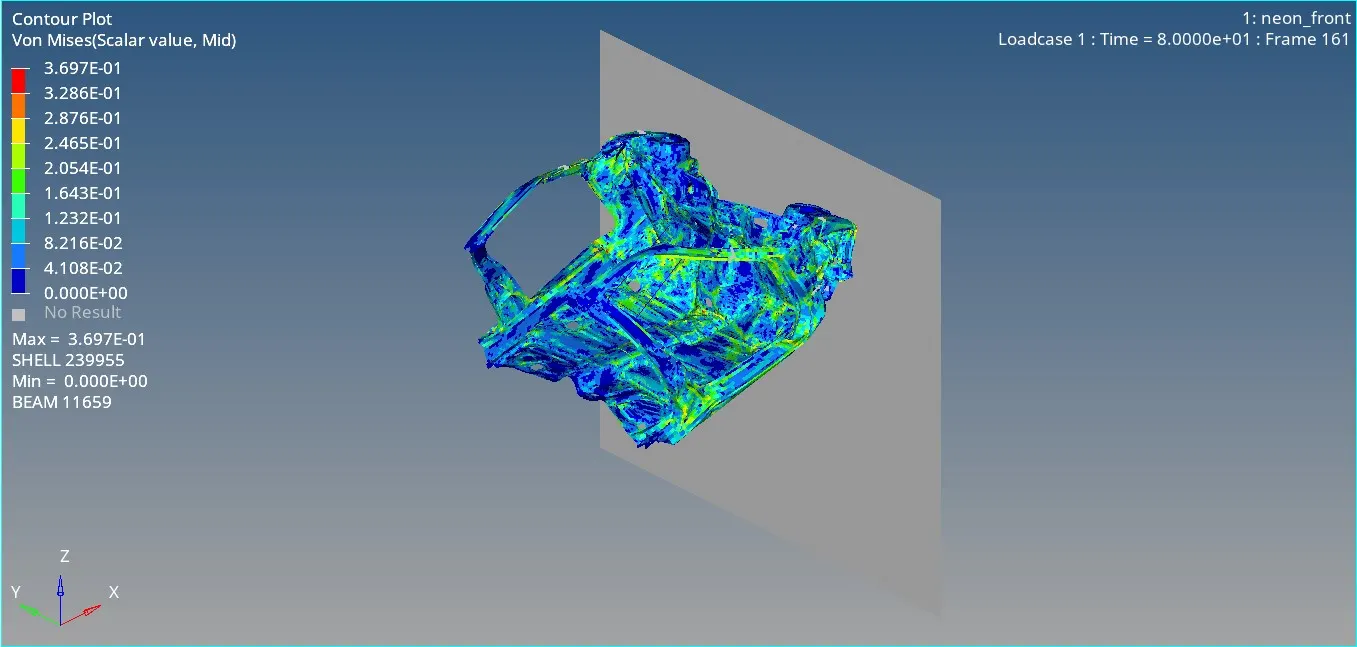
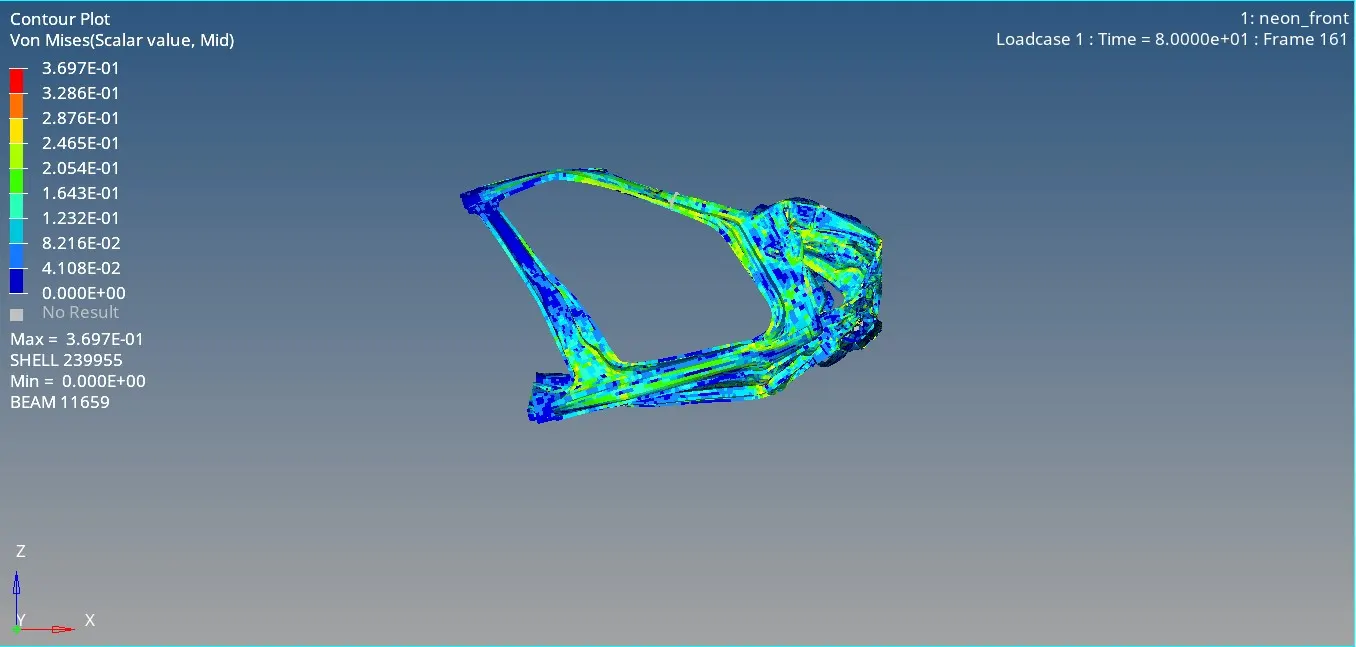
- The screenshots of the simulation are captured at multiple time frames - t = 0ms, 20ms, 40ms, 60ms, 80ms, and the same are attached, hereby.
Results and Inference:
- The discrepancy in results compared to the original complete model or the actual scenario can be attributed to the missing components like engine, wheels and also other compromises made on the reduced model.
- The differences between the left and right side components in the structure are due to the asymmetry found in the model design.
- Reading the cross-sectional forces, it is evident that the low lying sections bear the maximum forces compared to the high located components. The shotgun crosssections as expected faced the maximum force and the least is observed in the A-Pillar on the right side, while on the left side, fender experienced the minimum.
- The spring elongations observed are within the safe limits as far as the intrusion in the dash wall is considered.
- The accelerometer readings suggest that the left side of the structure is subjected to a high amount of vibrations and jerks, relative to the right side.