Frontal Car Crash simulation of Dodge Neon BIW using Radioss & HyperCrash
Frontal Crash test
Aim:
Frontal car crash simulation of Dodge Neon BIW using RADIOSS solver and Preprocessing using HyperMesh / HyperCrash.
Objective:
The following are the requirements for this project:
- Import the model of the Neon Dodge ie, the FEA model in such a way that the required output requests can be post-processed from it.
- Sectional force in the rails at the location of indicated node 174247.
- The axial force received on the rails from the bumper.
- Shotgun cross-sectional forces.
- A pillar cross-section.
- Acceleration curve received on the accelerometer at base of B pillar (on B pillar rocker).
- Intrusions on the dash wall 66695, 66244.
Setup Request:
- Check the unit system and either follow [Mg mm s] or [Kg mm ms].
- Create an appropriate interface, friction 0.2, and recommended parameters.
- Make sure of no penetrations and intersection.
- Correct rigid bodies if any issues.
- Create a rigid wall with friction 0.1.
- Compare the model weight with the full-scale 300k nodes model and use added masses to reach the target weight of 700kg while getting CG about the required range.
- Initial velocity 35 mph.
- Use model checker to ensure good quality.
- Time-step: 0.5 to 0.1 microseconds.
- Run 80 ms
Output requests:
- Sectional force in the rails at the location of indicated node 174247.
- The axial force received on the rails from the bumper.
- Shotgun cross-sectional forces.
- A pillar cross-section.
- Acceleration curve received on the accelerometer at base of B pillar (on B pillar rocker).
- Intrusions on the dash wall 66695, 66244.
Steps to achieve the task
- Import the model into Radioss/ Hypercrash.
- Setup the boundary conditions as given.
- Remove all the unwanted and used components, property cards, sets, groups, joints, etc.
- Check for penetration and intersections
- Setup the output request and check the necessary card status eg. ANIM/DT, ENGINE_RUN, etc.
- Run the model checker and debug the errors and warnings.
- Generate the Radioss file for animation and time history plots.
Theory:
Physics behind car crash with a rigid wall:
Fig: Frontal crash test (Source: Google Images)
During a car crash, energy is transferred from the vehicle to the rigid wall it hits. This transfer of energy, depending on variables that alter states of motion, can cause injuries and damage cars and property. The object that was struck will either absorb the energy thrust upon it or possibly transfer that energy back to the vehicle that struck it. Focusing on the distinction between force and energy can help explain the physics involved.
Car crashes are clear examples of how Newton's Laws of Motion work also referred to as the law of inertia, asserts that an object in motion will stay in motion unless an external force act upon it. Conversely, if an object is at rest, it will remain at rest until an unbalanced force act upon it.
Consider a situation in which a car collides with a static, unbreakable wall. The situation begins with the car traveling at a velocity (v) and, upon colliding with the wall, ending with a velocity of 0. The force of this situation is defined by Newton's second law of motion, which uses the equation of force equals mass times acceleration. In this case, the acceleration is (v - 0)/t, where t is whatever time it takes car A to come to a stop. The car exerts this force in the direction of the wall, but the wall, which is static and unbreakable, exerts an equal force back on the car, per Newton's third law of motion. This equal force is what causes cars to accord up during collisions.
In the case of a car, if it slams into the wall and comes to an immediate stop, that would be a perfectly inelastic collision. Since the wall doesn't break or move at all, the full force of the car into the wall has to go somewhere. Either the wall is so massive that it accelerates, or moves an imperceptible amount, or it doesn't move at all, in this case, the force of the collision acts on the car, and deformation occurs.
Crashworthiness
Crashworthiness is the ability of a structure to protect its occupants during an impact. This is commonly tested when investigating the safety of aircraft and vehicles. Depending on the nature of the impact and the vehicle involved, different criteria are used to determine the crashworthiness of the structure. Several criteria are used to assess crashworthiness prospectively, including the deformation patterns of the vehicle structure, the acceleration experienced by the vehicle during an impact, and the probability of injury predicted by human body models. Injury probability is defined using criteria, which are mechanical parameters (e.g., force, acceleration, or deformation) that correlate with injury risk. A common injury criterion is the Head impact criterion (HIC).
Procedure:
1. Import the model into Hyper mesh/ Hyper crash.
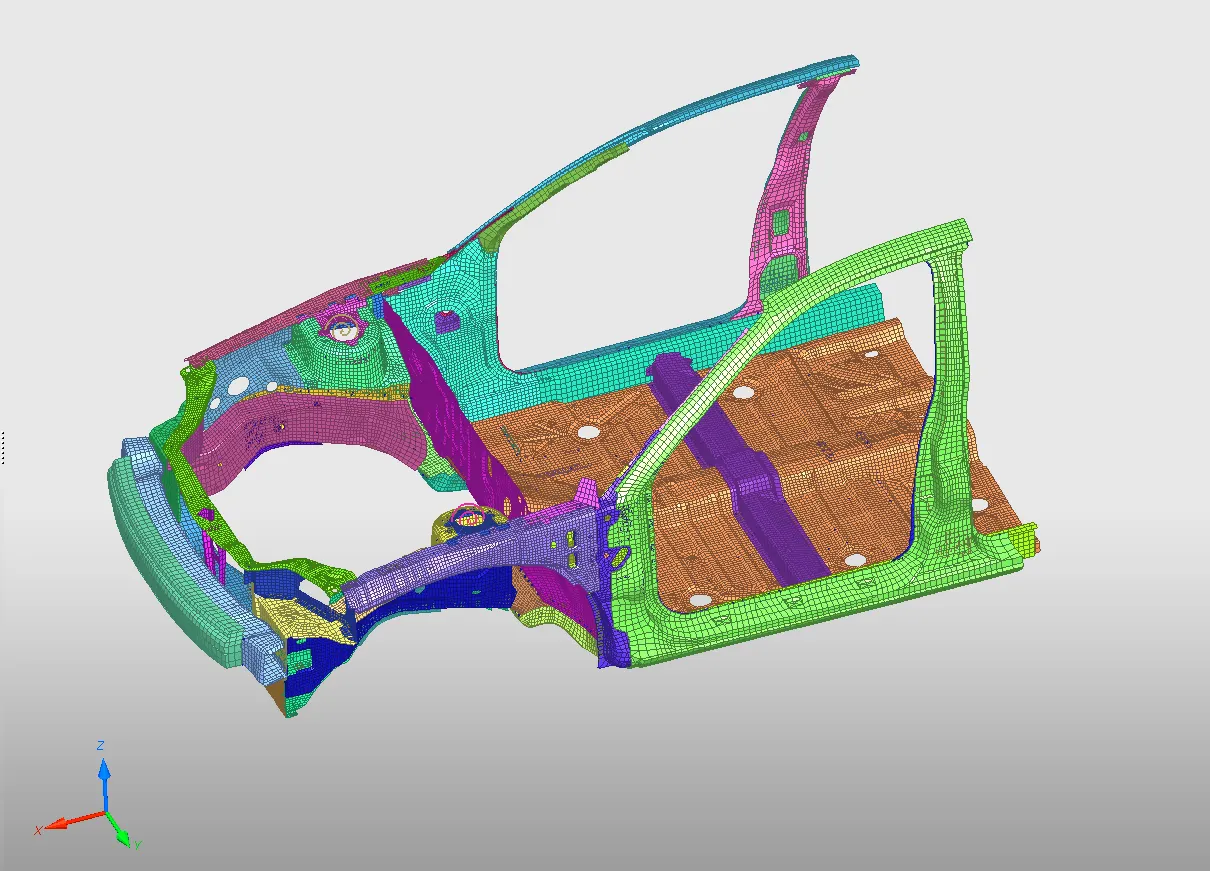
Fig: Model opened in HyperCrash
This is the partial BIW view of the full vehicle (300k element) so that it can get open into Hyper Crash (student version). Once importing the _0000.rad deck file into Hyper crash or Hyper works environment we can see it consist of 71 components, 68 material cards, 6 interfaces, and redundant spherical and translational joints. The total weight of the car is 188.4 kg with a COG point located near the dashboard base.
Check the unit system and either follow [Mg mm s] or [Kg mm ms].

By checking the _0000.rad file we see the unit system which is followed is [kg mm ms].
2. Create an appropriate interface.
Here we need to create a self-contact in the model, before that we need to delete the contact already applied in the model this is because since we are defining a self-contact. We don’t want a type 7 contact with the same components already in self contact. This is because two contacts defined for the particular components will lead to an increase in simulation time and also it will affect the Interface time step as well. So for defining a self-contact we are using a TYPE 7 contact which is a node to surface contact. In that, we will check the self-contact and we will give the recommended parameters to the type 7 contact and select the whole model as a master. All parameters provided are as recommended shown below.
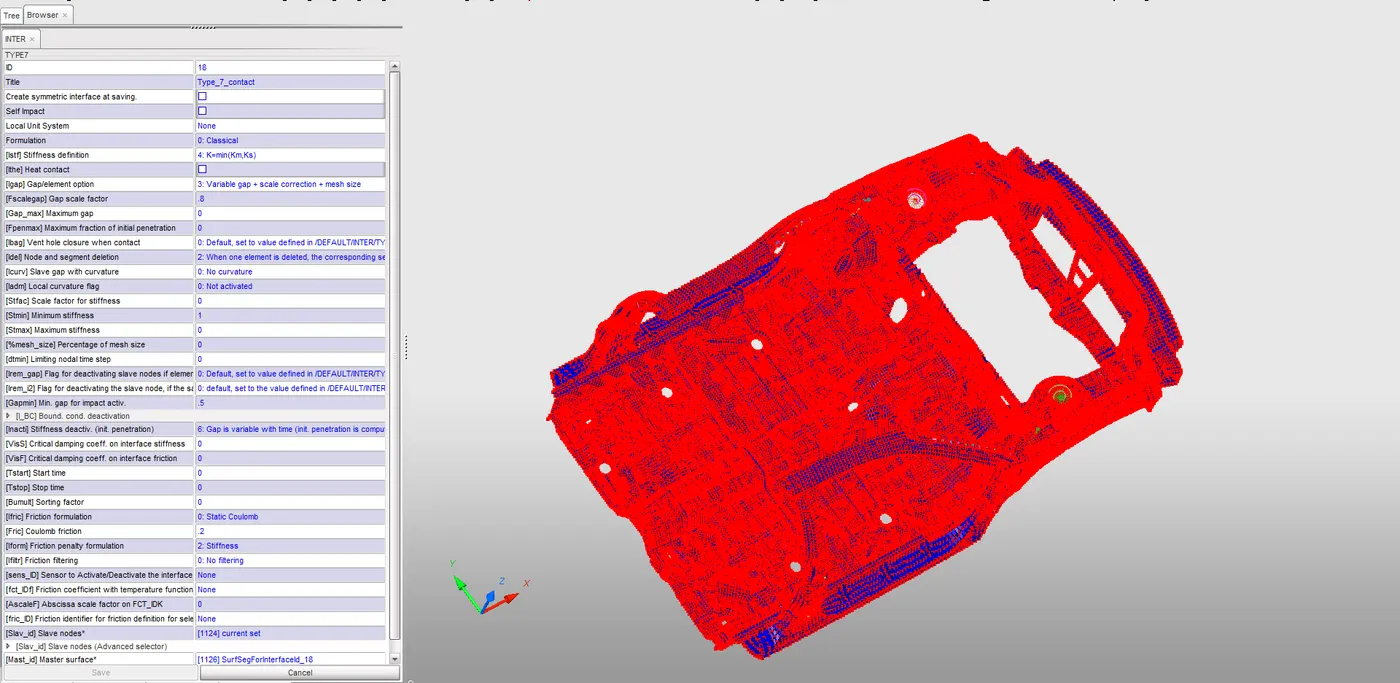
Fig: Self-contact (Type-7)
Note: To get the axial force received on the rails from the bumper, we have created a Type-7 contact between the bumper(Master-surface) and rail(salve-nodes). The card for the contact is shown below
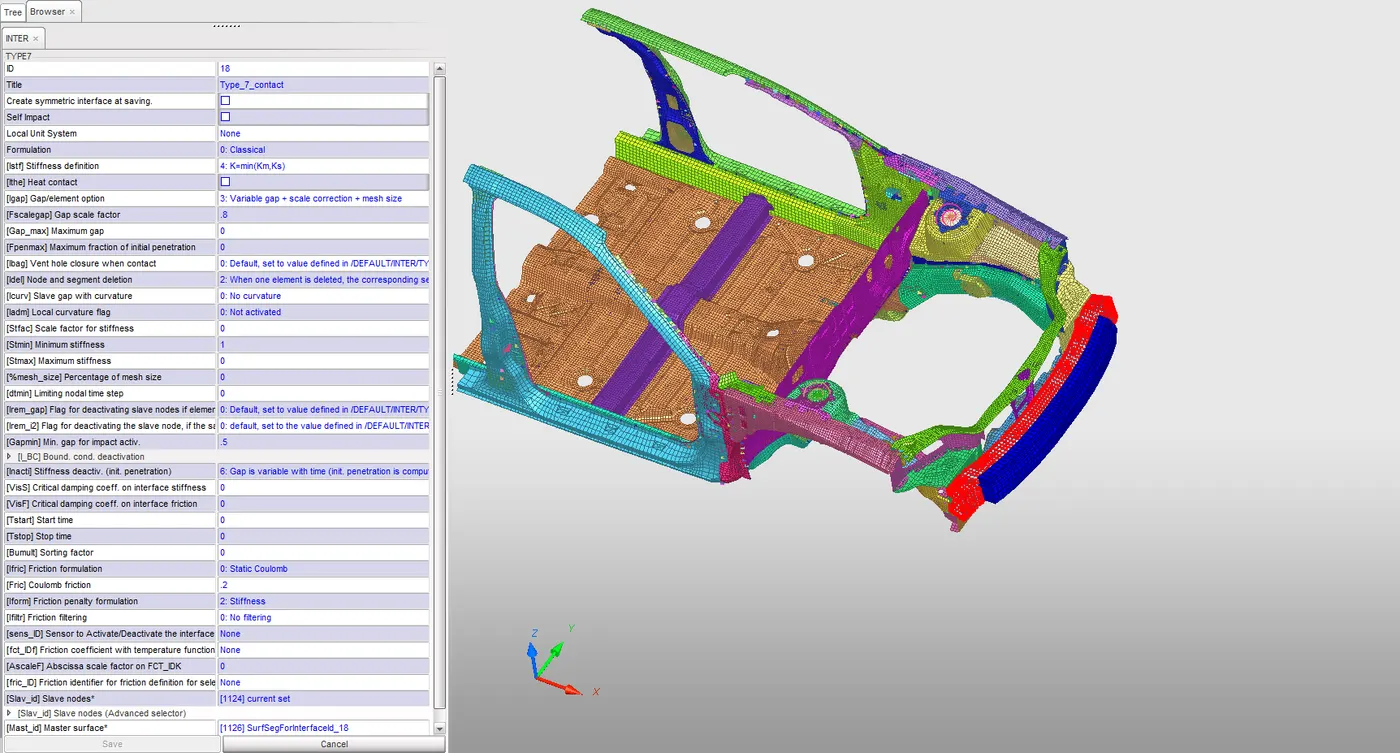
Fig: Bumper to rail contact (Type-7)
3. Make sure of no penetrations, intersection, and Proper connectivity between parts(ie, No free parts)
To check for the intersections and penetrations of the parts using tree-selection can be done by selecting Quality > Check Intersections of Tree Selection
Before moving to the next step we will make sure there are no intersection or penetration of elements. If any, fix them by using the tools provided in Hyper-crash / Hyper-Works, since there was no penetration or intersection during the check we can proceed further.
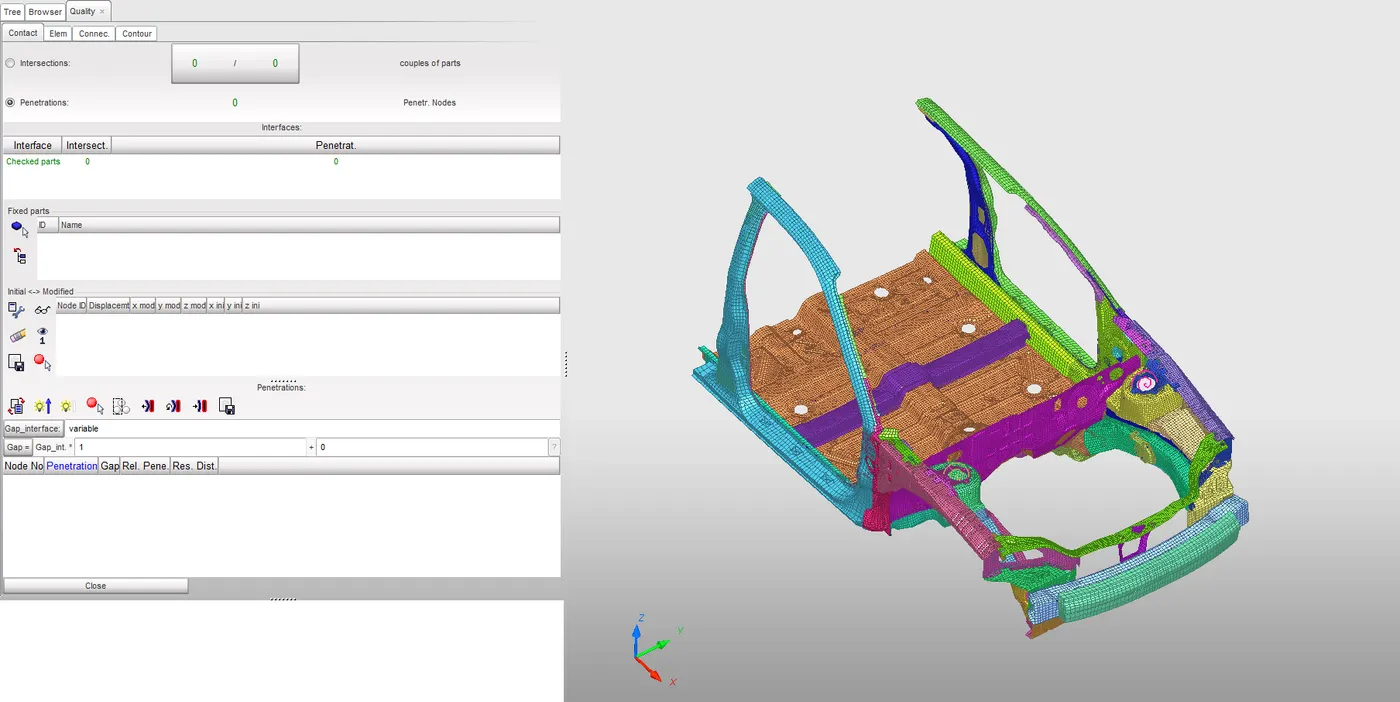
Fig: Penetration check
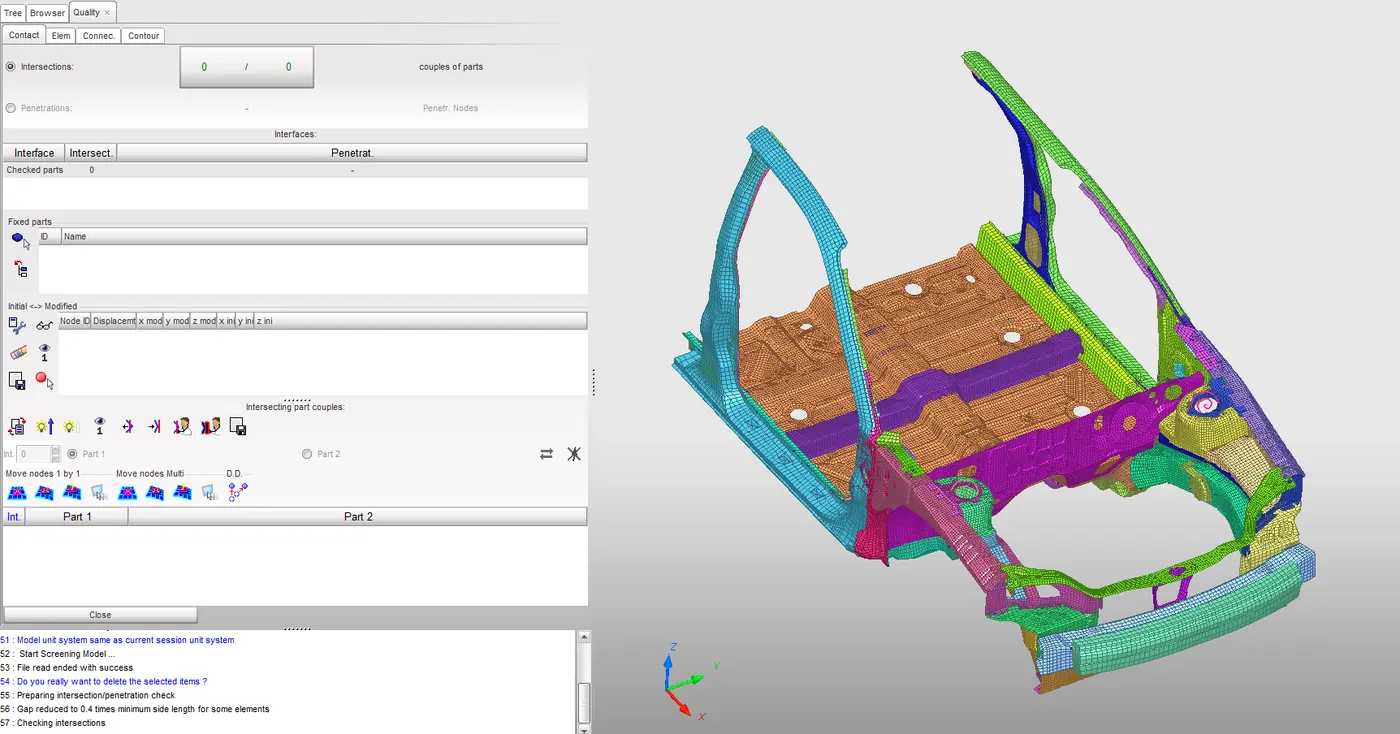
Fig: Intersection check
Note: Now we need to check for the connectivity of the parts
To check for the connectivity of the parts using tree-selection can be done by selecting Quality > Check Connectivity of Tree Selection. It will show a list of free parts and joints. These are the parts and joints which are not connected to any of any parts. To compare with the full model and check whether the part where the joints are connected to are presented in the surrogate model, If not then delete those joints. And if some parts are free then connect it to its respective component using some sort of simple springs. Always make the model a single connected one or otherwise run issues will occur.
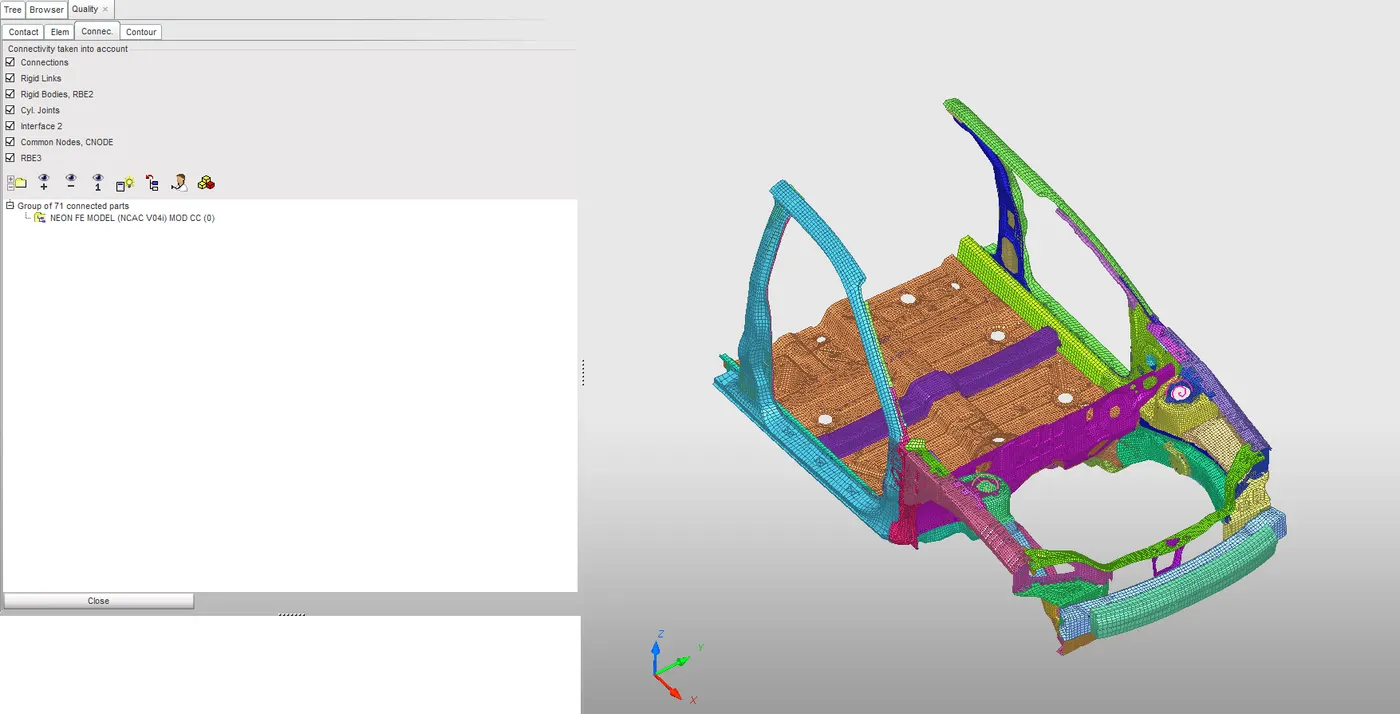
Fig: Connectivity check
5. Rigid wall Creation
We are providing the plane rigid wall with [fric] Friction value to be 0.1, search distance 1000, and other parameters stated below.
The rigid wall is the body is having high stiffness and we made the model collide with the rigid wall. Here we used an infinite plane rigid wall. For defining the rigid-wall first, select the tail coordinate as a node in the bumper and copy those coordinates to the head. Then we can change the values with the value of the coordinates in the normal direction of the plane to get the Rigid wall at a distance from the model. Here we shouldn't move the rigid-wall very far away from the model. If we move the rigid wall at a far distance from the model such that the time taken for the car to run and reach the rigid wall is actually a wastage of CPU time, we don’t want any results from that motion. So rigid walls should be only a little apart from the model.
Here we need friction with the rigid wall and that is inputted with sliding friction of 0.1. Then the search distance for the slave nodes should be given a particular value. At least it should search the nodes till A-pillar because up to that region the nodes may get interacted with the wall or we can select the parts or nodes by box selection but here we opted for the search distance method as 1000mm.
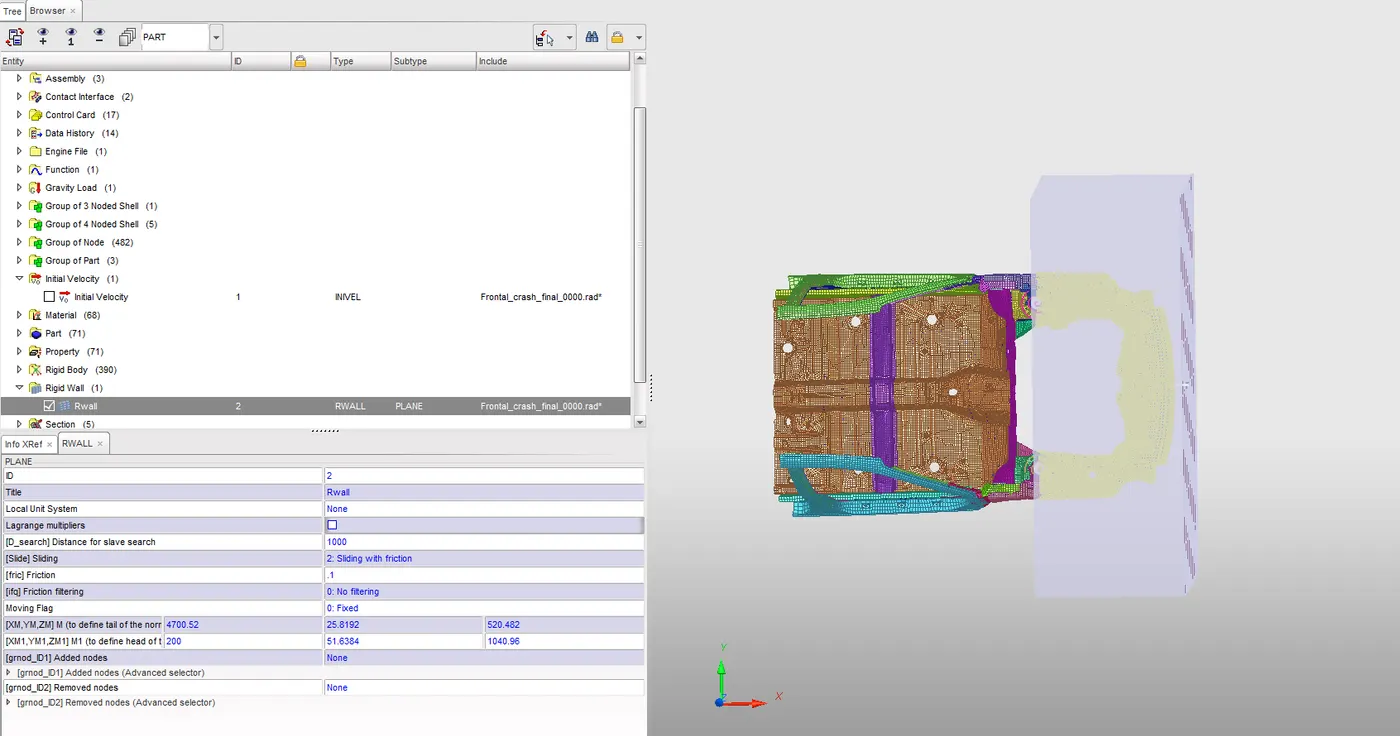
Fig: Rigid wall creation
6. Centre of Gravity adjustment
Compare the model weight with the full-scale 300k nodes model and use added masses to reach the target weight of 700kg while getting CG about the required range. On checking the mass balancing in the Hyper crash we can see the total weight of the model is 188.4 kg and COG somewhere near the base of the dashboard area. The center of gravity of the model should be in line with the C.G of the full car because in order to compare with the full model we should have the C.G in the same place. The location of the C.G is at the position when the line from the bottom of the driver seat meets with the central line. So in order to get the C.G at that place, we need to add mass to it. For that, we can make use of the added mass option in the Hyper-crash.
So we added mass in the floor part, rocker part, and at the rear end of the given model. The images below show the added mass at the specific location as mentioned above.
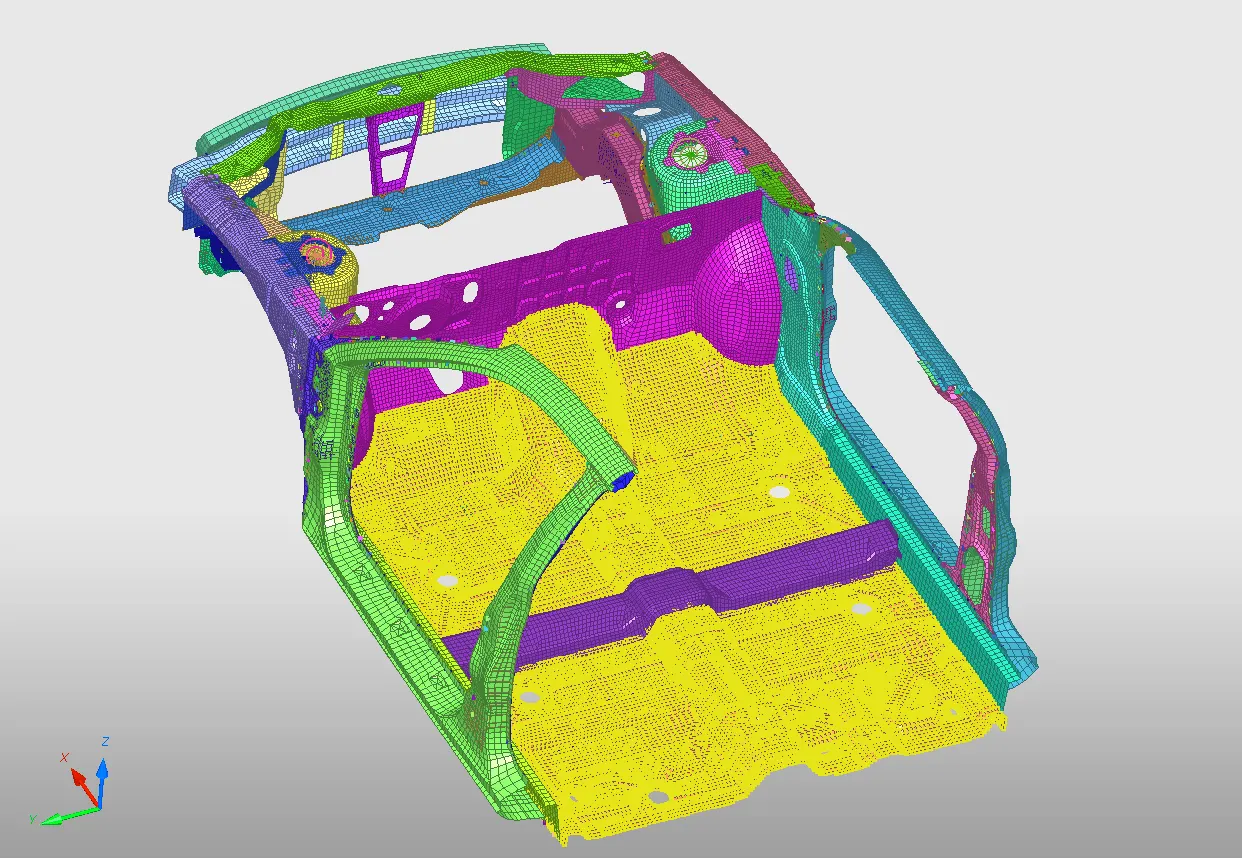
Fig: Mass added at the floor part
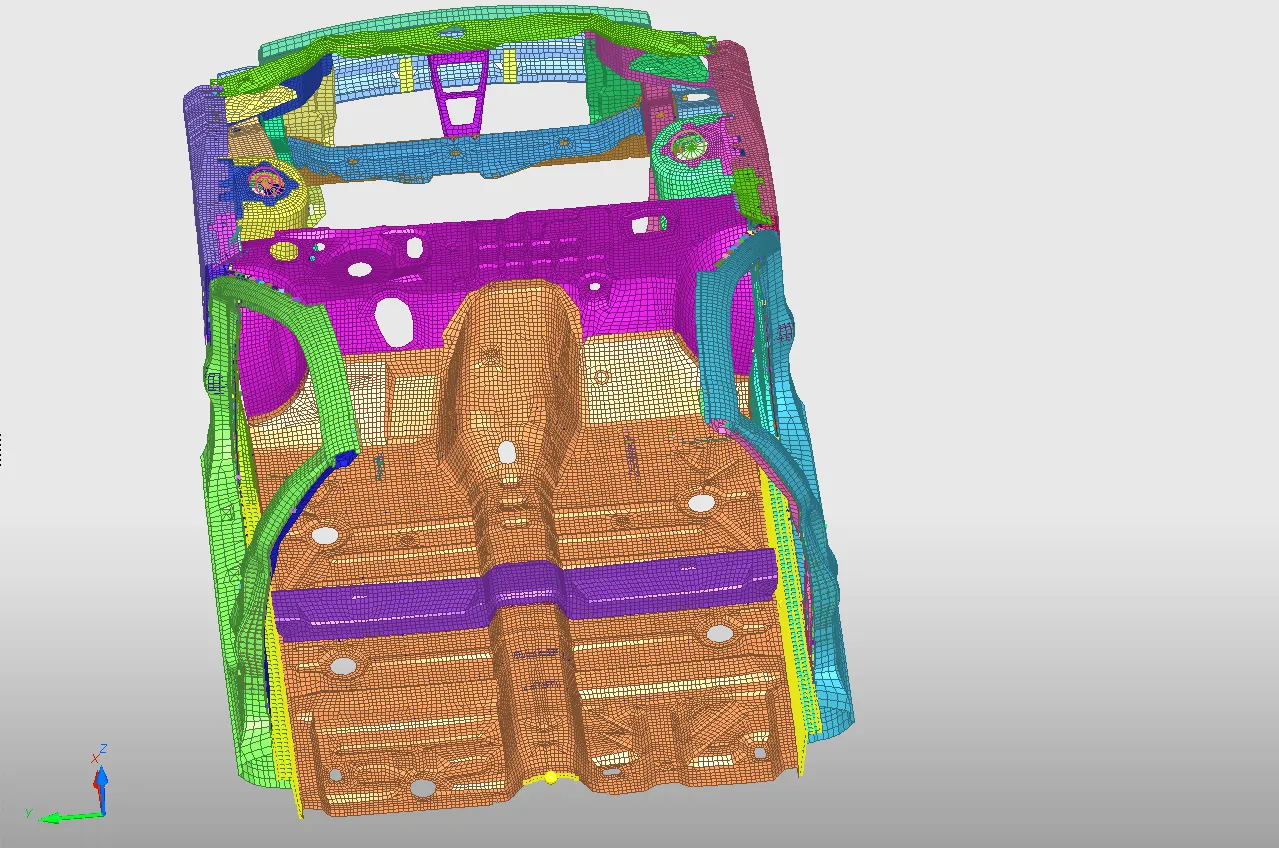
Fig: Mass added at both the rocker part and rear end of the floor
The COG of the given model after adding mass is shown below and the final position is aligned near to the side of the driver seat and in the middle of the cross-beam part.
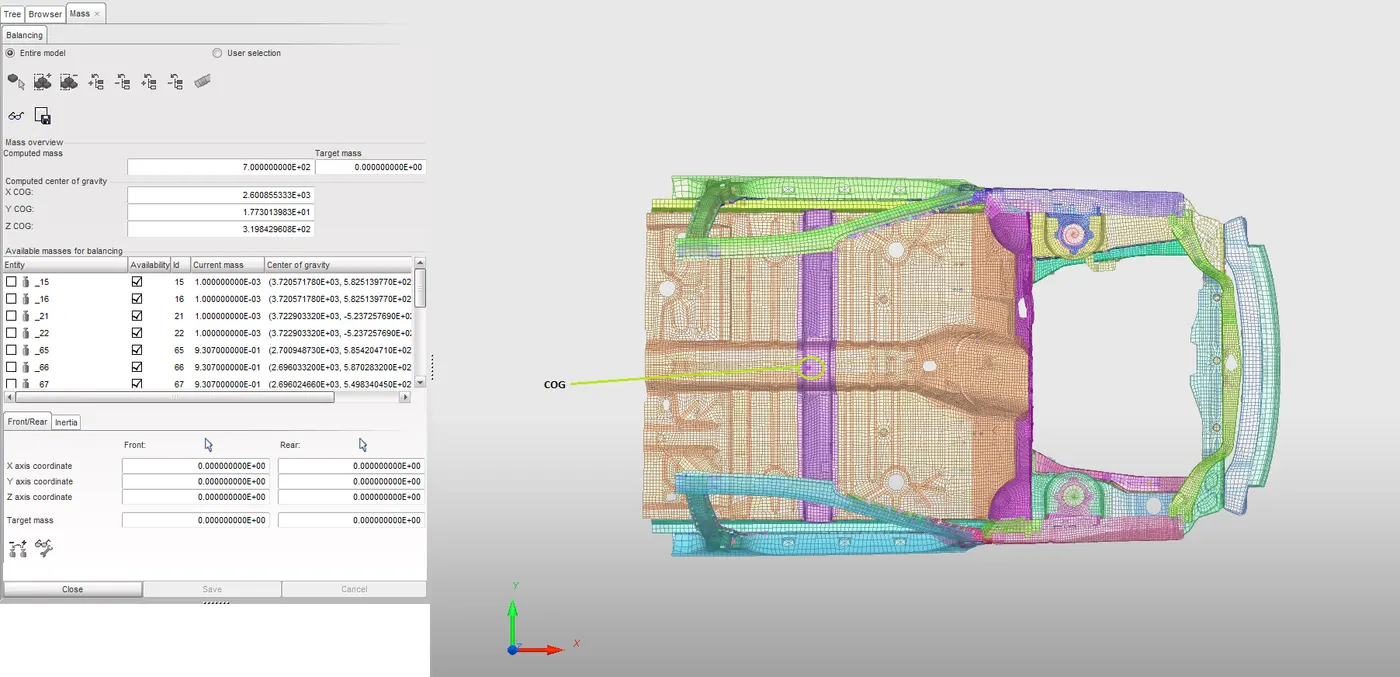
Fig: Positioned the COG of the model after mass addition
7. Set up Initial Velocity and Gravity load
We need to create an initial velocity and input all the nodes of the model as a ground-node set. Then give the value of velocity as 15.64 mm/ms in the X-direction. This makes the frontal crash possible at 35mph is equal to 15.64 m/s or mm/ms.
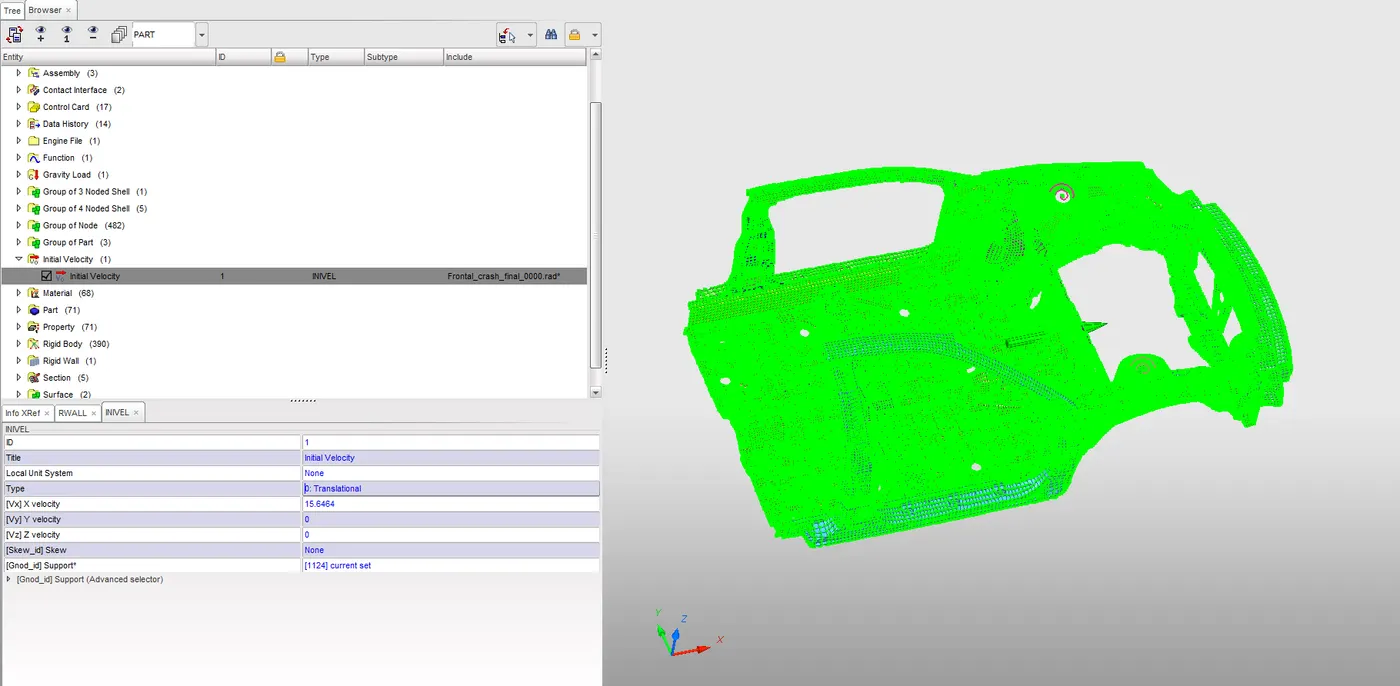
Fig: Card defined for Initial Velocity
From the gravity point of view, we need to define a function that should be a time-dependent gravity acceleration value, since we know that the value of gravity will be the same for whatever be the time. The negative value of acceleration is due to the downward direction (ie, negative z-axis)
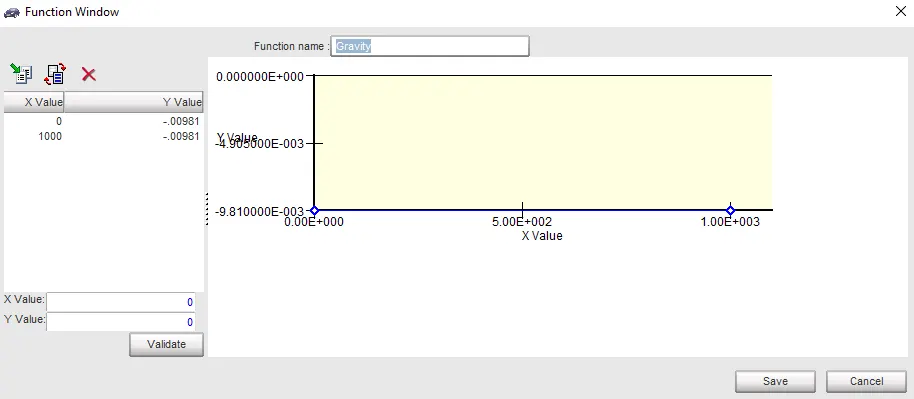
Fig: Function defined for Gravity
Same as the above card definition for initial velocity, we need to input all the nodes of the model as a ground-node set. Then give the value of acceleration due to gravity as -0.00981 mm/ms^2 in the Z-direction.
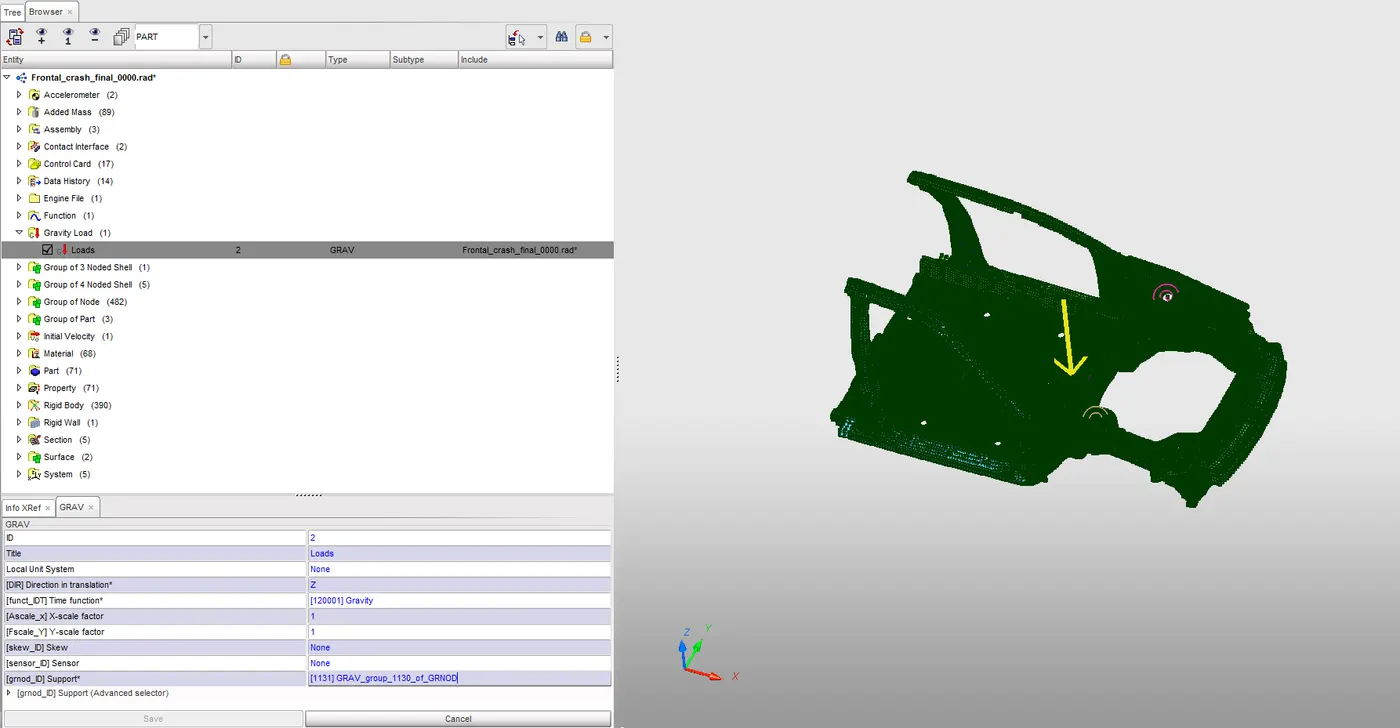
Fig: Card defined for Gravity
8. Fixing the Accelometer at the base of the B-pillar
To know the acceleration of the nodes under the B-pillar we will provide an accelerometer. (As shown in the below figure)
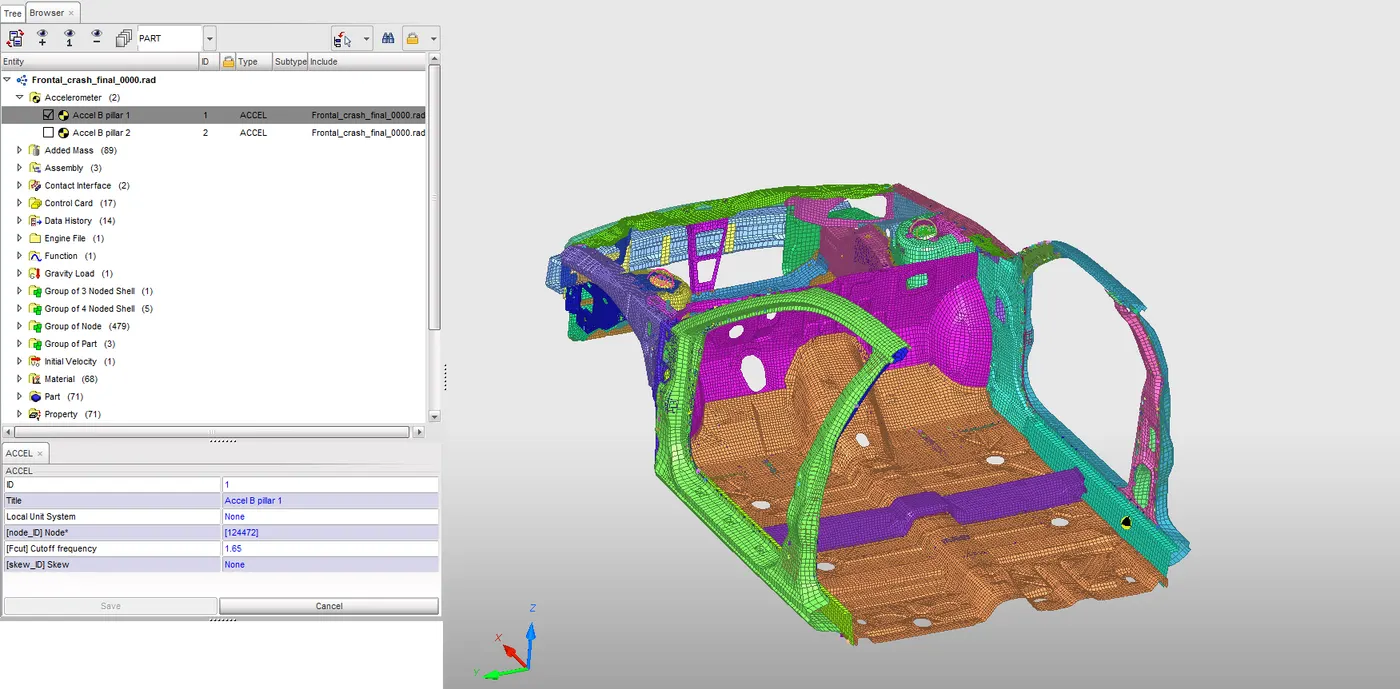
Fig: Fixing the Accelometer at the base of the B-pillar
9. Cross-section step for getting sectional forces.
To know the sectional force over the areas such as rails, shotgun, A-pillar we need to give section over the part as shown below. The sections are provided using a moving frame. Here in the moving frame, we need aware of the following data,
- N1-node for the origin of the local coordinate.
- N2-node for the x-axis of the local coordinate.
- N3-node for the y-axis of the local coordinate and marks the x-y plane
- Direction - specifies the N1-N2 node direction
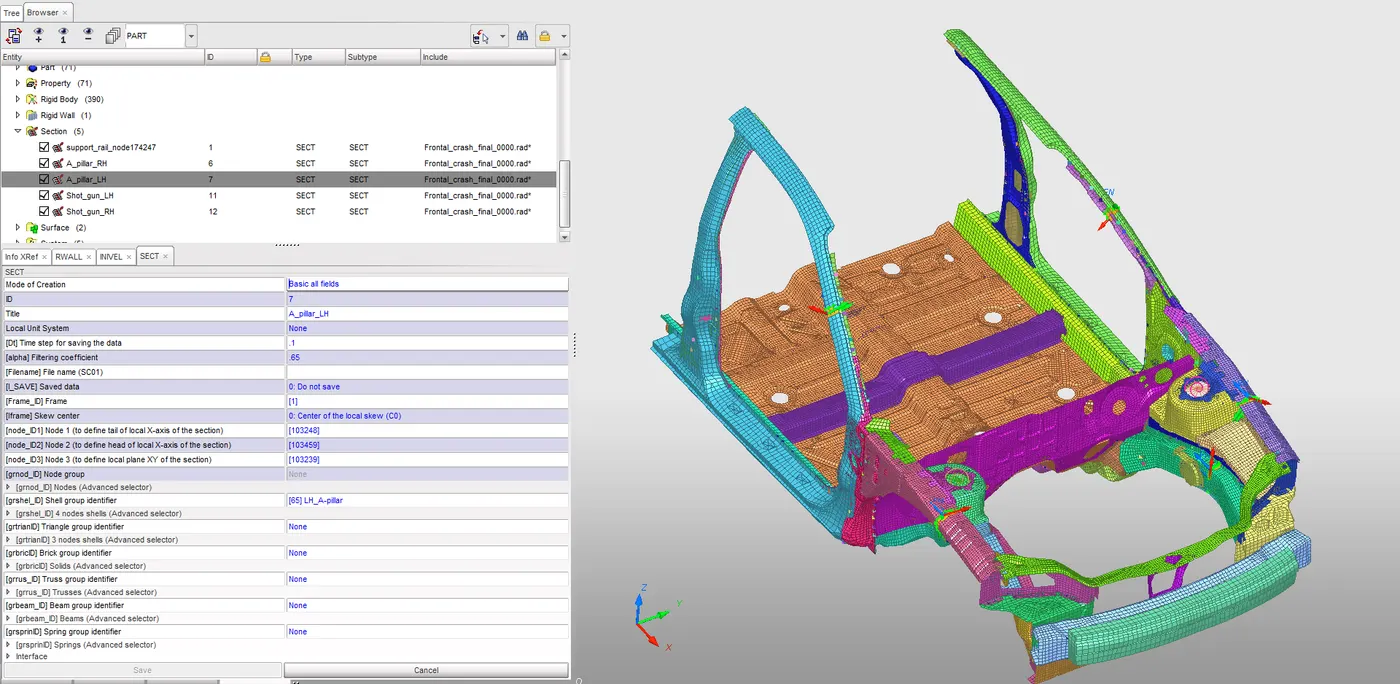
Fig: The sections are created using a moving frame.
Intrusion nodes
To know the intrusions over the area of the dashboard due to the crash impact we need to set the TH node for the area as shown below.
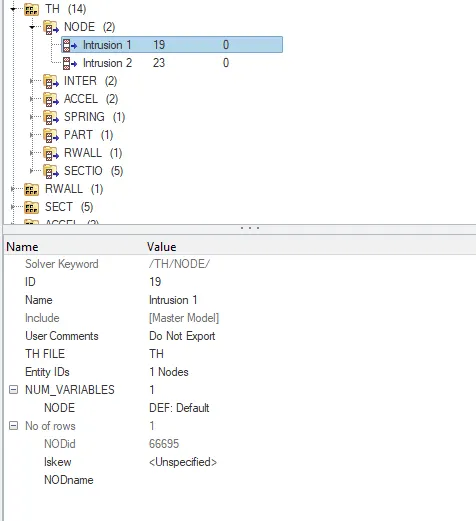
Fig: Time History card for node
10. Setup the output request and check the necessary card status eg. ANIM/DT, ENGINE_RUN, etc.
Once we are done providing the setup request we have to request the TH output. Such as accelerometer, sections, rigid wall, etc. After we are done with TH output we need to provide engine cards for animation and contour capturing eg. ANIM/DT, ANIM/VECT, ENG_RUN, etc.
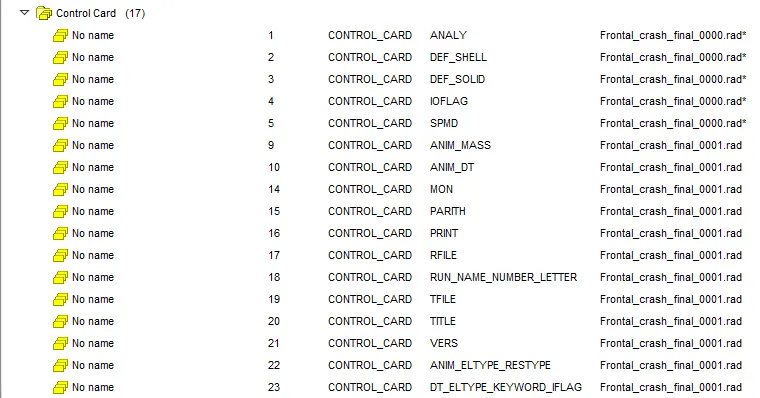
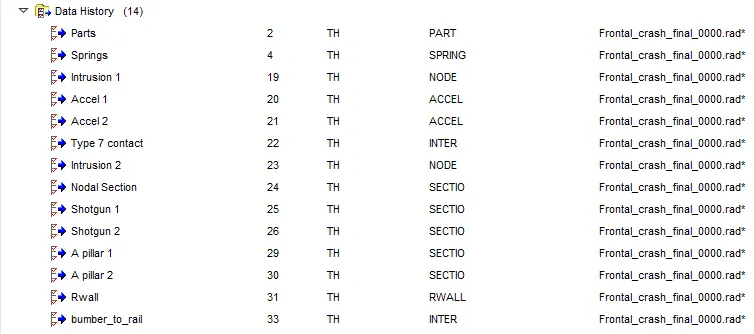
Fig: Shows the defined control cards and requested Time History output
Note:
To get the crossectional force in the part that we have taken for study using a local coordinate system where we can specify the output using the local data from the options. Here we selected the local data as the output since the global data that is actually not required. The below card defined only for the right side A-pillar but we need to do the same for every part whose crossectional force is taken for the study like A-pillar, Shotgun, and Support-rail. When compared the local axis normal values with the global axis normal force values we got nearly the same results and finally gone with plotting the values with the global axis.
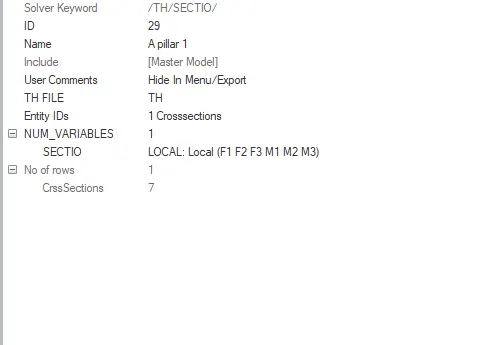
Fig: TH/SECTION card defined for the right A-pillar
11. Run the model checker and debug the errors and warnings.
Finally before generating the radios simulation and file we need to do the final check i.e. model check. On running the model check we see that it has shown a few errors and warnings so we need to check and fix them. The error can be due to unused group nodes, shells, surfaces, etc. It can be also due to the incompatible kinematic condition or wrong definition of rigid connection, etc. By working on the errors, finally, we got the debugging correct and manage to fix all errors. Here the warning will not affect the simulation of our file and this arises due to the better definition of the cards for the proper simulation.
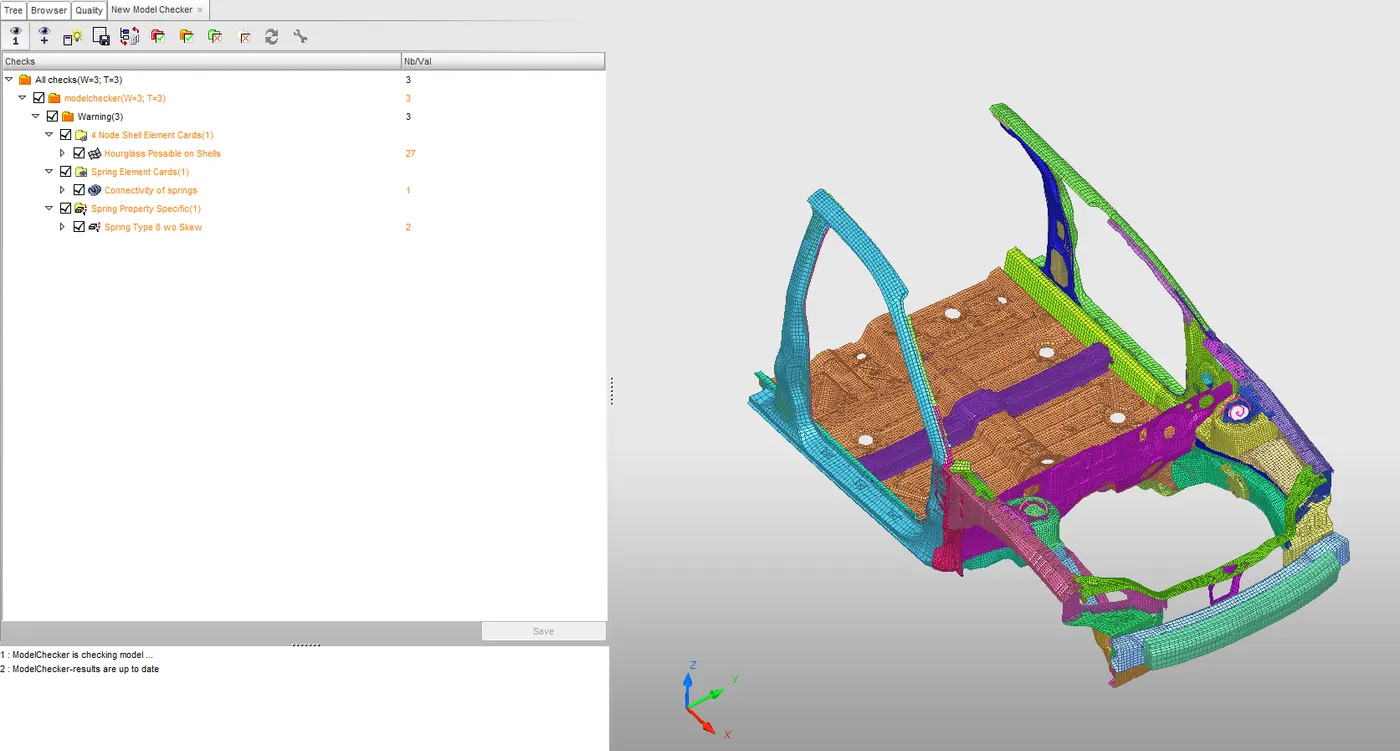
Fig: Debug the errors
RESULTS & COMPARISION:
Post-processing
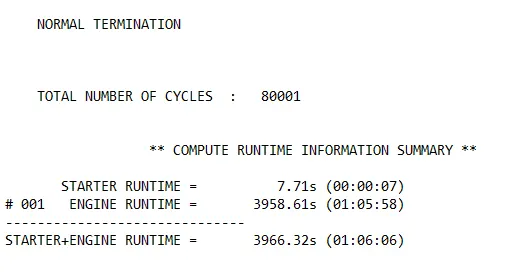
On opening the _0001.out file, we can see the energy error to be -1.4% and mass error to be 0.01463 which is acceptable and can be considered as a good model with total no. of the cycle as 80001 with time duration of 01:06:06 or 3958.61 sec.
Animation files
1) Von-Mises stress
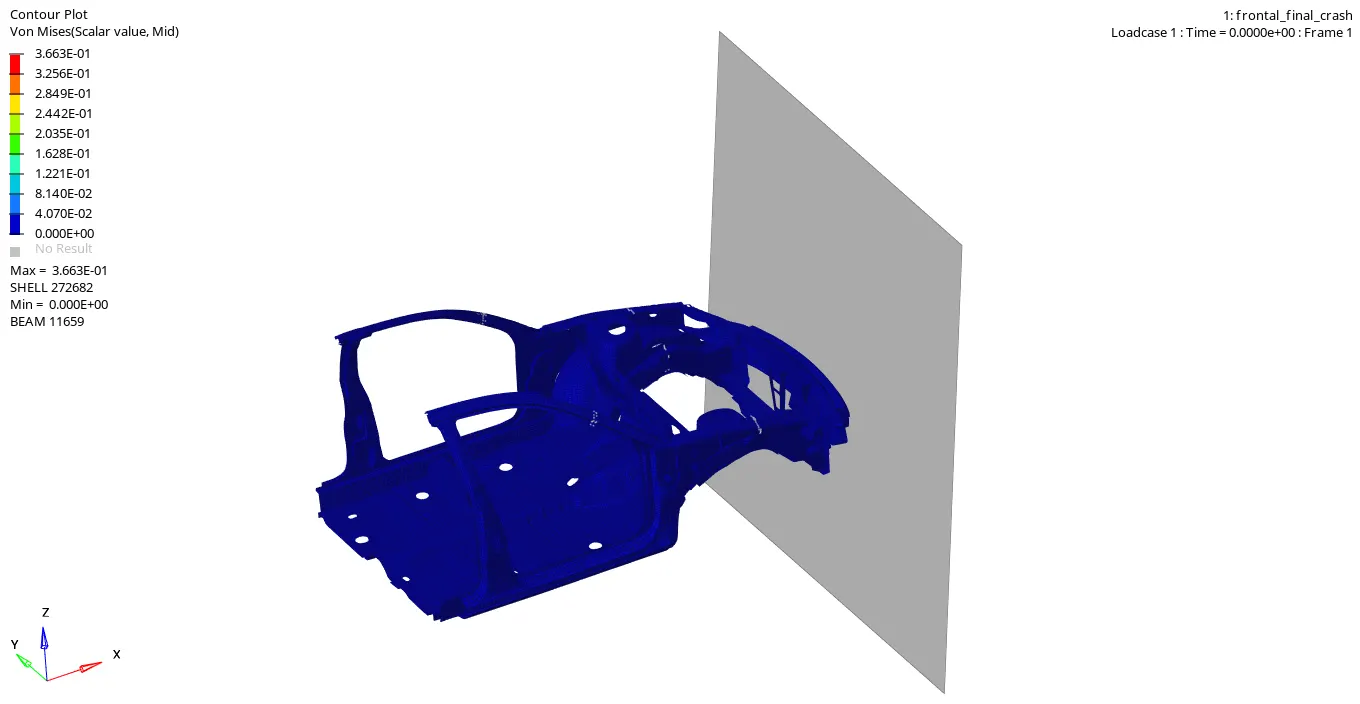
The Von-mises stress generated with a max value of 0.366 Kg/mm ms^2 at shell 272682. Also, see the flow of stress through the car body when it crashes with the rigid wall, most of the impact is channelized from the bumper to the car floor panel and rest through the A-pillar.
From the contour view below, we can see that the energy flow pattern form the bumper to crash tube then sub-frame, and finally to the car floor panel.
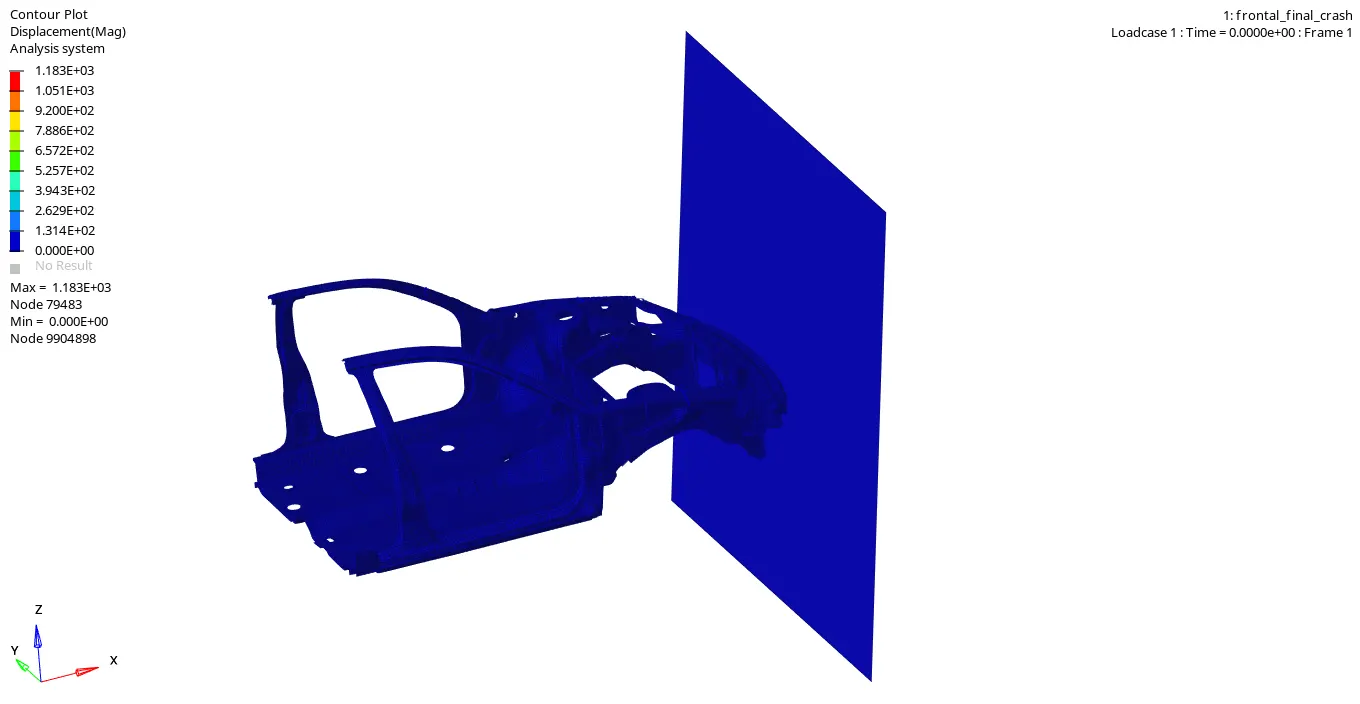
2) The maximum displacement achieved is 1183 at node 79483
PLOTS
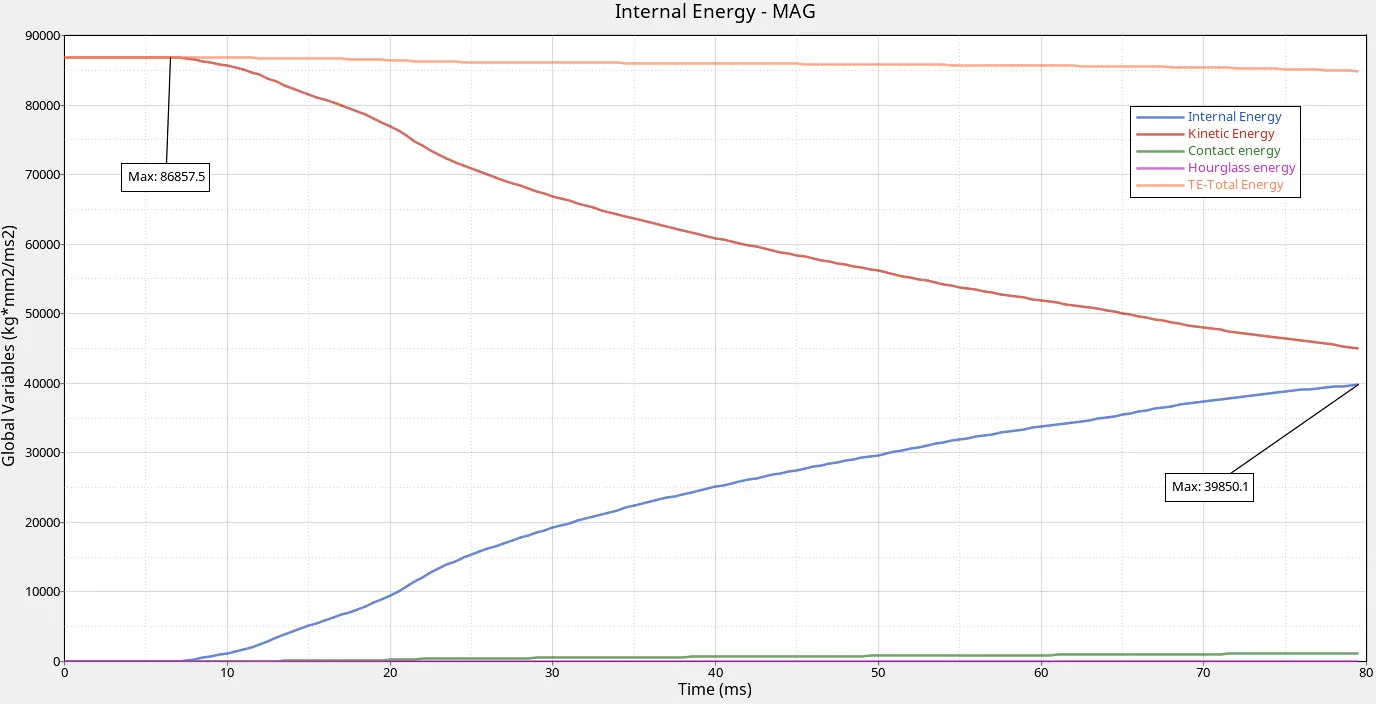
1) ENERGY PLOT
As we can see the kinetic energy at the start of the simulation is at 86.8KJ and reduces gradually with the impact into the rigid wall (velocity reduced). The Internal energy starts at 0 and increases to a value of 39.85KJ at the end of simulation due to the deformation and conversion of K.E to the I.E. The value of hourglass energy is zero throughout the simulation due to the use of recommended shell properties and constant energy is insignificant.
2) RIGID WALL FORCES
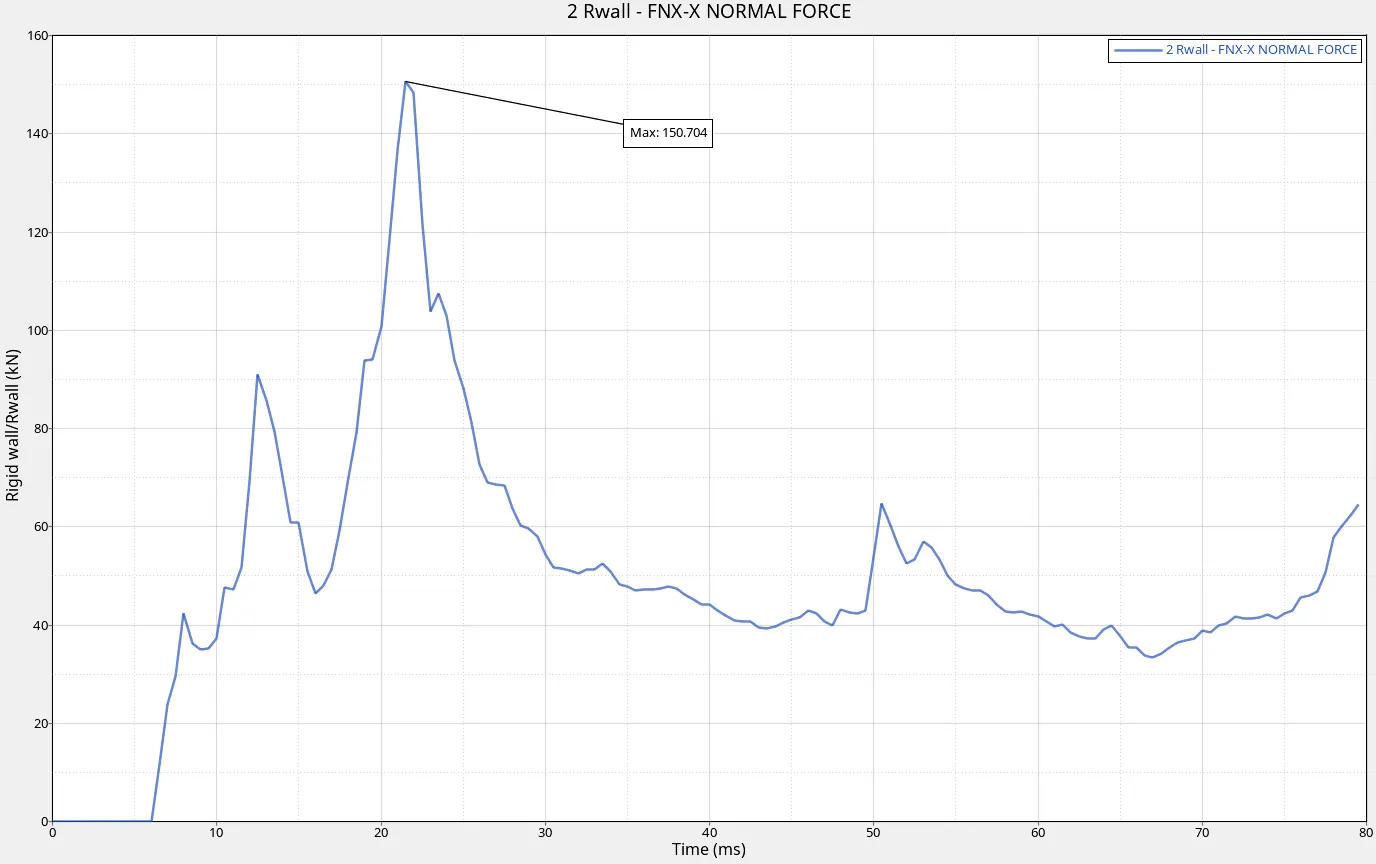
As we can see the plot below shows the resultant force in X-direction varies w.r.t simulation time. As it can be seen in the starting the wall force generated is zero till 6ms of simulation because of no contact but at the 6 ms there is a peak rise in the wall forces to a value of 92kN and then at 22 ms the value reaches to its max of nearly 150.7 kN when car frontal area smashes on to the wall the max. Then from 25 ms to 80 ms, the value remains almost constant of 45 KN.
3) A-pillar section Forces
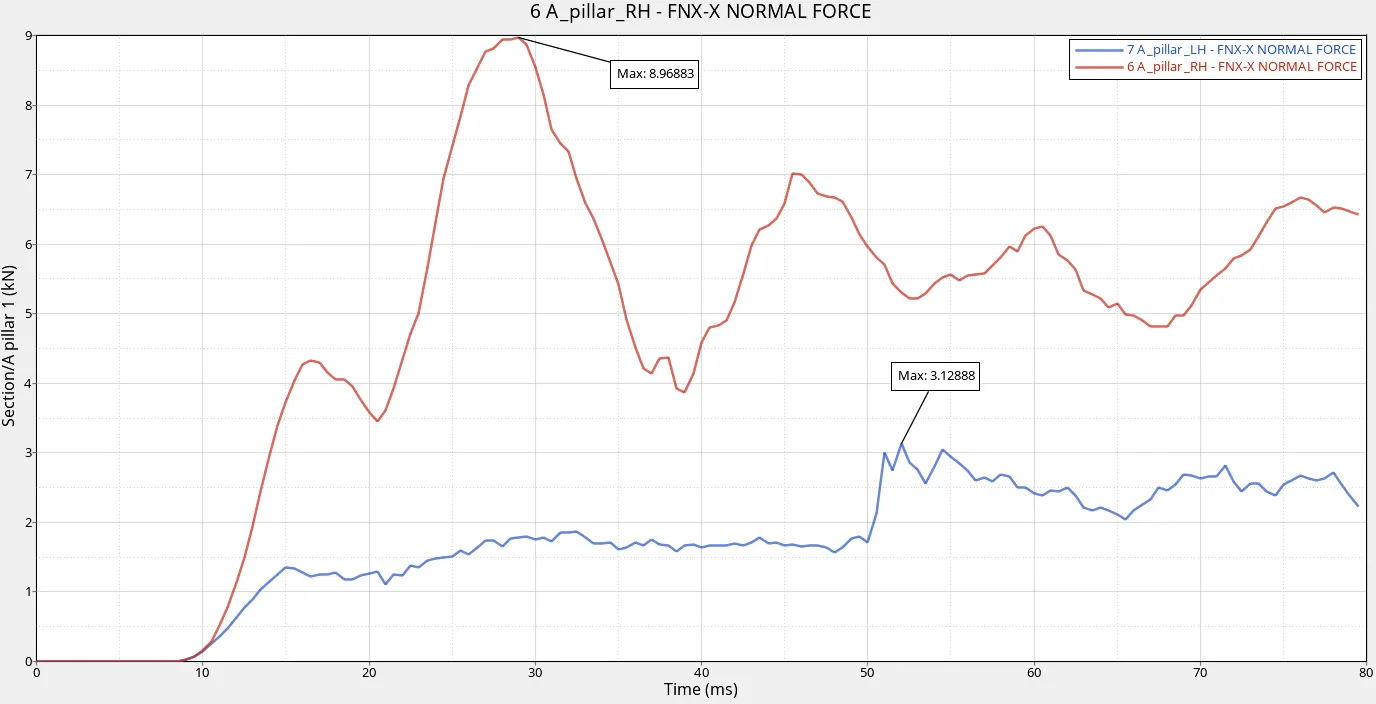
This can be seen that the initial value of section forces is zero for both left and right A-pillar as there is no impact at that point. Then later the right pillar sectional forces are much higher than the left A-pillar. Max value for the left pillar is 3.12 kN, whereas for the right A-pillar is 8.96 kN. So we can say that the right pillar will be subjected to more force and it should be considered for failure once it exceeded the yield value.
4) Shotgun Sectional Forces
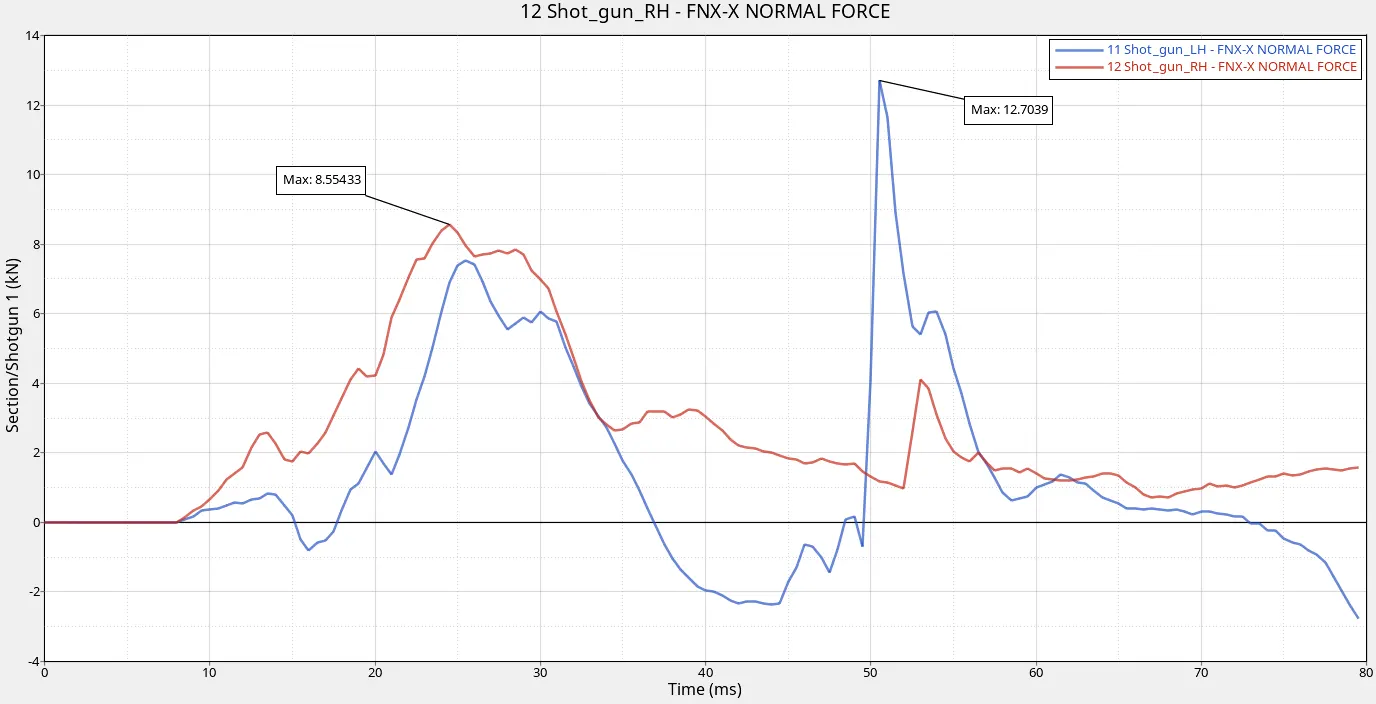
The sectional force for the shotgun the left shotgun subjected to more force (max:12.7 kN) than the right shotgun in thorough out the simulation but there is a peak rise in the force at 50 ms to a value from -0.8 kN to 12.7 kN in the left shotgun and this has to be taken into consideration for failure once it exceeded the yield value.
5) Support Rail Sectional Forces (at node 174247)
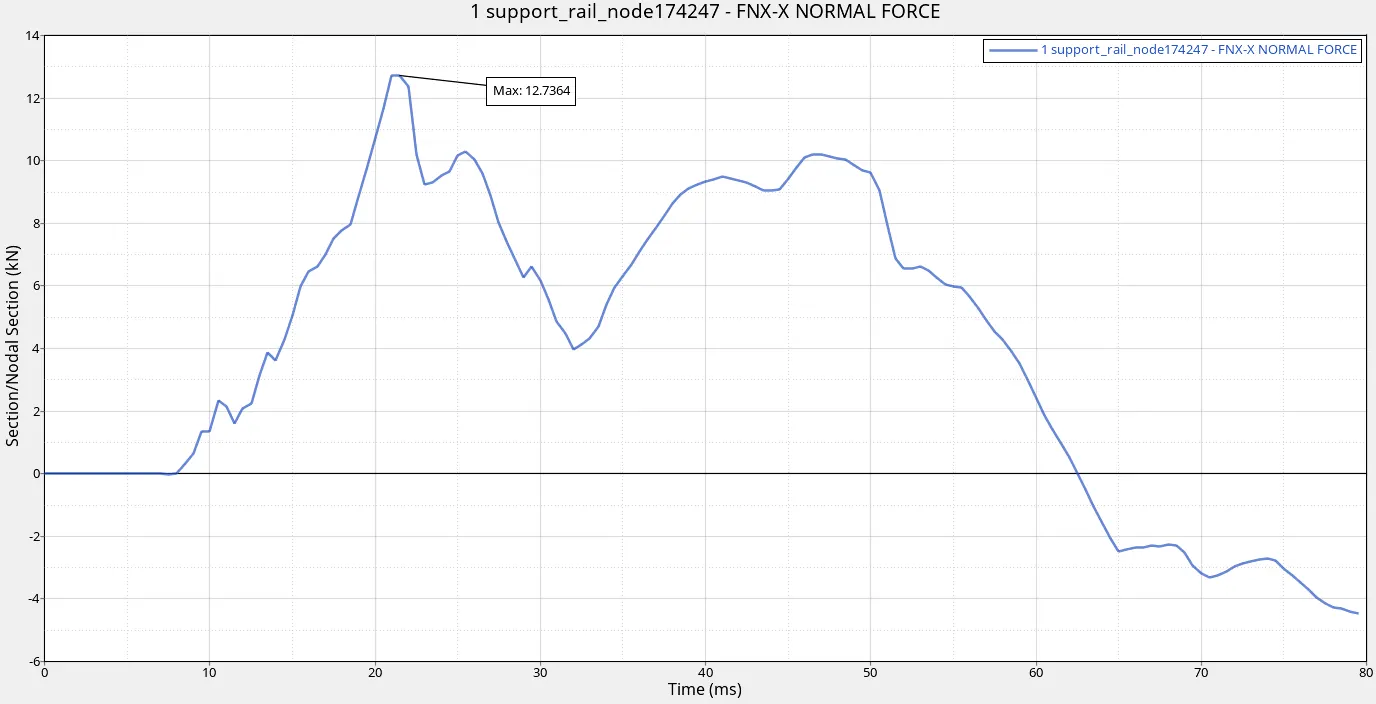
The sectional force for the support rail at node 174247 since it is an left shotgun which has been subjected to a force (max:12.7 kN) and after that 55ms we can see a drop in the force value and it can seen that the component is taken into consideration for failure.
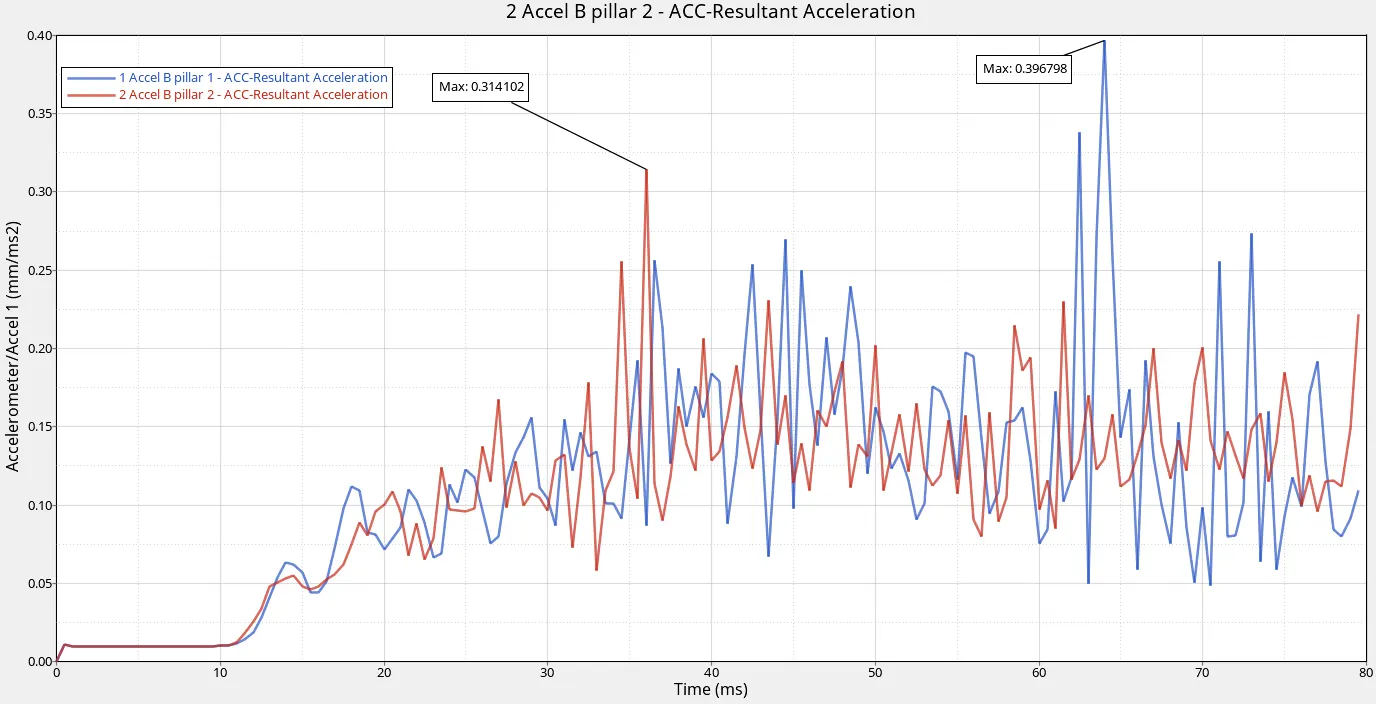
6) Accelerometer Acceleration Values
As it can be seen that right accelerometer shows a much variation in the values than the left with the peak value of 0.396 mm/ms^2
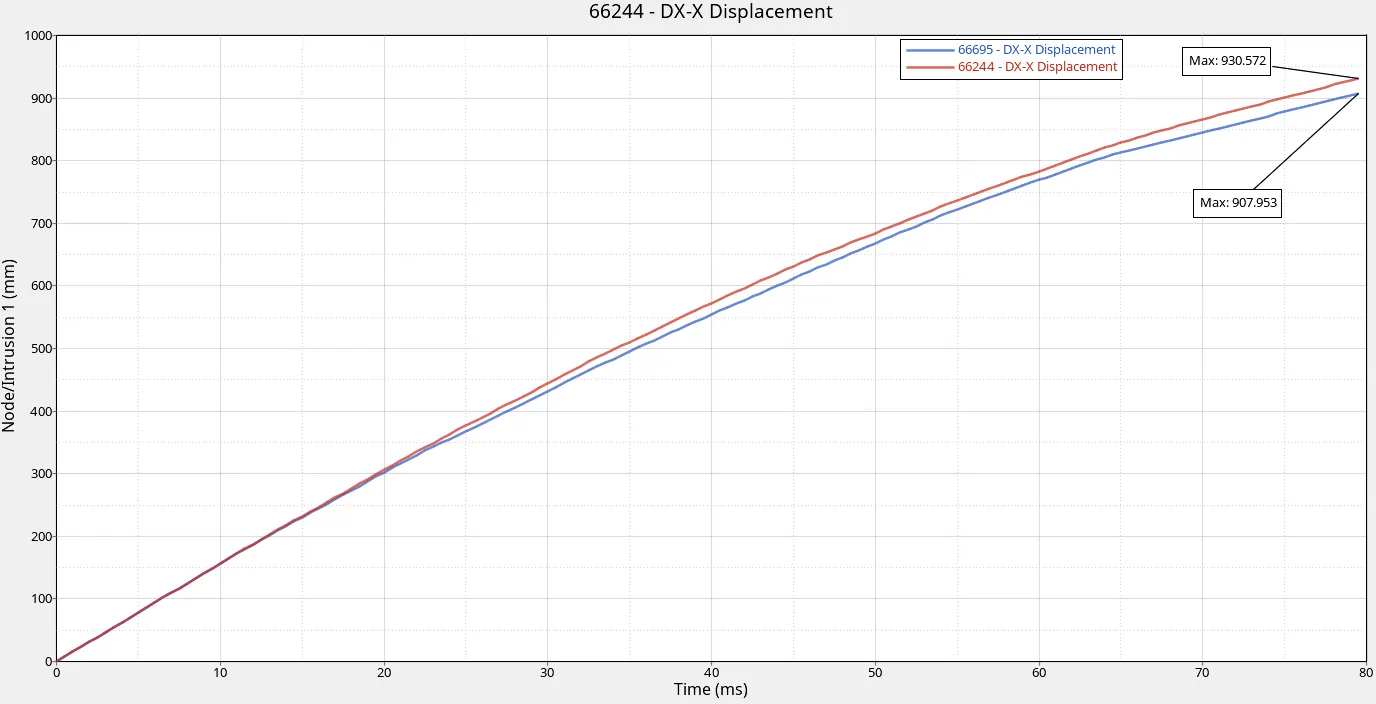
7) Displacement of the node to calculate intrusions at point 66695 and 66244
The intrusion can be measured by the relative displacement of the nodes just before the bumper touches the rigid wall to the final end of the simulation. Therefore we get that:
Node 66244: 930.572
Node 66695: 907.953
The variation of intrusions is very less for both the nodes at the pedal area.
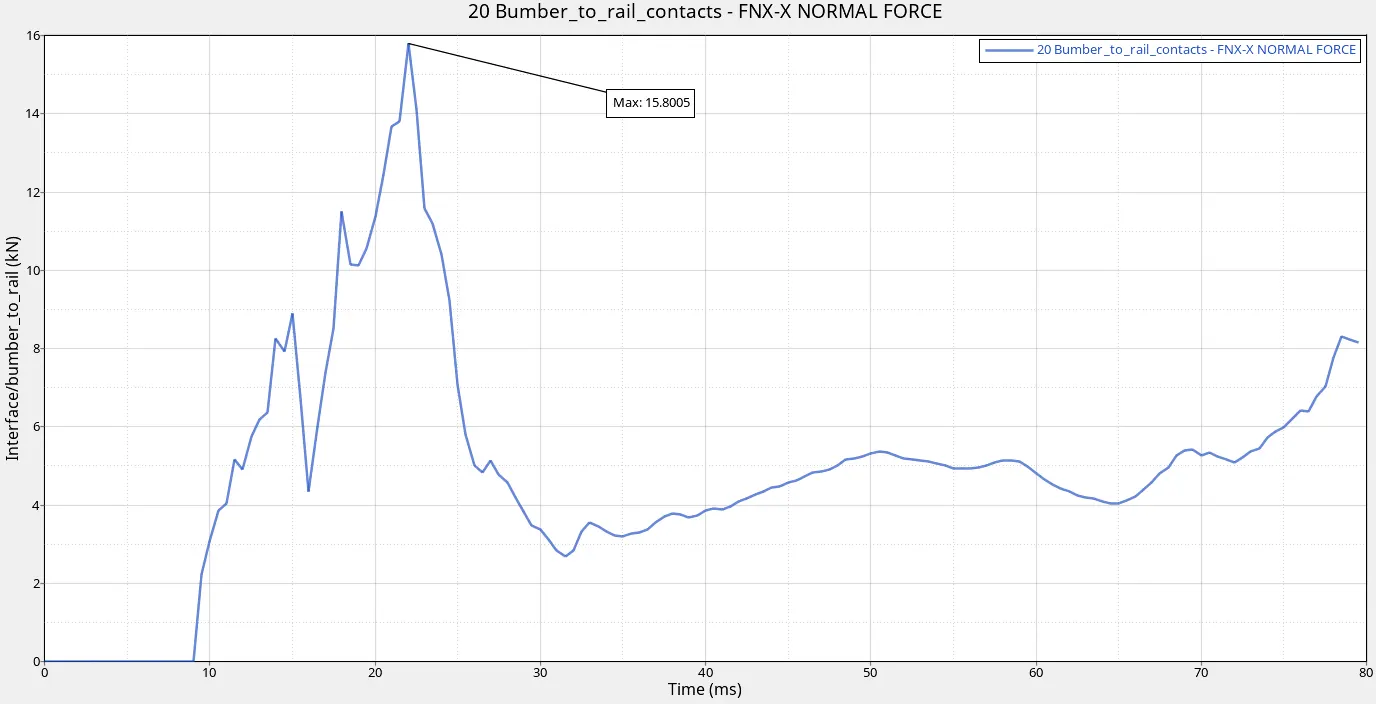
8) Axial force at the section of bumper to rail.
As we can see the axial force traveling from bumper to rail. The rail experiences a very high force value max. of 15.8 KN at 22 ms
CONCLUSION:
By completing this project we can see maximum deformation and by that maximum energy, the absorption is done on the bumper side, then via shotgun to the rails and A-pillars. Since as we know that the crushing area absorbs a lot of energy while deforming. Here these regions are made with material of good /high toughness such that they absorb a lot of energy from the collision and such that it helps in the occupant safety and moreover the occupant side parts will be made of the proper rigid material such that high strength and free from plastic deformation. The results and plots obtained are relevant to the actual condition of crash analysis.