Assignment 6
Aim :
Car frontal crash analysis and deck setup using hypermesh and hypercrash.
Objective:
- To check unit system and either follow[Mg mm s] or [Kg mm ms].
- To create appropriate interface ,friction 0.2 and recommended parameters.
- To make sure of no penetrations and intersection.
- To correct rigid bodies if any issues.
- To create rigid wall with friction 0.1.
- To compare the model weight with the full scale 300k nodes model and use added masses to reach target weight 700kg while getting CG about the required range.
- To create initial velocity 35 mph.
- To input Time-step :0.5 to 0.1 microseconds and Run 80 ms]
Abstract :
The term ‘structural crashworthiness’ is used to describe the impact performance of a structure when it collides with another object. A study into the structural crashworthiness characteristics of a system is required in order to calculate the forces during a collision which are needed to assess the damage to structures and the survivability of passengers in vehicles, for example. This topic embraces the collision protection of aircraft, buses, cars, trains, ships and offshore platforms, etc and even spacecraft . No attempt is made to review the entire field and only that part which is related to dynamic progressive buckling introduced in the previous chapter is discussed briefly.
Vehicle crashworthiness is an important design attribute which designers strive to improve. However, design for structural crashworthiness is a difficult task. A vehicle structure must have strength to shield the passenger compartment, as well as compliance to cushion the impact energy. The best known analysis method for crashworthiness performance prediction is nonlinear finite element (FE). FE analysis of detailed vehicle models requires enormous computational resources thereby hindering the success of general-purpose optimization approaches. An approach which is more of an art than a formal procedure is that of crash mode matching. Qualitatively, the crash mode is the observed gross-motion of the structure and its time history of deformation in various zones. Crash mode matching involves adjusting the design variables of the structure in order to achieve a desirable structural deformation history, which an experienced designer can typically do while requiring only a few trial FE runs. This dissertation to develops an algorithmic methodology by formalizing this crash mode matching approach. A quantitative representation of the crash mode is introduced as a matrix of time series of the structural deformation history, with dimensions of the matrix being the structural location and type of deformation. A comparison metric is then introduced for the degree of matching between crash modes as the integral of the error between the time series. An automated algorithm for crash mode matching heuristically directs stochastic sampling of the design space by adjusting the mean and standard deviation of normal distributions on the design variables. Adjustment of the mean and standard deviation is performed via Fuzzy logic rules that are defined by the algorithm user in analogy to the type of decisions that an experienced designer would make. Stochastic search allows for global convergence properties, as well as accounting for different expert designers sometimes having different opinions on how to modify a design. Implementation of the proposed framework is applied to two real-life case studies involving front half of a vehicle, as well as full vehicle models. The studies show success in attaining high performance designs, while requiring a modest number of FE runs, hence reasonable computational resources.
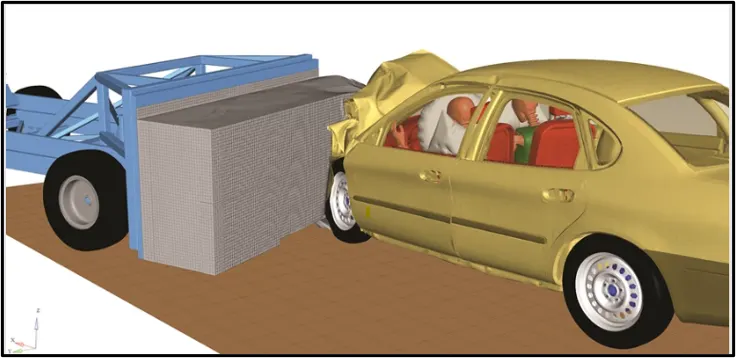
Crash Test
A crash test is a form of destructive testing usually performed in order to ensure safe design standards in crashworthiness and crash compatibility for various modes of transportation (see automobile safety) or related systems and components.
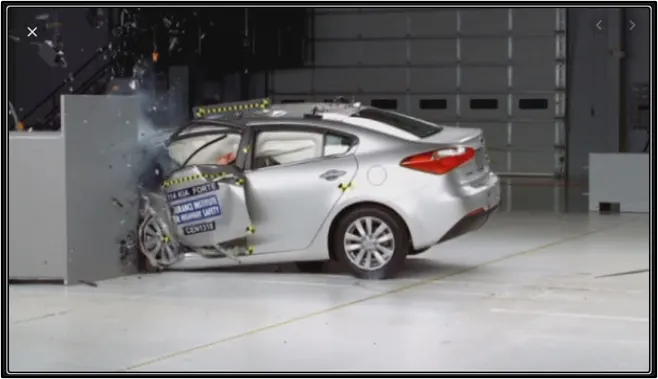
Types of Crash Test :
- Frontal-impact tests: which is what most people initially think of when asked about a crash test. Vehicles usually impact a solid concrete wall at a specified speed, but these can also be vehicle impacting vehicle tests. SUVs have been singled out in these tests for a while, due to the high ride-height that they often have.
- Moderate Overlap tests: in which only part of the front of the car impacts with a barrier (vehicle). These are important, as impact forces (approximately) remain the same as with a frontal impact test, but a smaller fraction of the car is required to absorb all of the force. These tests are often realized by cars turning into oncoming traffic. This type of testing is done by the U.S.A. Insurance Institute for Highway Safety (IIHS), EuroNCAP, Australasian New Car Assessment Program (ANCAP) and ASEAN NCAP.
- Small Overlap tests: this is where only a small portion of the car's structure strikes an object such as a pole or a tree, or if a car were to clip another car. This is the most demanding test because it loads the most force onto the structure of the car at any given speed. These are usually conducted at 15-20% of the front vehicle structure.
- Side-impact tests: these forms of accidents have a very significant likelihood of fatality, as cars do not have a significant crumple zone to absorb the impact forces before an occupant is injured.
- Pole-impact tests: A difficult test which places a large amount of force on a small proportion on the side of the vehicle.
- Roll-over tests: which tests a car's ability (specifically the pillars holding the roof) to support itself in a dynamic impact. More recently, dynamic rollover tests have been proposed in lieu of static crush testing (video).[1]
- Roadside hardware crash tests: are used to ensure crash barriers and crash cushions will protect vehicle occupants from roadside hazards, and also to ensure that guard rails, sign posts, light poles and similar appurtenances do not pose an undue hazard to vehicle occupants.
- Old versus new: Often an old and big car against a small and new car,[2][3] or two different generations of the same car model. These tests are performed to show the advancements in crash-worthiness.[citation needed]
- Computer model: Because of the cost of full-scale crash tests, engineers often run many simulated crash tests using computer models to refine their vehicle or barrier designs before conducting live tests.
- Sled testing: A cost-effective way of testing components such as airbags and seat belts is conducting sled crash testing. The two most common types of sled systems are reverse-firing sleds which are fired from a standstill, and decelerating sleds which are accelerated from a starting point and stopped in the crash area with a hydraulic ram. It can also be used to evaluate the whiplash protection of a vehicle's seat.
Procedure:
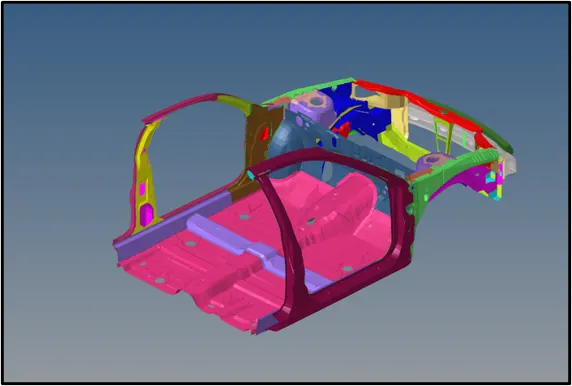
Import the given model into hypermesh using the import command:
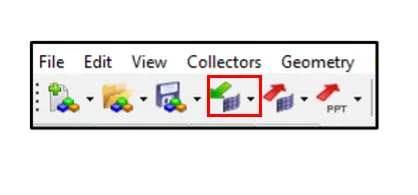
- Click on the import command on the tool bar.
- Select the appropiate file type from the drop down menu (i.e RADIOSS).
- Browse the file which is required to import.
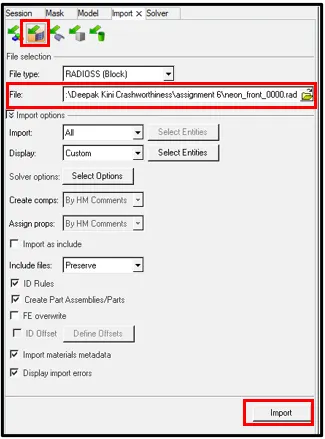
- Click import from the bottom and the required model will be displayed on the Hypermesh workbench.
Deck Setup :
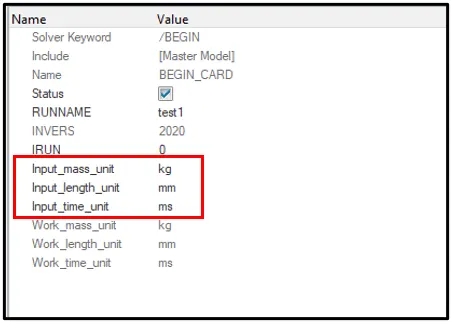
1) Check unit system and either follow[Mg mm s] or [Kg mm ms].
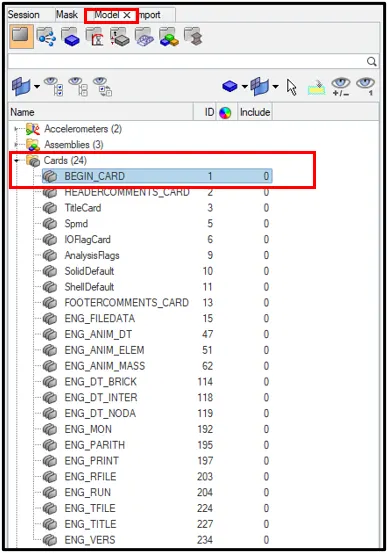
Check the unit system in the begin card from the model browser.
2) Create appropriate interface ,friction 0.2 and recommended parameters.
Interface TYPE7 is a multi-usage impact interface, modeling contact between a master surface and a group of slave nodes. It is also possible to consider heat transfer and heat friction.
- A node can at the same time be a slave and a master node.
- Each slave node can impact each master segment; except if it is connected to this segment.
- A node can impact on more than one segment.
- A node can impact on the two sides, on the edges and on the corners of each segments.
- It is a fast search algorithm without limitations.
- Time step is reduced in case of high impact speed or contacts with small gap.
- It does not work properly if used with a rigid body at high impact speed or rigid body with small gap.
- It does not solve edge to edge contact (to solve this,
/INTER/TYPE11should be used along with TYPE7).
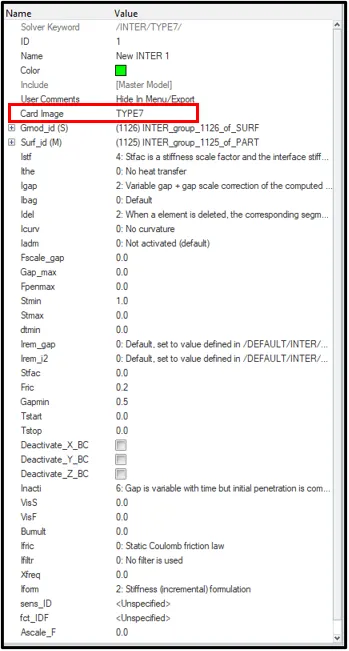
Review the model after assigning the recommended values.
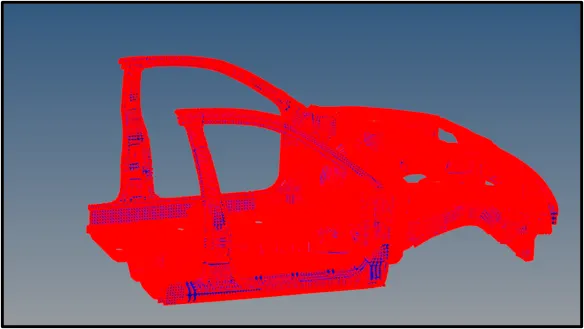
3) Check for penetrations and intersections.
Penetration is defined as the overlap of the material thickness of shell elements, while Intersection is defined as elements that actually pass completely through one another. All models and especially impact models should be checked for penetrations and intersections and depenetrated to ensure the integrity of the model. Penetrations adversely affects results and should be removed.
Check for the penetrations and intersections so as to make the model collision free. Go to tools and click on check penetration.
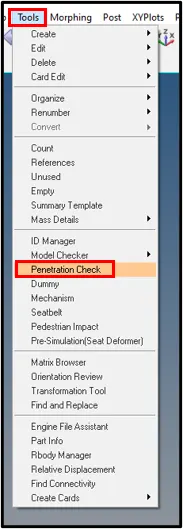
Select all the elements in the model and click on check.
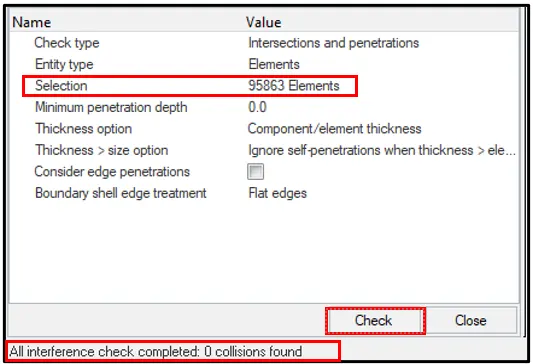
In this model we can see that there are zero collisions found.
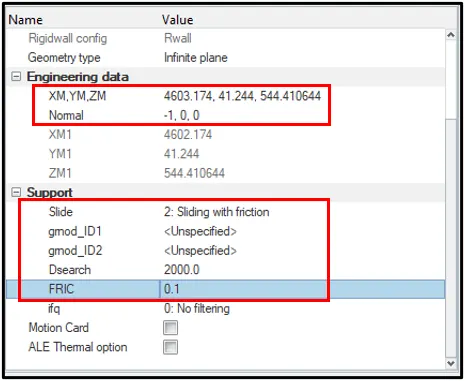
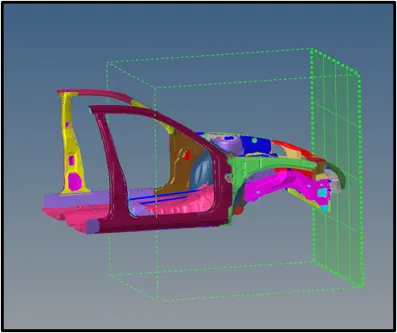
4) Create rigid wall with friction 0.1.
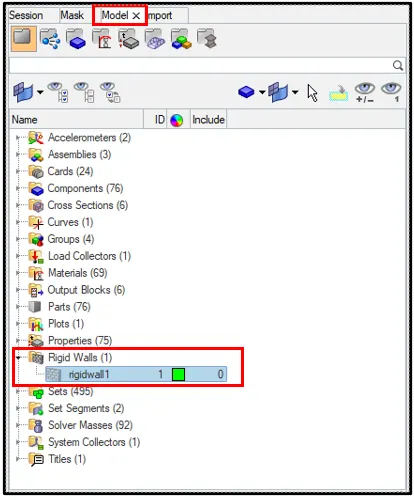
A rigid wall is a nodal constraint applied to a set of slave nodes in order to avoid the node penetration to the wall. If contact is detected, then the slave node acceleration and velocity are modified. Mainly to constrain movement of a moving body after impact, We will be using a cylindrical wall. An infinite cylindrical wall is a cylinder which extends to infinity. It is defined with two points (or one point and one node) and a diameter. Note that contact is only possible from outside the cylindrical wall.
Rigid wall entities provide a method for treating a contact between a rigid surface and nodal points of a deformable body. In the LS-DYNA and Radioss user profiles, rigid walls can be created in the Model and Solver browsers.
- Go to Solver Browser > Create > RWALL
- Select the type of rigid Wall as plane.
- Select the created nodes where rigid wall as to be created.
- Define the distance for slave search (D_search).
- Define the friction coefficiant as 0.1 (Input data).
5) Compare the model weight with the full scale 300k nodes model and use added masses to reach target weight 700kg while getting CG about the required range.
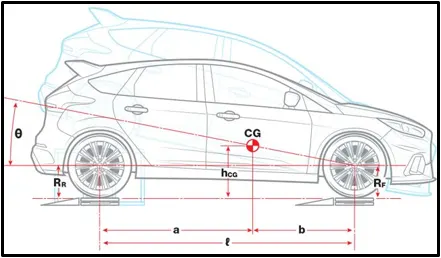
A vehicle’s center of gravity, or CG, is the theoretical point where the sum of all of the masses of each of its individual components effectively act. In other words, from a physics perspective, a vehicle behaves like its entire weight resides at this one point (this is why, in physics class, this is where all forces and moments that are acting on a body are applied). Carrying weight up high, such as a panoramic sunroof will raise a vehicle’s CG while placing heavy subsystems low in a vehicle, such as a battery pack, will work to lower it. Lower is better from a handling standpoint, as it reduces weight transfer during cornering and braking, and it also reduces the propensity to roll over.
The graphic user interface of Mass Balancing has been redesigned. Applying mass balancing on a selection of parts and defining an arbitrary orientation for a car alignment is now available.
Mass Balancing for RADIOSS is more accurate particularly for cases where mass was removed as a result of the balancing.
- Import the model into hypercrash.
- Go to Mass>Balancing
- Total Weight of the given model is aaprx 188kg
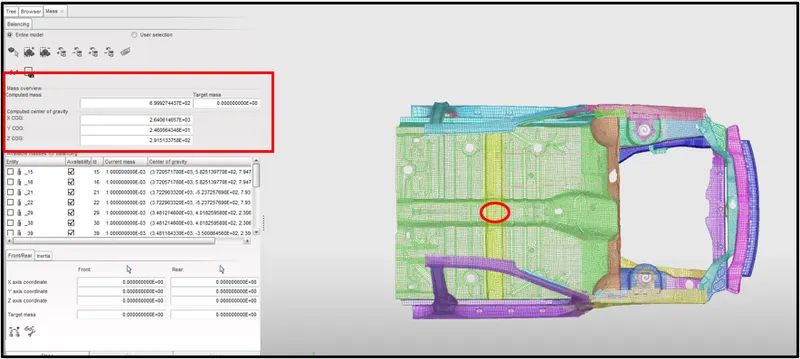
In the added mass list, the green rigid bodies have a correct definition, the orange ones have to be checked, and the red ones have a bad definition. HyperCrash can automatically or semi-automatically correct the added masses with errors or warnings.
Go to Load case>Added Mass.
Add Mass to the Suitable Component on the Floor Panel.
6) Initial velocity 35 mph.
The initial velocity,vi is the velocity of the object before acceleration causes a change. After accelerating for some amount of time, the new velocity is the final velocity, vf. initial velocity = final velocity - (acceleration×time) vi = vf - at. vi = initial velocity (m/s).
• Initial velocity can be added both in Hypermesh and Hyper crash
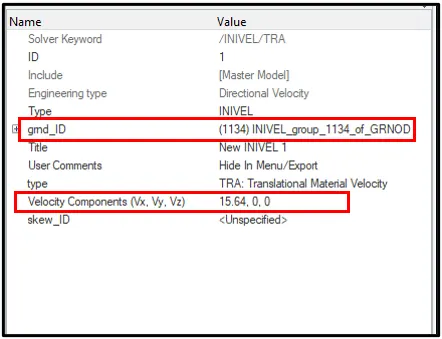
• In hypermesh, click on Solver Browser >Create > INIVEL.
• In this we can initialize both translational and rotational velocities on a group of nodes in a given coordinate system.
• Define the Node group on which specified initial velocities are applied(grnd_ID1).
• Define the Type of Velocity (Translational /Rotational).
• Apply the velocity in translational X Direction, define the velocity (15.646mm/ms).
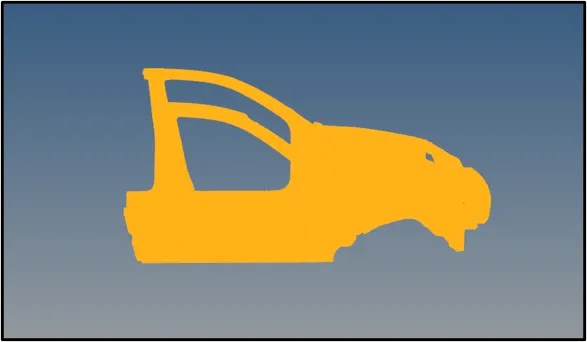
• Thus the Initial Velocity is applied as shown in the Figure
7) Creating Acclerometer at both the sides of the B pillar.
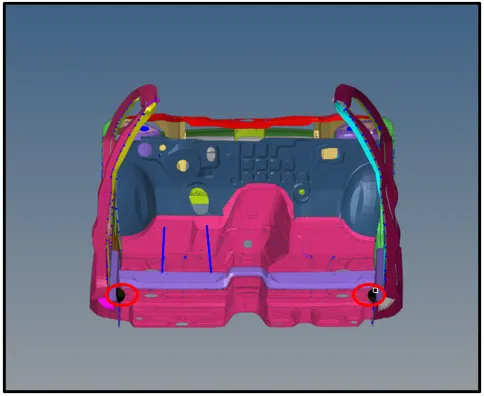
Accelerometer entities measure acceleration in the simulation. In the Radioss interface, Accelerometer entities are defined by a node and a local coordinate system of type SKEW. This coordinate system is not mandatory. If it is not defined, accelerations are measured in the global coordinate system, otherwise, in the defined local coordinate system.
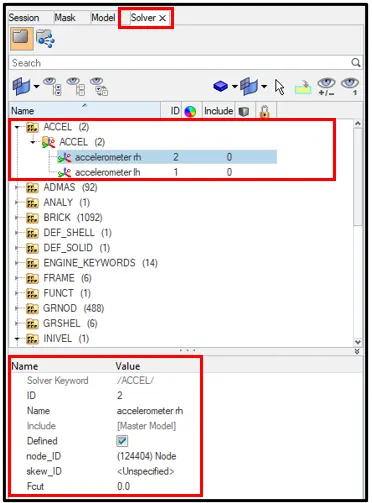
To create a accelerometer,
- Click on Solver Browser > Create > ACCEL
- Select the node as ti where to place the accelerometer.
- Select the skew if required.
8) To create sectional force at A and B pillars, rails,shot gun and bumpers.
A section is a cut in the structure, where forces, moments or energy will be computed and stored in output files (using /TH/SECTIO). In Radioss /SECT, /SECT/PARAL and /SECT/CIRCLE can be used to define a section.
- A cutting plane (which defined either by 3 points or by parallelogram or by a circular disk)
- A reference point to compute forces
- A direction of the section
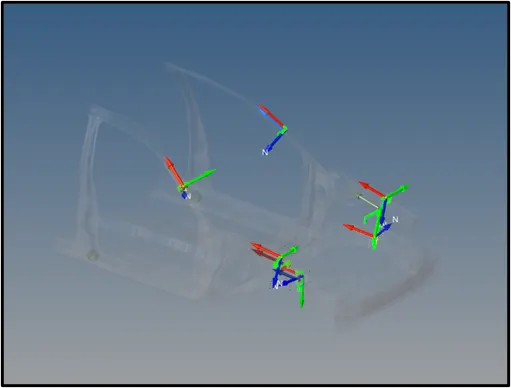
To create the section force, skews and frames need to be created initially. Skews and frames are used to define local directions.
- Boundary conditions
- Concentrated load
- Fixed velocity
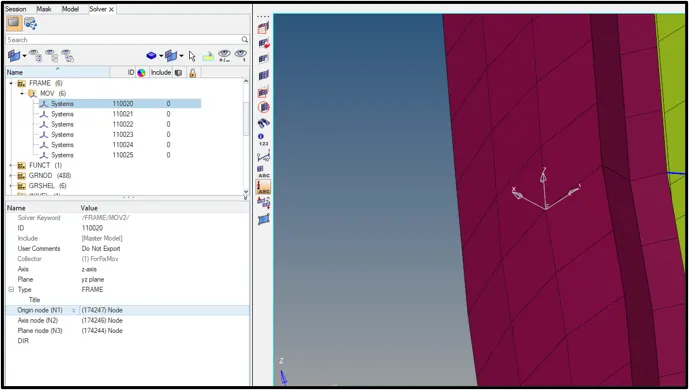
It is a mobile or fixed reference. The quantities are computed with respect to the origin of the frame which may be in motion or not depending on the kind of reference frame. For a moving reference frame, the position and the orientation of the reference vary in time during the motion. The origin of the frame defined by a node position is tied to the node.Frame measures relative motion whereas skew measures global motion and projects it to skew. Only few options use frame like imposed velocity, TH/NODE and others use skew.
- To create the frame, click on Solver Browser > Create> FRAME.
- Define the nodes, as it acts as the axis of the frame
- The required frame will be created.
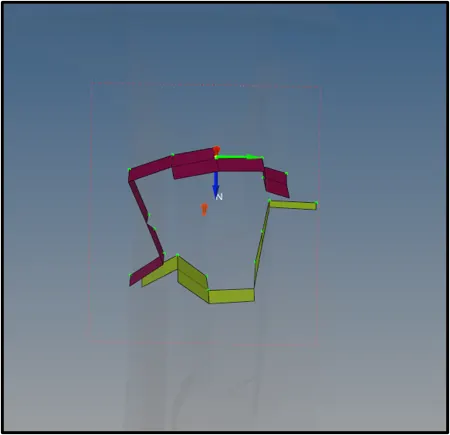
Once the frame is created , create sections at required areas.
• To Create the Frame, click on Solver Browser > Create > SECTIO.
• Define the Nodes with reference to the Axis of the Frame.
• Enter the values of Delta T and Alpha Value as 0.1 and 1.67 respectively.
• Define the cutting plane by a group of elements and its orientation by a group of nodes(grshell_ID)
• Hence, the sections will be created.
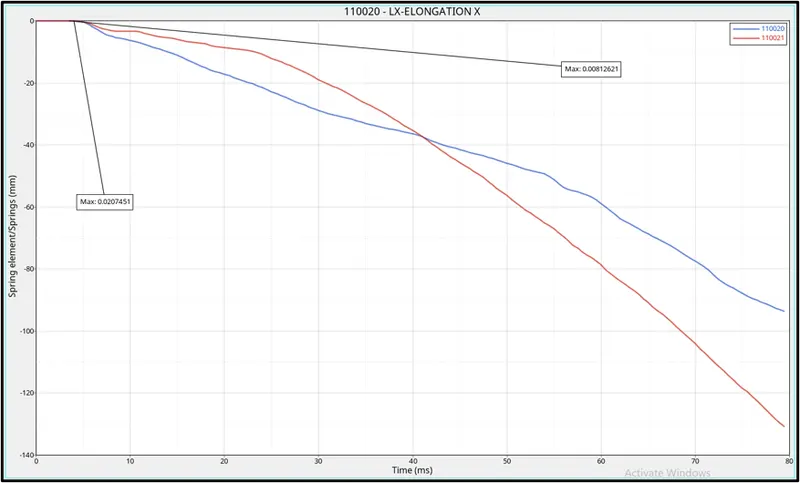
9)Intrusions on the dash wall 66695,66244.
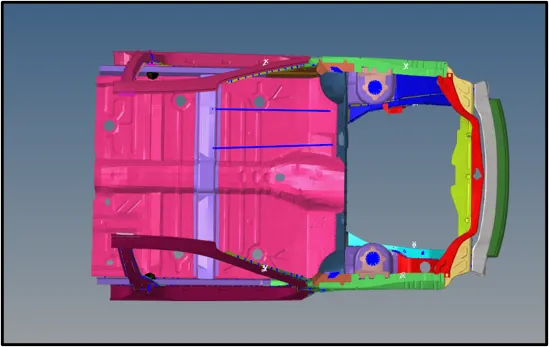
To check the intrusions, create the 1d spring connection.
Click on 1D > springs > Select 2 nodes
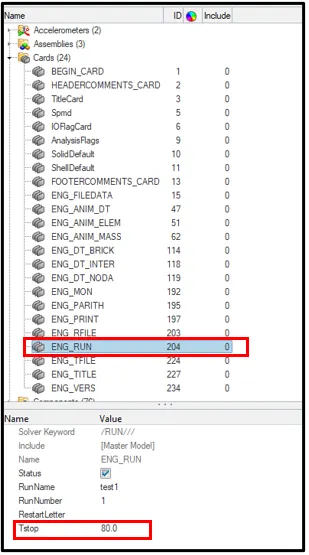
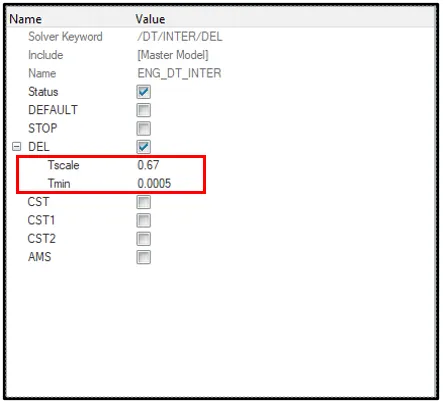
10)Check Model cards and change Time-step 0.5 to 0.1 microseconds and Run time 80ms
11) To create output request
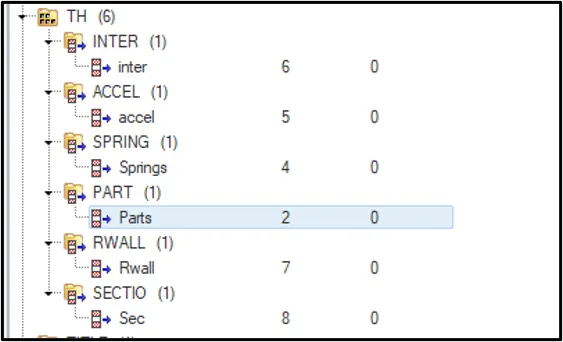
After finishing the Deck setup, create the output request in TH.
• To create output request, click on Solver Browser > TH> Select the required output.
• Select the Entity for wich the output is required.
12) Model Check
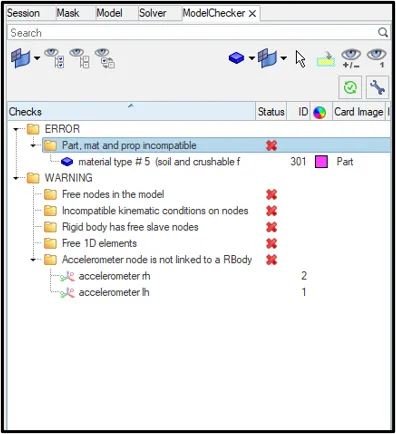
Check the solver validity of the model, identify modeling issues, and fix modeling issues in an automatic or manual way.
- Interactively creating/editing checks and corrections
- Changing the level of checks
- Organizing checks in custom folders
- Activating/deactivating checks
- Saving/reading Model Check configurations to/from an .xml file
13) Run the simulation.
- From the subpanel below, click on Analysis > Select the save location > click Radioss.
- Simulation will start.
Results and Comparison:
1) Energy and Mass error:
- At the end of the simulation, do the energy error and mass error checks and determine whether results would be acceptable
- Open the save location file and click on the output file of the simulation to check for the Energy error and Mass error.
- If the error is negative, it means that some energy has been dissipated.
- In case of under integrated elements (Belytschko shells, solids with 1 integration point), the Hourglass Energy can explain a negative Energy Error since it is not counted in the energy balance. The normal amount of Hourglass energy is about 10% to 15%.
- If the error is positive, there is an energy creation.
- In case of using QEPH shell formulation or fully integrated elements, the Energy Error can be slightly positive since there is no Hourglass energy and the computation is much more accurate. An error of 1% or 2% will be acceptable.
- In case of a larger positive energy, the source of this energy has to be identified. Incompatible kinematic conditions can lead to such a situation.
- If the error reaches ±99%, the computation has diverged; except in the first cycle of a run for which the initial energy of the system was null, so that a relatively false energy balance often introduces large relative error

Maximum Energy error was found to be -2.2% and Maximum Mass error was found to be 0.
2) Von Misses Stress:
The von Mises stress is used to predict yielding of materials under complex loading from the results of uniaxial tensile tests. The von Mises stress satisfies the property where two stress states with equal distortion energy have an equal von Mises stress.
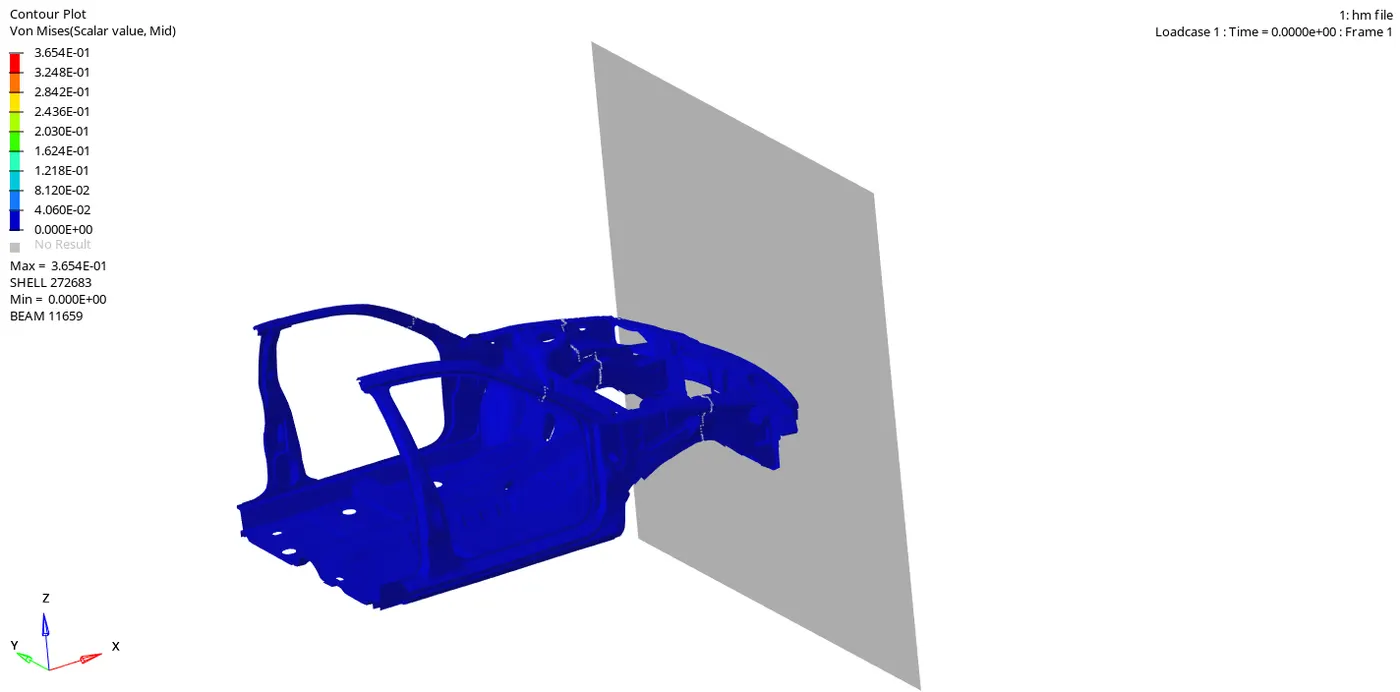
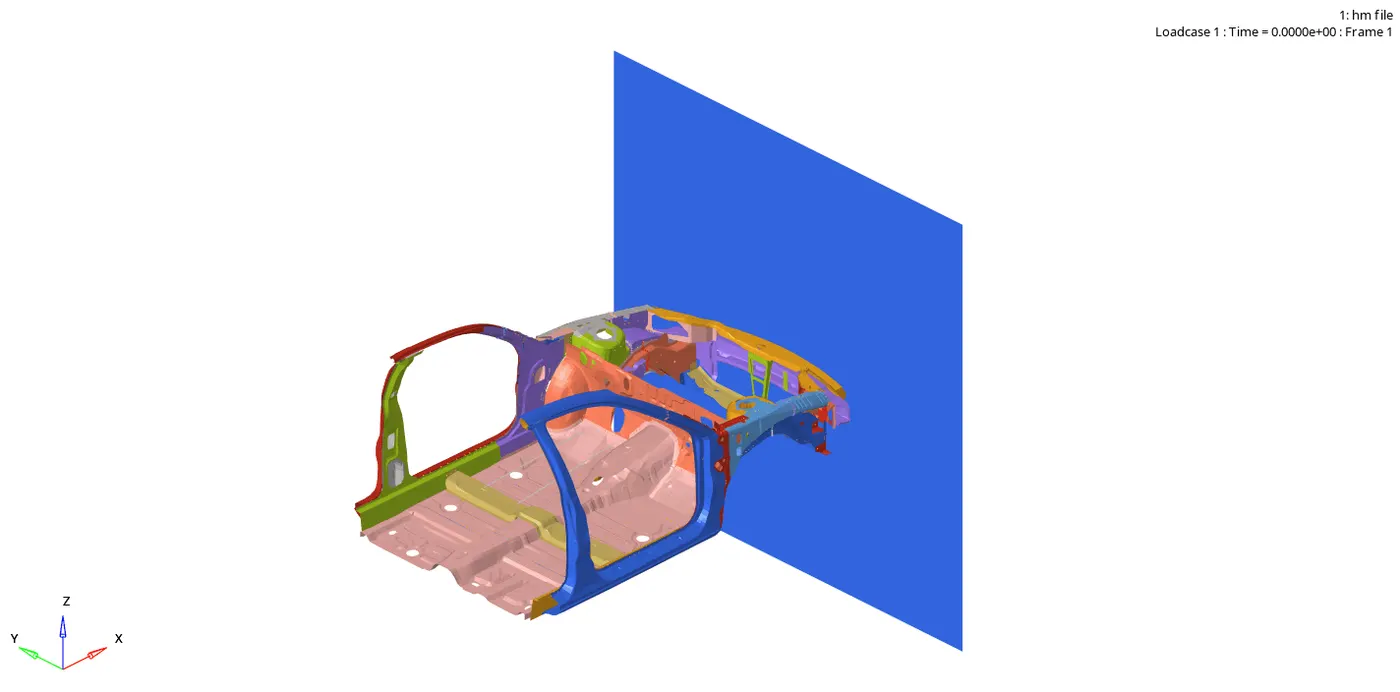
From the above simulation, the maximum stress acting was found to be 3.654E-01.
3) Energy Plots :
- Internal and Kinetic Energy
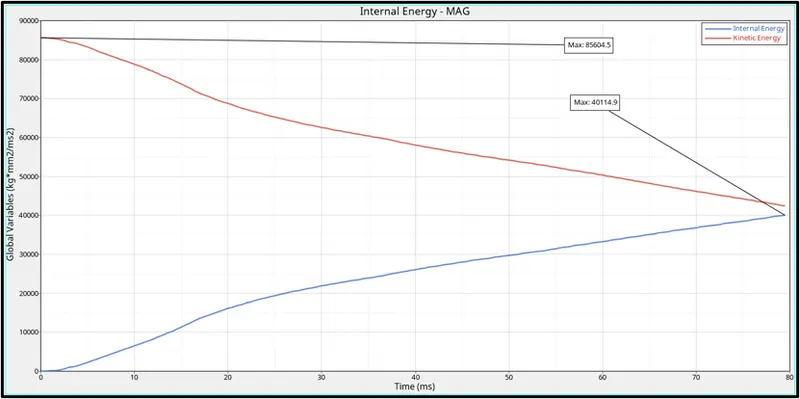
Initially, the kinetic energy will be high when the force is applied on the body. On the first impact, the car starts to deform and the surrounding energy is stored in it. Because of this stored surrounding energy, the internal energy starts to increase. The kinetic energy decreases when the impact happens and the absorbed energy increases which inturn increases the internal energy. During maximum deformation, ther velocity will become zero and the kinetic energy will also dip down to lower value. Due to this drop down in kinetic energy there will no energy to absorb for the car which forces the internal energy to be contant thereafter.
- Contact and Hourglass Energy
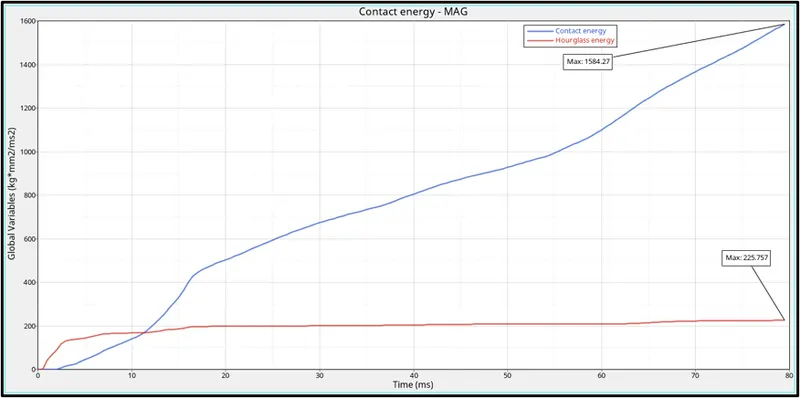
Contact energy is the energy acting opposite to the system to prevent the penetration acting on the system. When the force is applied on the body, the car starts to deform but the penetration happening is low in initial stage. The contact energy will be low. Once the deformation is maximum, the elements will be forced to penetrate but the opposite force which is contact energy will also increase which helps in the prevention of penetration. Once the defromation ends, the contact energy will become zero and will stay constant thereafter.
In case of using QEPH shell formulation or fully integrated elements, the Energy Error can be slightly positive since there is no Hourglass energy and the computation is much more accurate. An error of 1% or 2% will be acceptable. From the above graph, we can study that the hourglass energy value is very small because of the QEPH shell formulation.
4) Sectional Force :
- Section force at the rails (LH & RH)
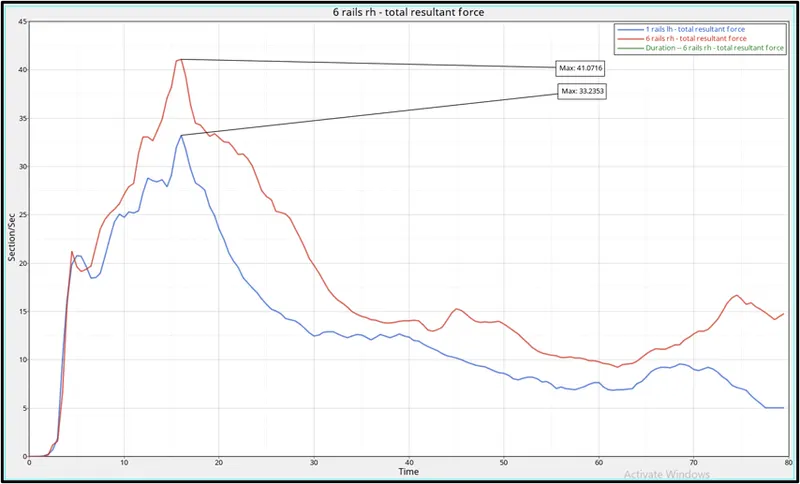
The force acting on the rail is the force transmitted by the bumper during the crash. The force transmitted by the bumper to the rail can be unequal due to which the force recieved at the LH rail may differ with RH rail. During crash, the rail will get into direct contact with the rigid wall which will increase the compressive force and then deform. THerefore, the compressive force drops down.
Maximum sectional force at rail LH = 41.0716 KN at t=16 ms
Maximum sectional force at rail RH = 33.2353 KN at t= 16 ms
- Section force at the Shotgun(LH & RH) :
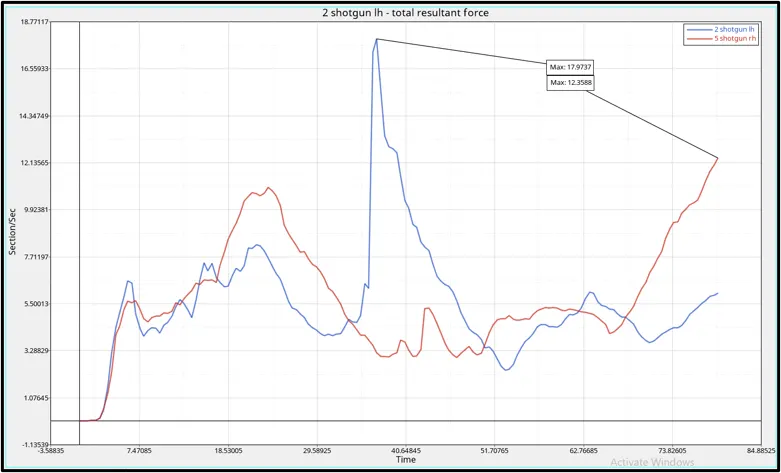
During crash, the force caused in bumper is transmitted to the rails. The force propogated from the bumper to the LH rail will vary to that of the RH rail. Now, the force going into the shotgun will depend on the force transmitted from the rails of their respected sides. Therefore the force exerted by the LH shotgun might vary from that of the RH shotgun and hence the compression can happen in different manners. Once the compression force acting on the car reaches its maximum value, the car starts to deform very quickly. Once the compression force reaches maximum the value of it starts to drop down. Further during the crash, the shotgun itself will come into direct contact with the rigid wall. Now, the opposite force given by the rigid wall will directly contact the shotguns and hence the increase the force again.
Maximum sectional force at shotgun LH = 17.97 KN at t=37 ms
Maximum sectional force at shotgun RH = 12.35 KN at t= 79.5 ms
- Section force at the pillars (LH & RH) :
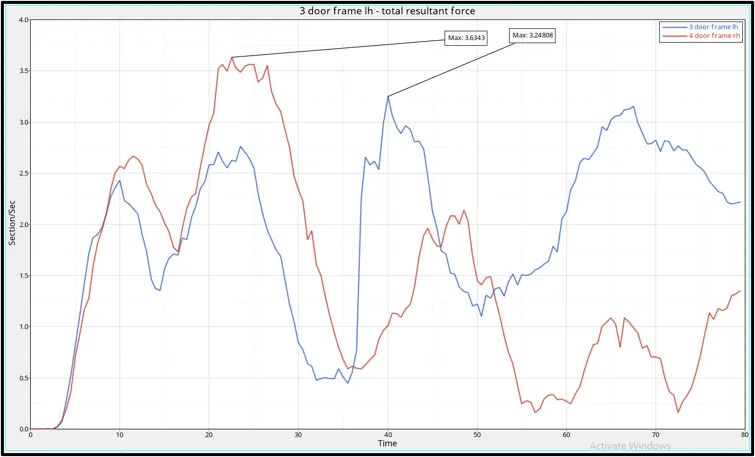
When the car hits the rigid wall, there will be some amount of force coming in to the A pillar at both the sides. These force coming to the A pillar are nothing but the force transmitted from the rail and the shotgun. The force flowing into the LH and RH of the A pillars will not be equal and hence the deformation of the elements will differ accordingly. During frontal crash, the sectional force reaching the A pillars are coming in from the rails and shotgun, hence the force at the A pillars will be less when compared to the front sections. When the compressive force between the wall and car is maximum, the rail and shot gun gets in contact with the rigid wall which causes the shotgun and rail to exert more force. This force then propogates to the A pillars and hence the force reaching the A pillar increases again.
Maximum sectional force at pillar LH = 3.24 KN at t=40 ms
Maximum sectional force at pillar RH =3.63 KN at t= 22.5 ms
6)Axial force received on the rails from bumper.
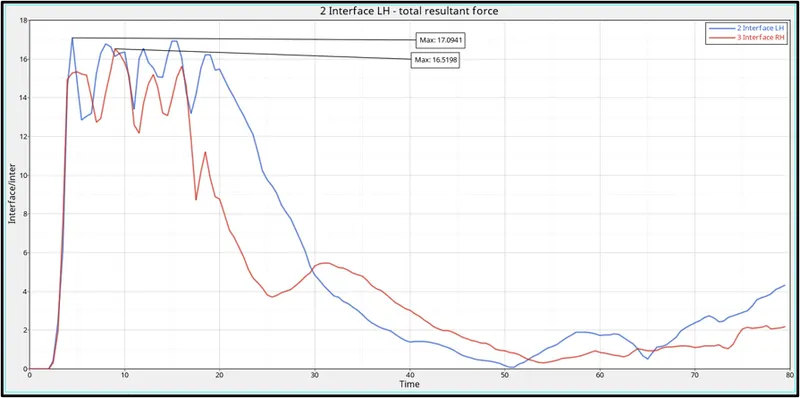
Initially the axial force trnasmitted from bumper to rail is zero. This is because the car has not crashed with the wall initially. When the car starts to hit the rigid wall the bumper starts to deform trasmitting the enerfy to the rails.
7) Intrusions on the dash wall 66695,66244
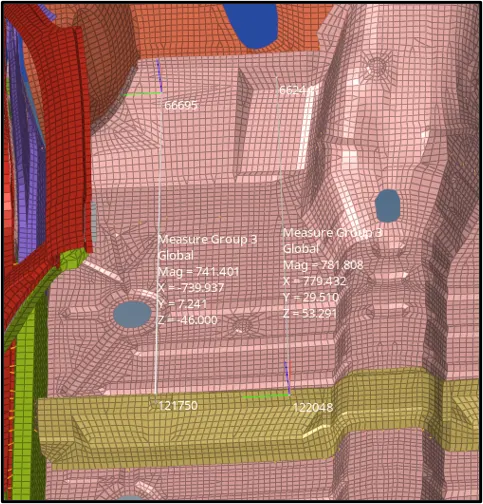 Intrusion before crash
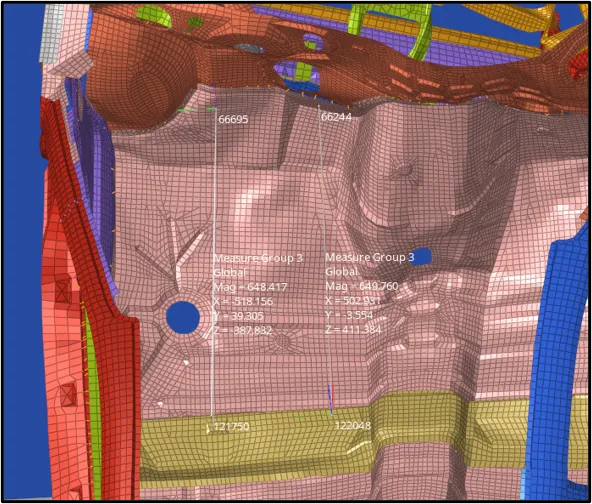 Intrusion after crash
To check the intrusions happening during the crash, a spring connection is to be created at the particular node. Intrusions will be calculated at that particular node nad check for the safety of the driver. From the animation we can say that the deformation caused is low at that particular node and hence the driver might be safe.
8) Acceleration curve received on the accelerometer at base of B pillar (on B pillar rocker).
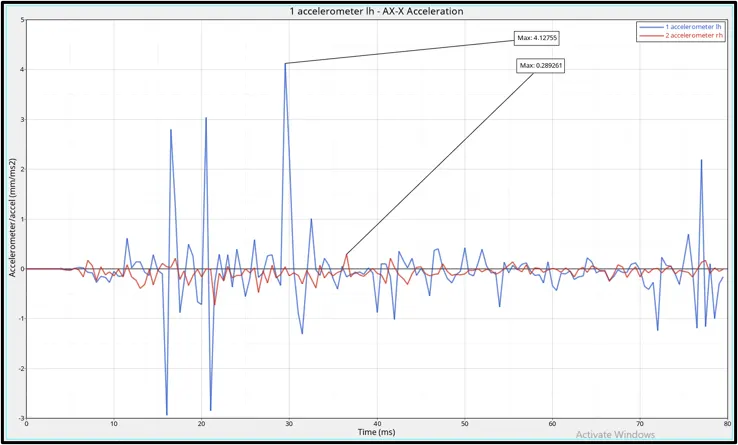
As explained earlier, accelerometer measures the accleration during the simulation. From the graph, the accleration is steady before the car actually starts to crash. Once the car crashes the rigid wall, the kinetic energy gets converted to internal energy because of the deformation in body and later getting the car to stop. During the crash, the acceleration of the car will not be uniform and there will be vibration caused which increases the acceleration at certain times.
Maximum acceleration at LH = 4.12755 mm/ms2 at t=29.5 ms
Maximum acceleration at RH = 0.289 mm/ms2 at t=36.5 ms
Conclusion :
The given model was simulated for the frontal crash using Radioss and the results obtained were validated. The graphical results were plotted for all the test cases. From the simulation, it can be observed that there was minimum deformation in the cabin and also minimum intrusion were found in the drivers seat area.