Frontal Crash Analysis using Radioss in Hypermesh
AIM :
To test the vehicle crashworthiness by conducting a frontal crash test into a rigid barrier as per Standard requirements and evaluate the results by using Radioss in Hypermesh.
OBJECTIVE :
- Check unit system and either follow[Mg mm s] or [Kg mm ms].
- Create an appropriate interface, friction 0.2, and recommended parameters.
- Make sure of no penetrations and intersections.
- Correct rigid bodies if any issues.
- Create a rigid wall with friction 0.1.
- Compare the model weight with the full-scale 300k nodes model and use added masses to reach the target weight of 700kg while getting CG about the required range.
- Initial velocity 35 mph.
- Use a model checker to ensure good quality.
- Time-step :0.5 to 0.1 microseconds.
- Run 80 ms.
Output Requests :
- Sectional force in the rails at the location of indicated node 174247.
- The axial force received on the rails from the bumper.
- Shotgun cross-sectional forces.
- A pillar cross-section.
- Acceleration curve received on the accelerometer at base of B pillar (on B pillar rocker).
- Intrusions on the dash wall 66695,66244.
SOFTWARE USED :
- Radioss (In Hypermesh)
THEORY :
Federal Motor Vehicle Safety Standard (FMVSS) 208 :
Federal Motor Vehicle Safety Standard (FMVSS) 208 - Occupant Crash Protection establishes performance requirements to determine whether passenger vehicles, light multipurpose vehicles, and trucks meet conditions and injury criteria specified by the standard.
This report has addressed tests that assess the crashworthiness of a vehicle – the capability of a vehicle to protect its occupants in a collision. This is one aspect of crash compatibility. The other aspect of crash compatibility is aggressivity – the tendency of a vehicle to injure the occupants of the other vehicle in a vehicle-to-vehicle collision. This chapter examines the impact of each of the candidate test procedures on crash compatibility – particularly in frontal crashes.
In general, lack of crash compatibility arises from three factors:
• Mass Incompatibility
• Stiffness Incompatibility
• Geometric Incompatibility

Fig: Frontal Crash Analysis Test
Under the FMVSS No. 208 rigid barrier test, vehicle crashworthiness is evaluated by conducting a frontal crash test into a rigid barrier at an impact speed up to 56.3 kmph (35 mph). The auto industry has criticized this full frontal rigid barrier test using unbelted dummies claiming that it requires overly aggressive airbag designs. Their claim is that in order to meet this FMVSS No. 208 requirements, particularly with light trucks and vans (LTVs), they are forced to stiffen their vehicle front structures, which they assert would make these vehicles more aggressive in vehicle-to-vehicle collisions. It has been suggested that replacing the rigid barrier test with a more benign test, e.g., the Full Frontal Fixed Deformable Barrier (FFFDB) test, would lead to softer LTVs that would do less damage to another vehicle in a crash.
Impact, Crash, Safety Services Include:
• Occupant Safety
• Energy Absorption
• Vehicle Integrity
• Responses at predefined areas
• Acceleration
• Displacements
• Strain Rates
• Energy Absorption Rates at Crush Zones
Evaluation of Energy absorption :
The finite element simulations provide the ability to evaluate the energy absorbed by the structure of the Neon during the various crash simulations. Similar to the intrusion measurement, the energy absorption can indicate the likely extent of damage to the vehicle in the various test configurations.
Crash Response :
The characterization of the crash response as either “stiff” or “soft” only has significance if the two pulses lead to different levels of occupant injury potential. This evaluation is focused on the effects of the rate of increase and magnitude of the crash loading on the vehicle structure. The evaluation uses vehicle tests but will augment the test data with additional simulated test configurations. In order to provide additional crash response data, a series of finite element simulations using an available Dodge Neon model as the baseline vehicle was conducted. These simulations were run for a matrix of test methods and crash configurations so that a comparative analysis can be undertaken.
Cross-Sectional Force :
Cross-section forces – internal forces determined in the proper cross-section coordinate system. undersides – arbitrarily distinguished side of the bar, usually bottom side (hence – the name) characteristic interval – an interval where the cross-section forces have one equation each.
Axial Force :
An axial force is the compression or tension force acting in a member. If the axial force acts through the centroid of the member it is called concentric loading. If the force is not acting through the centroid it's called eccentric loading. An axial force is a force in the beam acting parallel to the longitudinal axis.
PROCEDURE :
1. Import the neon_front_0000 rad file using Radioss in Hypermesh
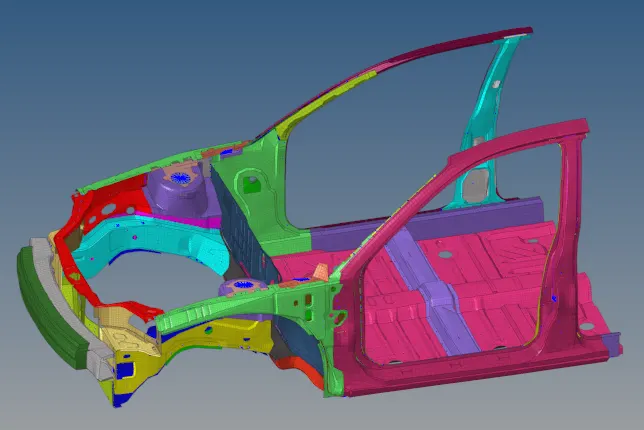
Fig: Imported Model
2. Open neon_front_0000 rad file in Notepad and Check the Unit System
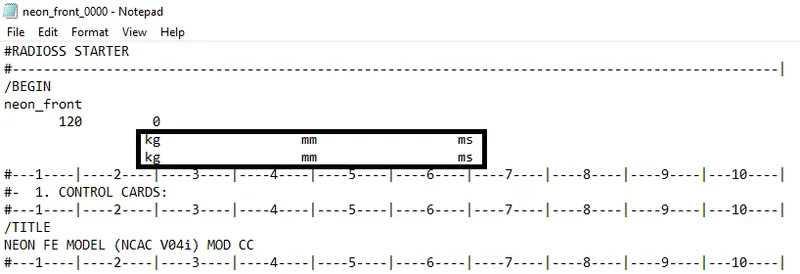
Fig: Unit System Verification
3. Create an appropriate interface with friction 0.2 and recommended parameters.
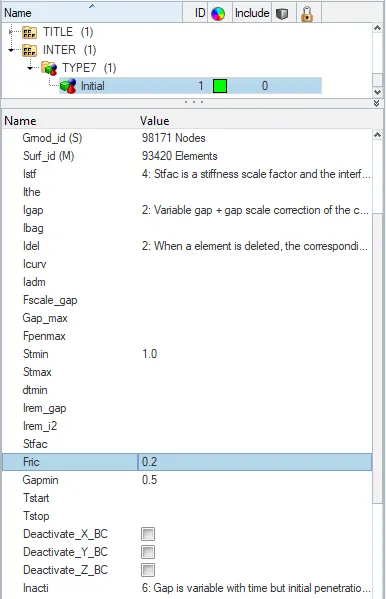
Fig: Type-7 Interface with Recommended Parameters
4. For Checking Penetration and intersection, Go to Tools-->Penetration Check option and Select the Groups and Click Check.
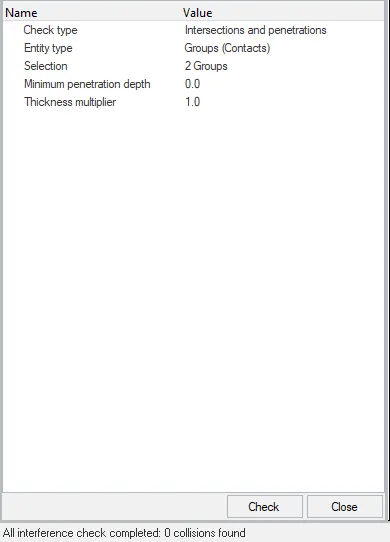
Fig: Penetration Check
5. Creating Rigid Wall by Right Click on Browsers-->Create-->RWALL-->PLANE option and Select the XM, YM, ZM Point to create a rigid wall, Select Slide-->Sliding with friction and Set Deformation range by assigning Dsearch value.
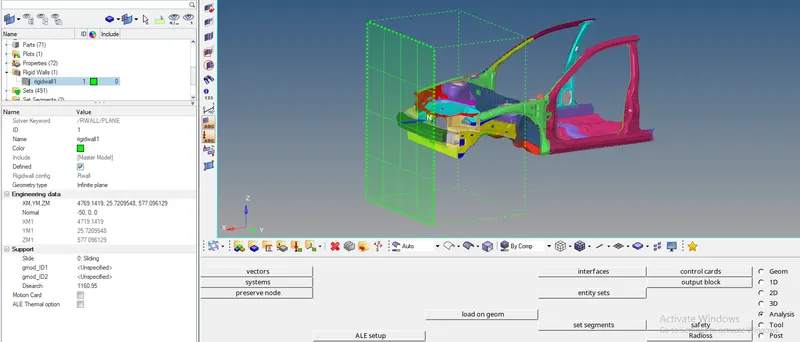
Fig: Rigid Wall Created
6. In Hypercrash, Comparing the model weight with the full-scale 300k nodes model and use added masses to reach the target weight of 700kg while getting CG about the required range.
7. Go to Mass-->Balancing Option and check the Mass & CG of the given Model.
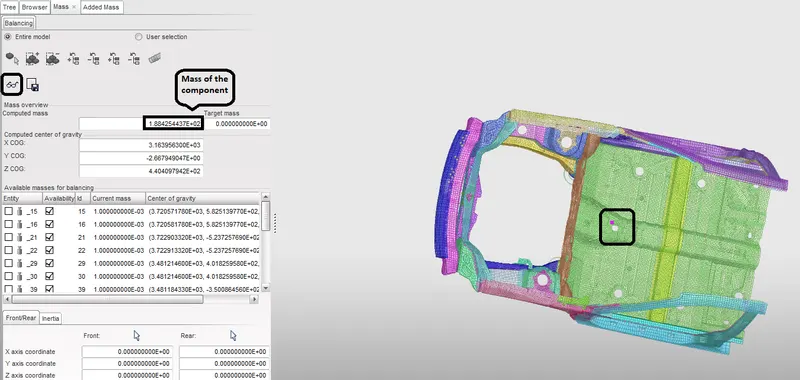
Fig: Mass Balancing
8. Go to Browser-->Added Mass option and Create a new object and add mass on the Component to get CG about the required range.
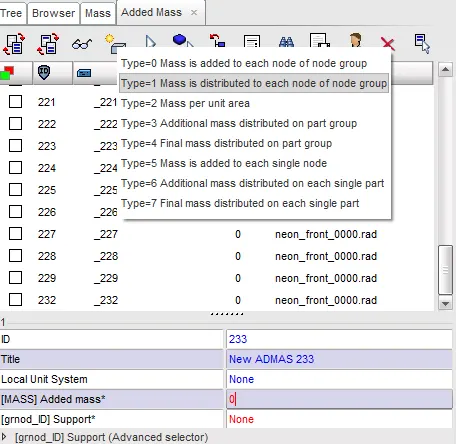
Fig: Added Mass
9. Enter Mass Value in Added mass and Right-click on Support-->Select in graphics-->Add or Remove nodes by picking selection (or) Include picked parts option and add the mass of the given model.
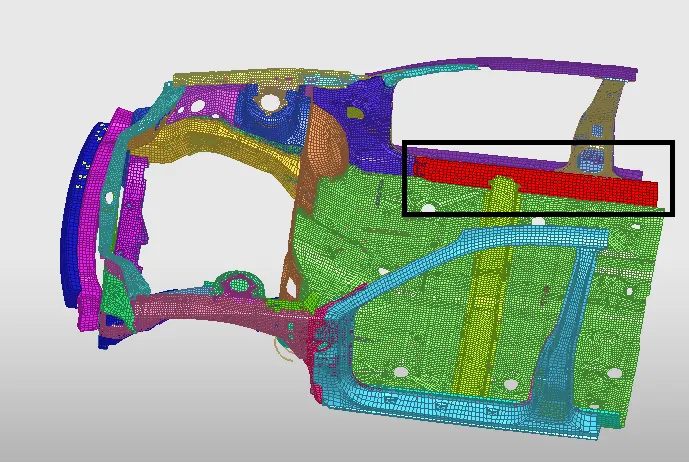
Fig: Picked Parts to add mass
10. By using added masses to reach the target weight of 700kg and got CG about the required range.
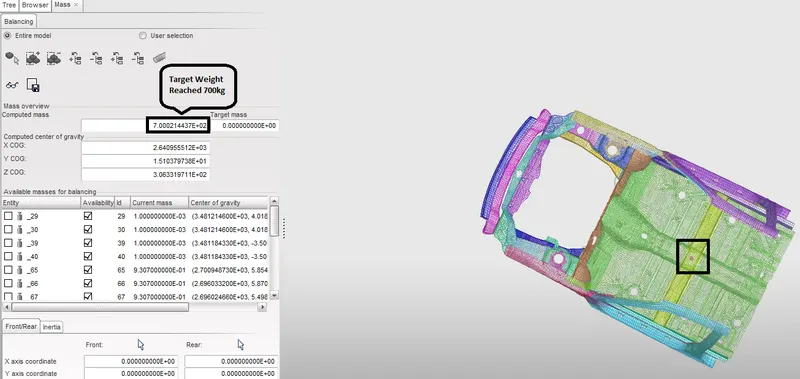
Fig: Target Weight reached and got CG about Required range
11. In Hypercrash, Go to Quality-->Model Checker-->Run option and Check if there is an error that occurred in the model.
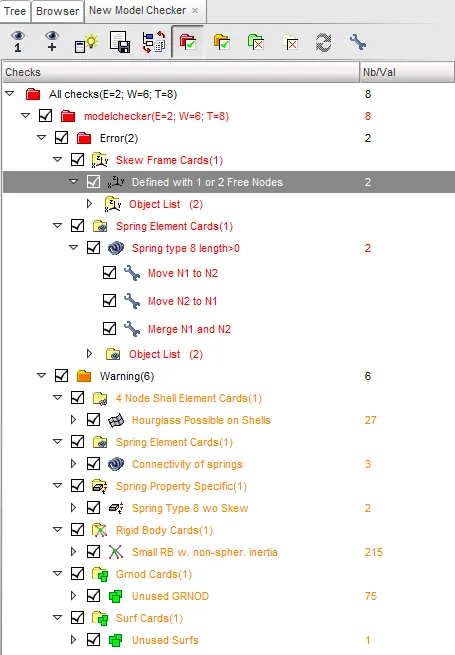
Fig: Model Checker
12. From the above figure window, it shows 2 Error and those two errors will be cleared and 6 Warnings are negligible.
13. Assuming the Initial Velocity as 35mph(15.64 mm/ms) by Right Click on Slover-->Create-->INIVEL Option and select the grnd_ID and Enter the Velocity value in mm/ms. Initial Velocity defines initial velocity on a group of nodes.
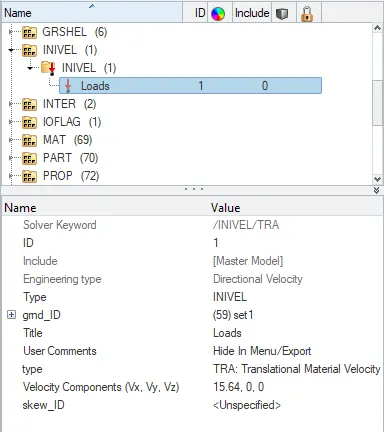
Fig: Assuming Initial Velocity
14. Go to Solver-->Engine Keywords-->DT-->DT/NODA option and Enter Time Step between 0.5 to 0.1 microseconds
15. Go to Solver-->Engine Keywords-->RUN-->ENG_RUN option and Enter the Simulation Run time as 80 ms.
OUTPUT REQUESTS :
Sectional Force :
1. Creating Sectional force in the rails at the location of indicated node 174247.
2. Go to Solver-->Right Click-->Create-->FRAME-->MOV option and Select Origin Node, Axis Node & Plane Node.
3. Go to Solver-->Right Click-->Create-->SECT-->SECT option and Select N1,N2,N3 nodes and in grshel_id select the Elements and set deltaT (Time for saving the data) as '0.1'.
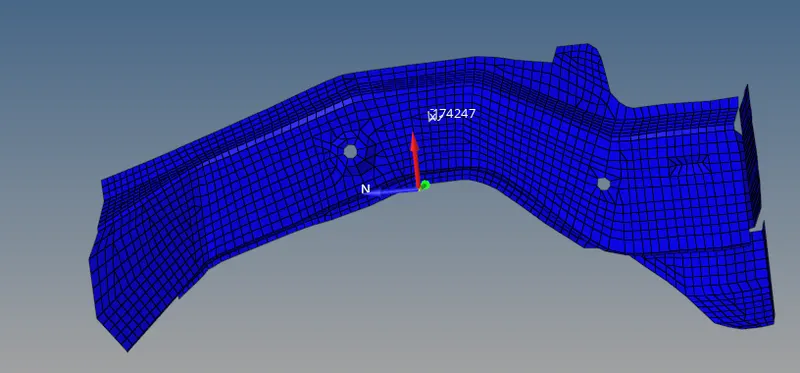
Fig: Sectional Force in rails (node 174247)
Axial Force :
4. Create Axial Force which receives on the rails from the bumper.
5. Go to Solver-->Create-->INTER-->new Type-7 Interface with recommended parameters and Select Master as Bumper and Slave as Rail.
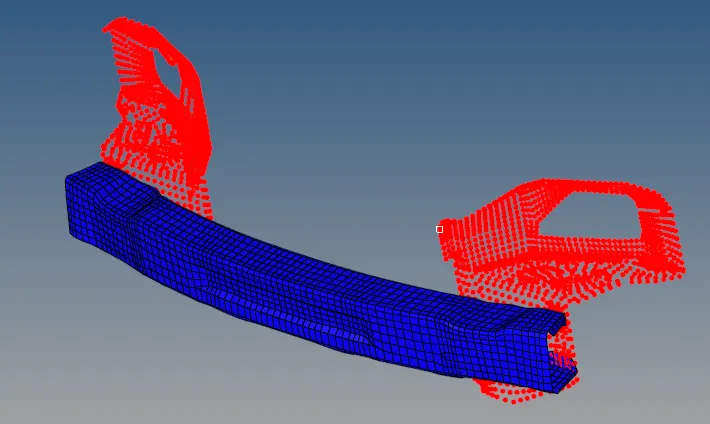
Fig : Bumper(Master) and Rail(Slave) Component
Shotgun Cross-Section :
6. Creating Shotgun Cross-Sectional Force,
7. Go to Solver-->Right Click-->Create-->FRAME-->MOV option and Select Origin Node, Axis Node & Plane Node.
8. Go to Solver-->Right Click-->Create-->SECT-->SECT option and Select N1,N2,N3 nodes and in grshel_id select the Elements and set deltaT as '0.1'.
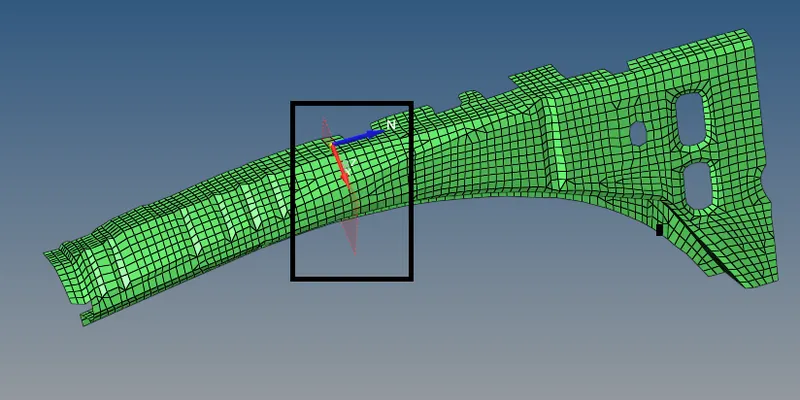
Fig: Shotgun Cross-Section
A-Pillar Cross-Section :
9. For Creating A-Pillar Cross Section, the same steps to be followed as per Shotgun Cross Section.
10. Go to Solver-->Right Click-->Create-->FRAME-->MOV option and Select Origin Node, Axis Node & Plane Node.
11. Go to Solver-->Right Click-->Create-->SECT-->SECT option and Select N1,N2,N3 nodes and in grshel_id select the Elements and set deltaT as '0.1'.
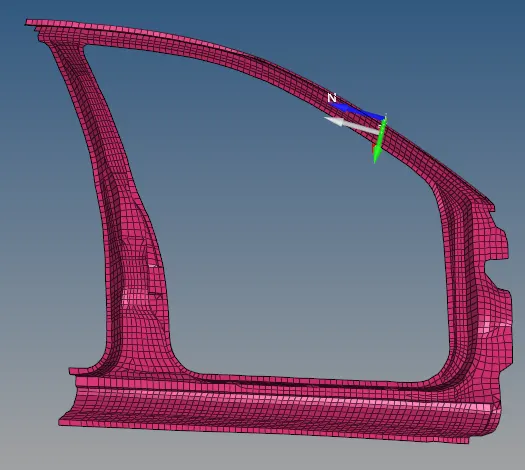
Fig: A Pillar Cross-Section
Accelerometer at base of B Pillar :
12. Creating Accelerometer at the base of B Pillar(on B Pillar Rocker) to receive an Acceleration Curve.
13. Go to Solver-->Right Click-->Create-->ACCEL option and Select the Node ID and Create.
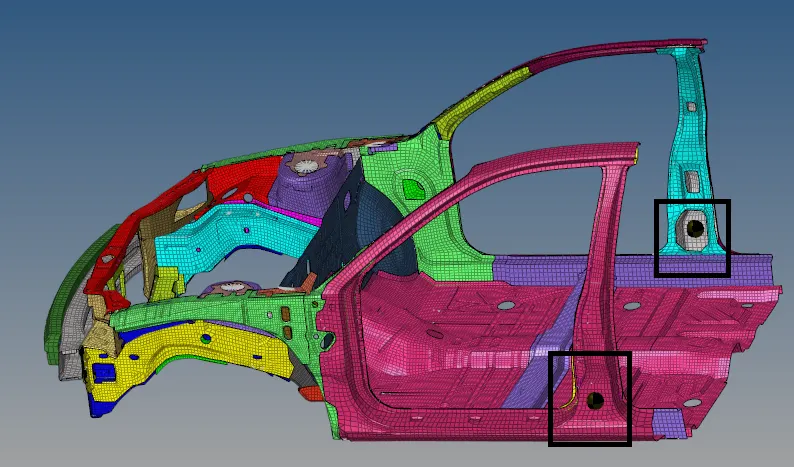
Fig: Accelerometer (at base of B Pillar)
Intrusions on the dash wall 66695,66244 :
14. Creating Intrusions on the dash wall 66695, 66244 Nodes.
15. Go to Solver-->TH-->Create-->NODE option and select the 66695,66244 nodes.
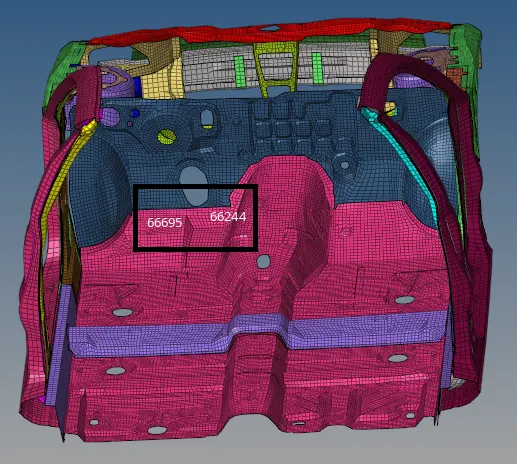
Fig: Intrusion on dash wall 66695, 66244
16. After Setting Output Requests, Go to Analysis-->Radioss option and Select the folder to save the input file and set options and Click Radioss to run the Simulation.
PLOT RESULTS :
Contour Plot :
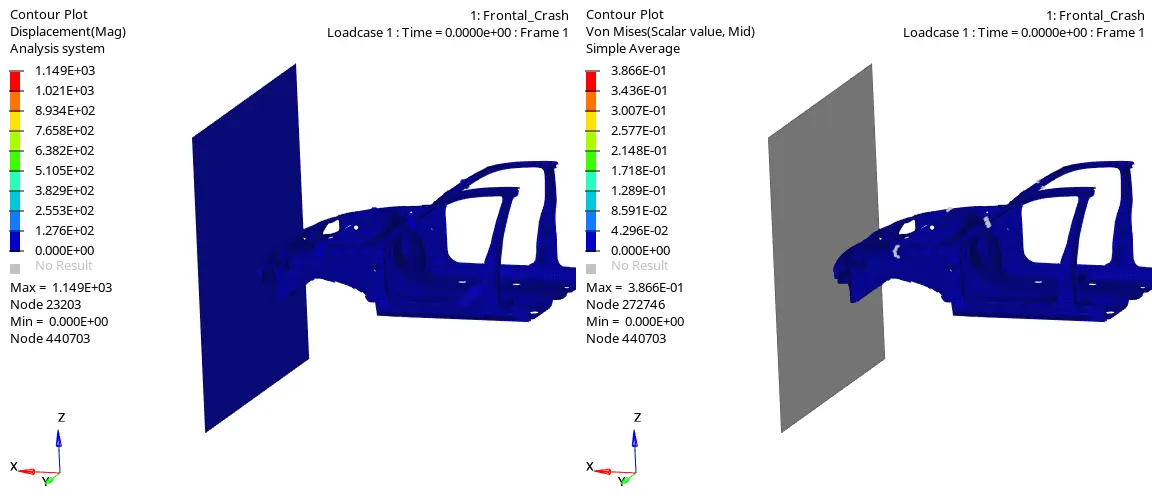
From the above contour plots observed that,
Car is crashed on to the Rigid Wall at the initial velocity of 15.64 mm/ms. With the help of Hypermesh(in Hyperwiew mode) Contour plots are displayed above. From the Contour plots, accurate results will be obtained.
- A Displacement plot shows the motion of an object in a direction perpendicular to its surface. From the Displacement, the plot observed that during Frontal Crash Deformation will occur, and Maximum Displacement is 1.149E+03.
- The von Mises stress is used to predict the yielding of materials under complex loading from the results of uniaxial tensile tests. The von Mises stress satisfies the property where two stress states with equal distortion energy have an equal von Mises stress. The Vonmises Stress plot shows that, While Deformation occurs, Stress will be created and Maximum stress is 3.866E-01`N/(mm)^2`.
Axial Force Plot :
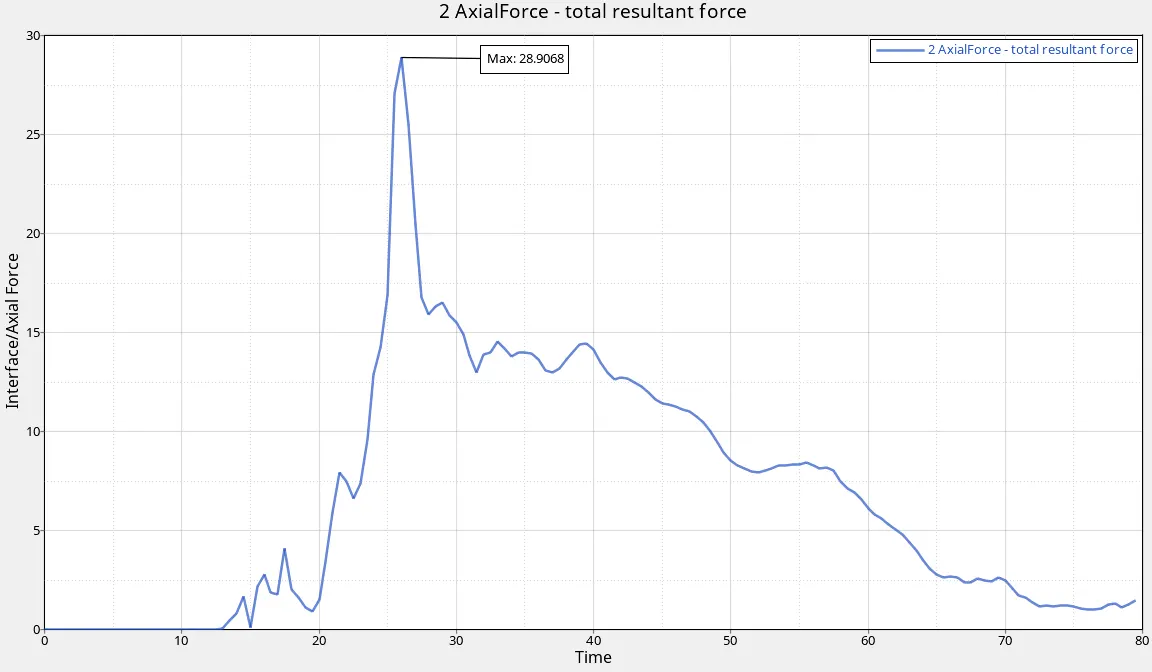
While the car is crashing on the rigid wall at the initial velocity of 15.64 mm/ms, the Bumper will receive more force and absorbs more energy during the Frontal Crash. After it transfers less force to the rail, shotgun, A-Pillar. Created a Type-7 Interface with recommended Parameters to receive axial force on the rails(Slave) from bumper(Master).
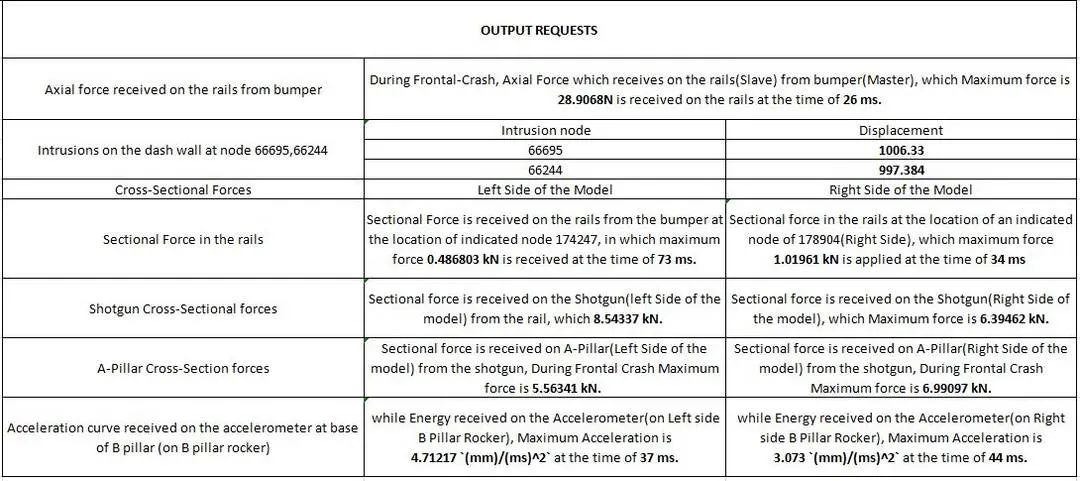
- During Frontal-Crash, Axial Force which receives on the rails(Slave) from bumper(Master), which Maximum force is 28.9068N is received on the rails at the time of 26 ms.
Sectional Force(174247Node) Plot :
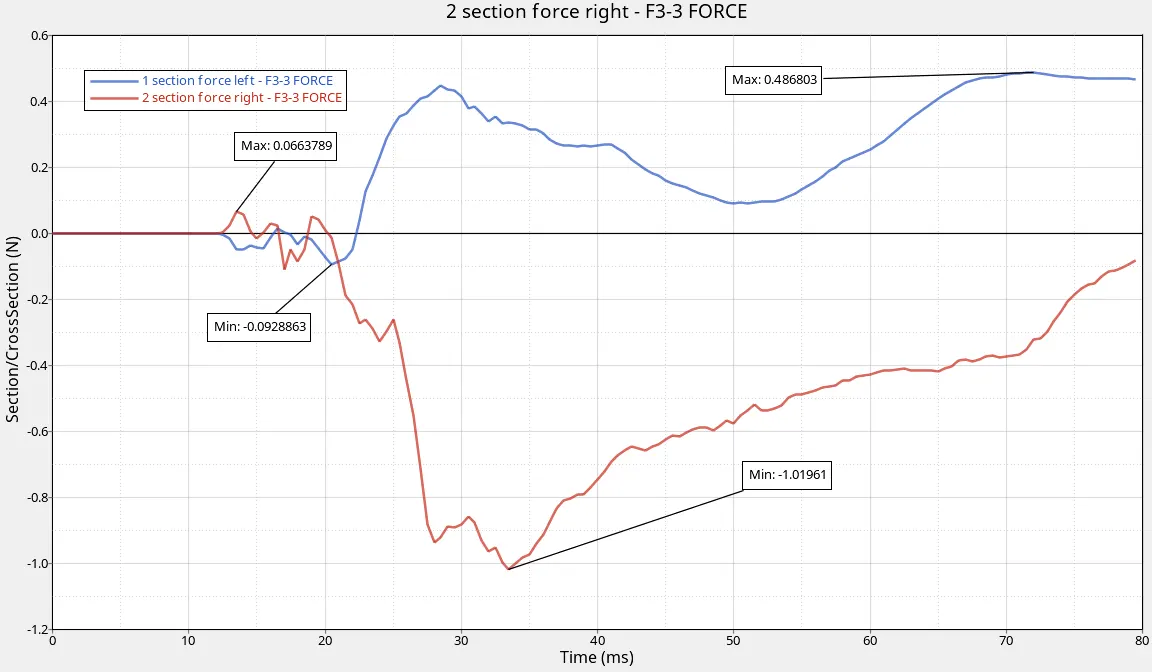
Cross-Section force is an internal force determined in the proper cross-section co-ordinate system. The cross-Section is created in the rails at the location of indicated node 174247 & 178904. During Frontal Crash
- Sectional Force is received on the rails from the bumper at the location of indicated node 174247, in which maximum force 0.486803 kN is received at the time of 73 ms.
- Sectional force in the rails at the location of an indicated node of 178904(Right Side), which maximum force 1.01961 kN is applied at the time of 34 ms during Frontal Crash. The frame is created on the Cross-Section, so it shows in a negative direction based on the proper cross-section local coordinate system.
Shotgun Cross-Section Force Plot :
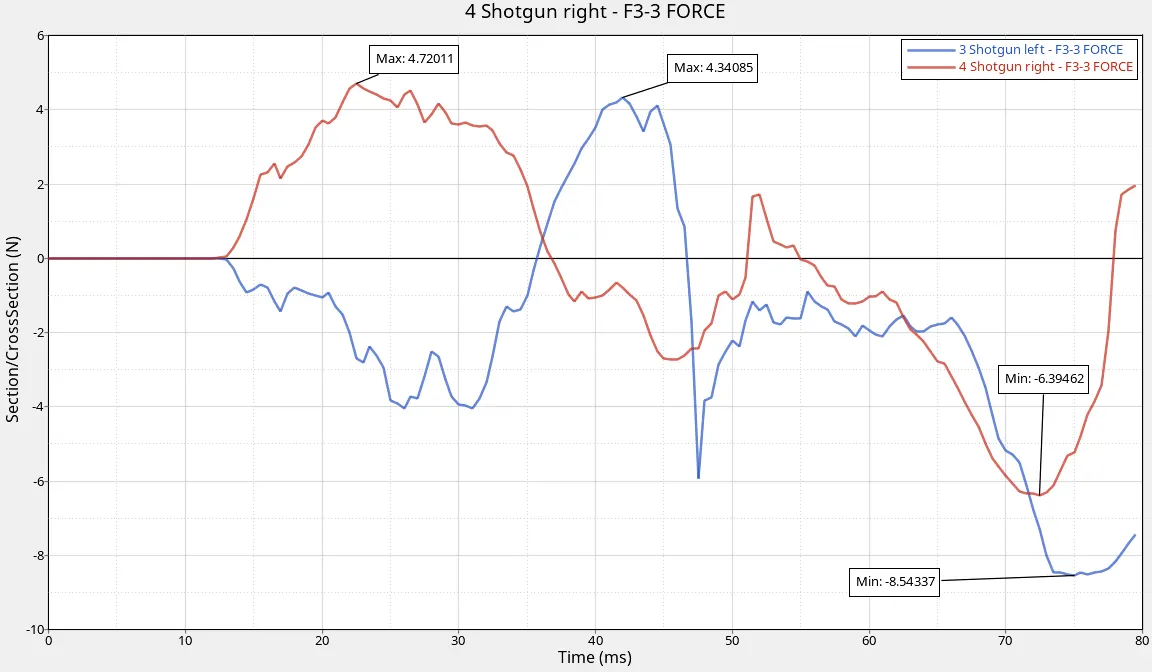
Cross Section is created on the Shotgun(on both Left Side & Right side of the model), During Frontal-Crash,
- Sectional force is received on the Shotgun(left Side of the model) from the rail, which Maximum force is 8.54337 kN. The frame is created on the Cross-Section, so it shows in a negative direction based on local coordinates.
- Sectional force is received on the Shotgun(Right Side of the model), which Maximum force is 6.39462 kN. The frame is created on the Cross-Section, so it shows in a negative direction based on the proper cross-section local coordinate system.
A-Pillar Cross-Section Plot :
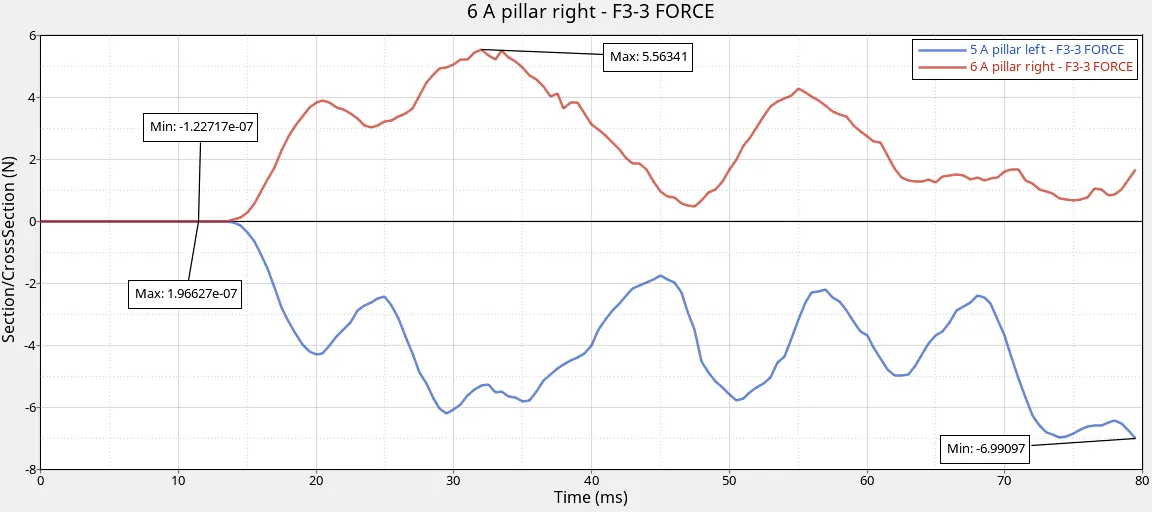
Cross Section is created on the A-Pillar(on both Left Side & Right side of the model), During Frontal-Crash,
- Sectional force is received on A-Pillar(Left Side of the model) from the shotgun, During Frontal Crash Maximum force is 5.56341 kN.
- Sectional force is received on A-Pillar(Right Side of the model) from the shotgun, During Frontal Crash Maximum force is 6.99097 kN. The frame is created on the Cross-Section, so it shows in a negative direction based on the proper cross-section local coordinate system.
Acceleration Curve Plot :
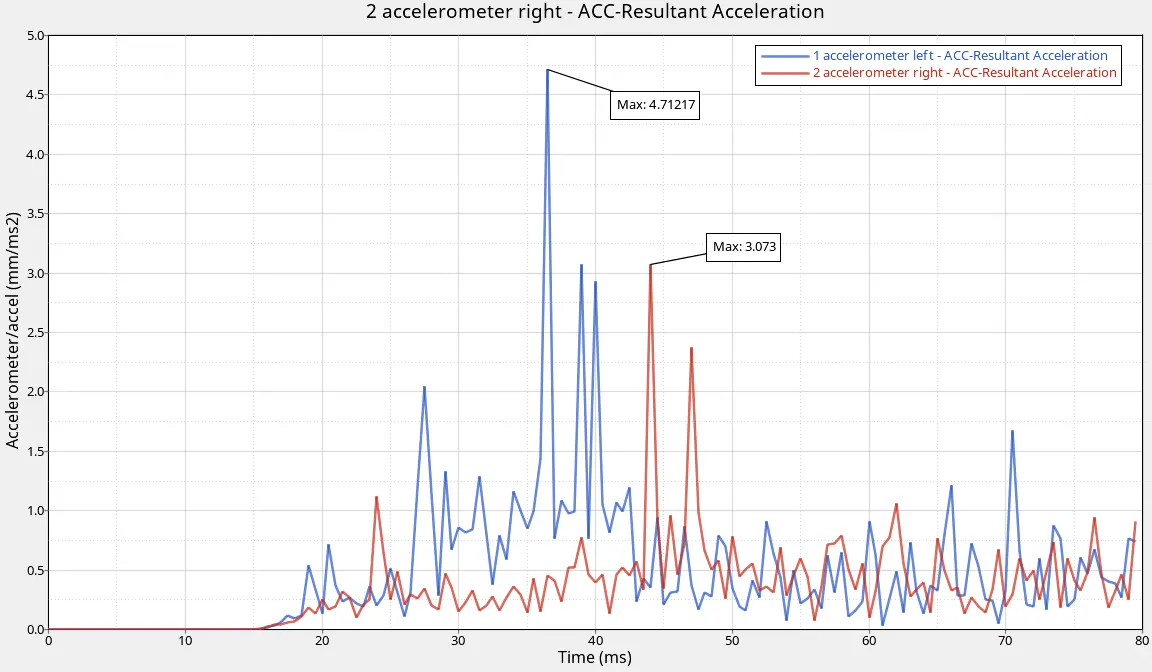
The area under the acceleration graph represents the change in velocity. In other words, the area under the graph for a certain time interval is equal to the change in velocity during that time interval. An accelerometer is created at the base of B Pillar(on both the Left side & Right side of B Pillar Rocker) to receive an Acceleration Curve. During Frontal Crash Initial Velocity is 15.64 mm/ms,
- while Energy received on the Accelerometer(on Left side B Pillar Rocker), Maximum Acceleration is 4.71217 `(mm)/(ms)^2` at the time of 37 ms.
- while Energy received on the Accelerometer(on Right side B Pillar Rocker), Maximum Acceleration is 3.073 `(mm)/(ms)^2` at the time of 44 ms.
Intrusion Plot :
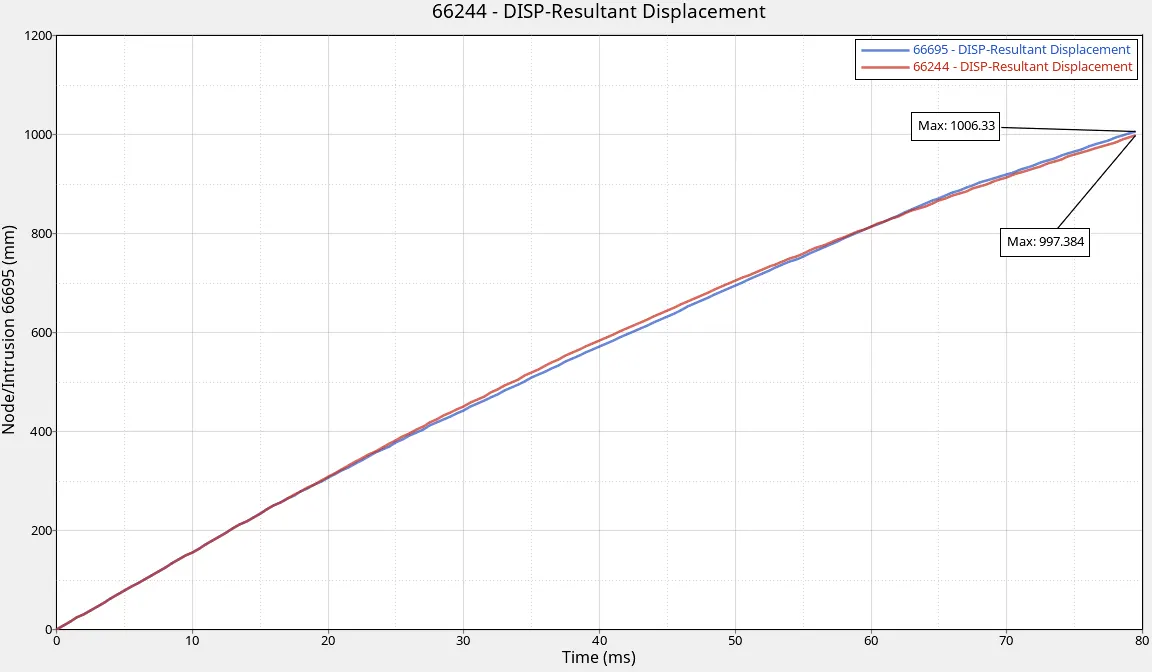
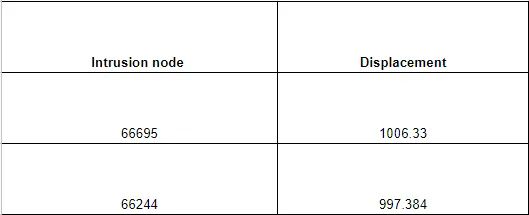
Two nodes of Intrusion were considered on the dash wall to find the displacement of two nodes from the analysis of the frontal crash, the simulation test configurations are evaluated based on the energy absorbed by the vehicle structure during the crash event. From the above Intrusion plot, we observed that the selected nodes are get displaced during the frontal crash and the displacement value is mentioned below.
Energy Plot :
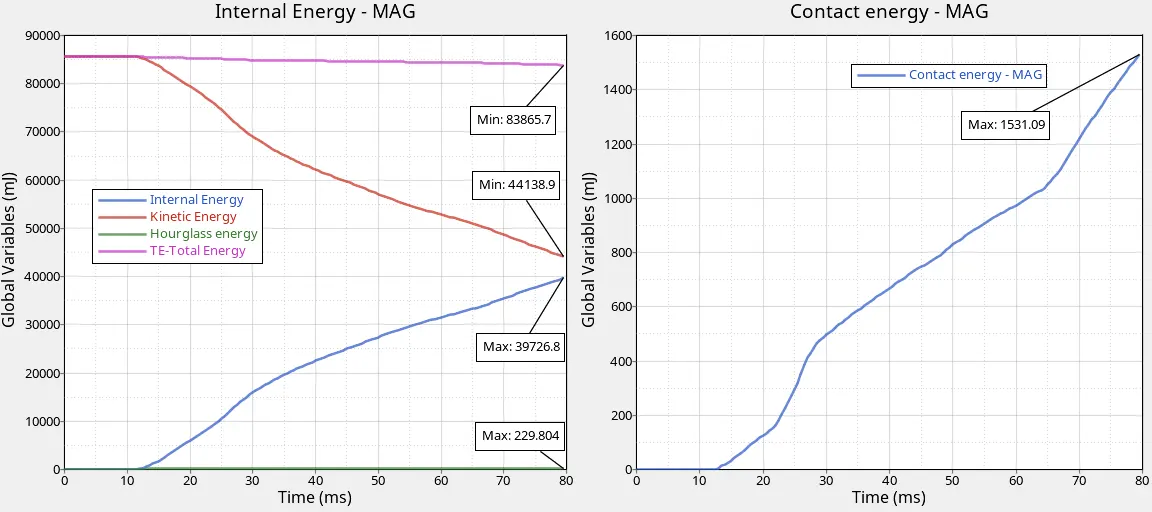
From the above Energy Plot we observed that,
- For the first 13 ms there is no crash between BIW Component and Rigid Wall, After 14 ms Frontal Crash starts and Internal Energy starts to gain the energy from the system due to changes in its internal state, and Maximum Internal Energy is 39726.8 mJ is generated.
- The Maximum Kinetic Energy of the system is at t=0ms(no deformation at the time), Kinetic Energy starts to lose the energy of the system at t=14ms, and at t=80ms Kinetic Energy is 44138.9 mJ.
- We Know that Total Energy remains constant(no loss or generation of energy), Kinetic Energy decreases while Internal Energy Increases. Due to the tiny mass added, less Hourglass Energy 229.804 is created. Hourglass Energy is negligibly small. So that Total Energy is 83865.7 mJ at t=80ms.
- Contact Energy is a Combination of Penetration and Contact Force (between Master & Slave Nodes). For the first 13 ms, there is no crash between BIW Component and Rigid Wall, After 14 ms Frontal Crash starts, and Contact Force is a force applied between Master & Slave nodes and energy required to resist the Penetration of Master & Slave Node So that Contact Energy is increased up to 1531.09 mJ.
ERROR Result :
1. After Running the Simulation, Open the Engine OUT File from the saved folder and Check the Energy Error & Mass Error.
2. Energy Error is -2.0%(better to have within -5%) and Mass Error is 0.001272%
CONCLUSION :
As per FMVSS No.208 requirement Occupant Crash Protection, vehicle crashworthiness is evaluated by conducting a frontal crash test into a rigid barrier at an impact speed up to 15.64 mm/ms (35 mph). Energy Error, Mass error, Total Simulation run time, Displacement, Vonmises stress, Energy Absorption, Cross-sectional forces, Axial force, Intrusions have been evaluated during crash simulations, and results were displayed.