RADIOSS Interfaces & Study of Effect of Notches
Objective:
To study the interfaces in RADIOSS and the effect of Notches in the crash applications.
Software used: Hypermesh with RADIOSS
Introduction:
Normally the explicit analysis method solves highly complex nonlinear problems and contact definition is an important part of many nonlinear problems. In order to get the best results and real behavior of any simulations, including contacts, accurate modeling of contact interfaces between bodies is a crucial part. In RADIOSS an interface is created by defining the master segment and slave set. The master segment can be parts, elements, contact surface, node sets, and similarly for the slave the selection can be parts and node sets. Once these master-slave sets are identified the algorithm will check these locations for potential penetration of a slave node through a master segment, and this check is done in every time step.
RADIOSS uses the penalty method for interfaces.
Penalty method:
The penalty method treats the behavior between slave nodes and master segments as springs that generate resistive forces as a function of penetration.
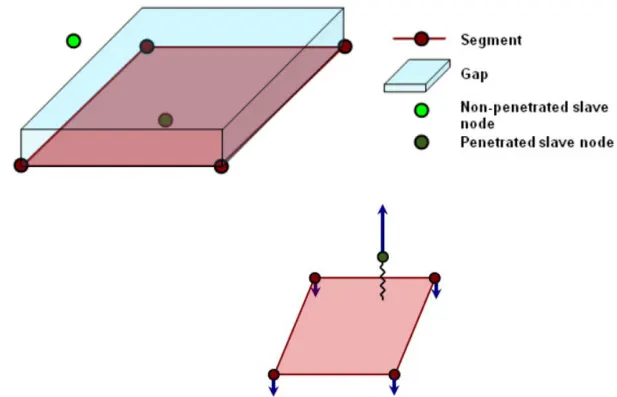
Spring elements are created between the slave node and its projection. The spring stiffness is automatically computed according to the material and property of both the master segment and slave node.
Variations Of Interfaces:
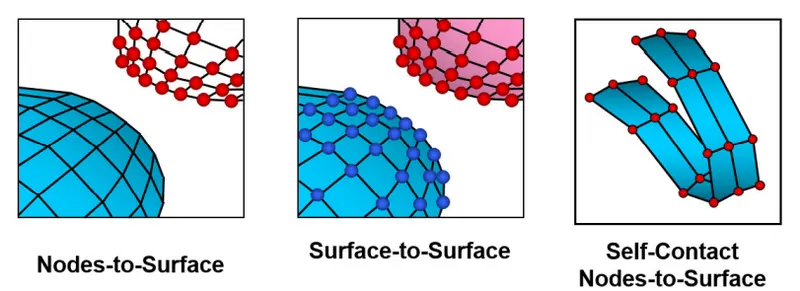
Based on the applications RADIOSS has a large number of interface types. Out of the many interface types, the most used ones for impact simulation are:
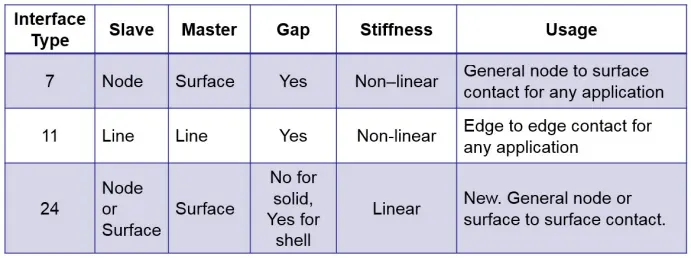
In this exercise, we are going to look at TYPE 7 and TYPE 11.
Simulation setup:
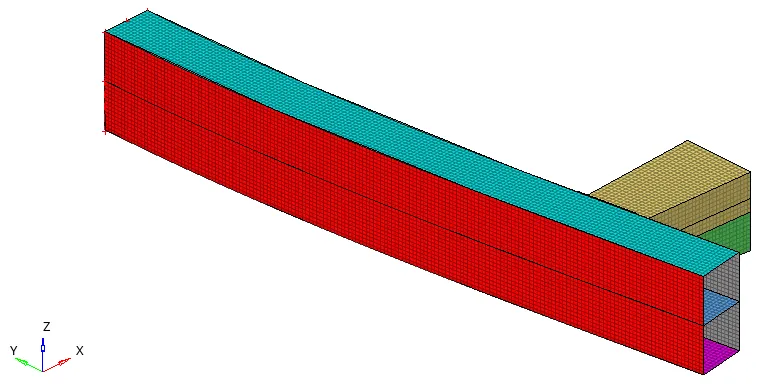
Here, we are considering a crash simulation setup for a crash tube comprising of four individual C-sections as shown below,
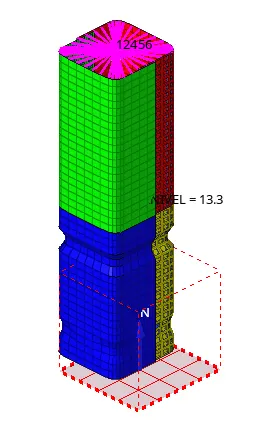
The crush tube is made to crash with the rigid wall with an initial velocity of 13.3mm/ms in negative z-direction. Recommended element properties are used for the element formulations, as follows, for faster simulation and good accuracy.
| Parameters | Comment |
|
Ishell =24 |
QEPH 4 nodes shells are best combination of cost and accuracy. |
|
Ismstr=2 |
Full geometric nonlinearities (default)with possible small strain formulation activation in RADIOSS Engine. |
|
Ish3n=2 |
Standard 3 noded shell (C0)with modification for large rotation(default) |
| N=5 | Number of integration points set to 5 for accuracy bending. |
|
Ithick=1 |
Thickness change is taken into account for accuracy. |
|
Iplas=1 |
Iterative plasticity for good accuracy. |
The image below shows the property card created based on recommended properties for explicit analysis.

Procedure:
Case 1:
The given model is run as it is without any changes.
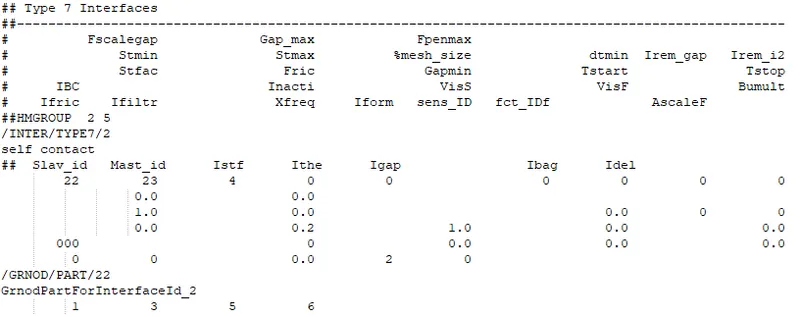
In the given model TYPE 2 interface is configured for the spot welds and TYPE 7 to model how parts interact when they come into contact with each other.
Interface type 7 is a general-purpose interface and can simulate all types of impact between a set of nodes and a master surface. Interface type 7 is
non-oriented, meaning, slave nodes can belong to the master surface. Therefore, this interface can simulate auto-impact, especially buckling during a high-speed crash. the main advantage of interface type 7 is that the stiffness is not constant and increases with the penetration preventing the node from going through the shell mid surface.
The interface parameters used for TYPE 7 is shown in the interface card image below,
Results:
- Energy error: -3.8%
- Mass error: 0
- Simulation time (CPU): 188 s
Both energy error and mass error are low and within safe limits. So, the simulation results are acceptable.
The animation below shows the crash simulation.
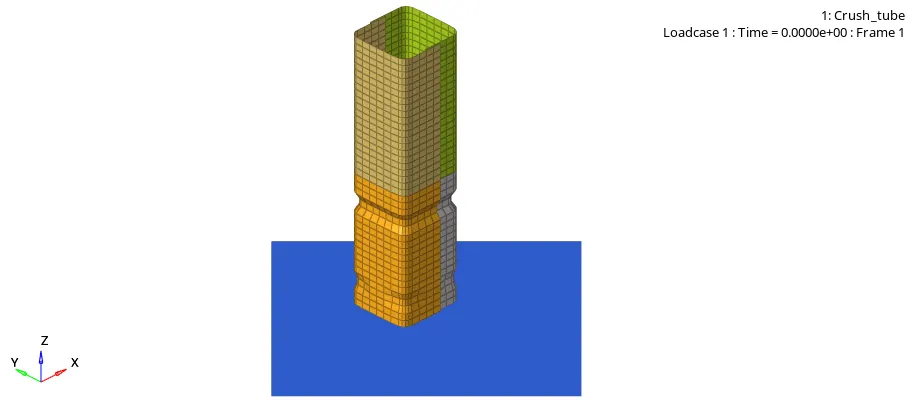
We can observe that the buckling initiated at the notch region. First, the bottom two C-sections with notches were completely crushed and then the upper C-sections started deforming. Also, in the bottom two C-sections, deformation first started at the region, where the notch is running across the perimeter.
The image below shows the RWALL forces,
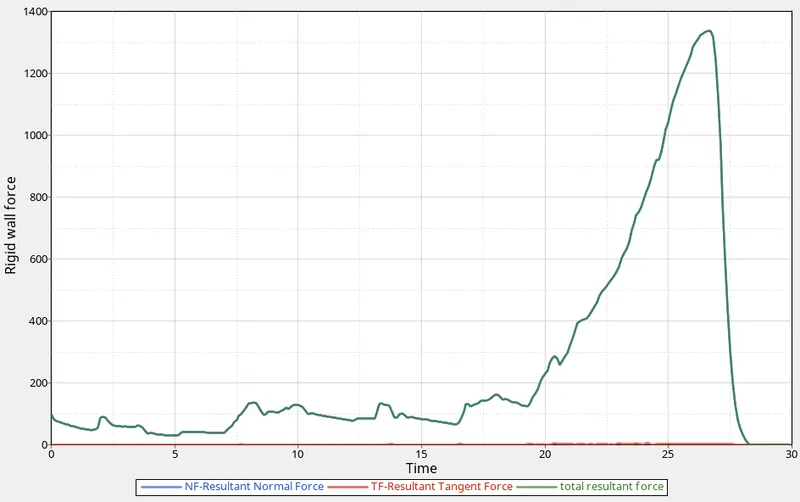
- From the above graph, we can observe that, @ 0ms, the crush tube crashed with the rigid wall and there was a sudden rise in normal force.
- Until about 20 ms, the normal force fluctuated but didn't change much, implying that the crush tube was absorbing most of the kinetic energy itself in deformation.
- After about 20 ms, the normal forces started rising, indicating that the crush tube was mostly deformed and not absorbing much energy.
- The normal force peaked at about 27 ms and then started declining to zero, indicating that the kinetic energy with the crush tube was almost diminished and the deformation completed.
- The tangent force was almost negligible during the simulation, indicating that there was almost no sliding between the rigid wall and crush tube.
The image below shows the energy plot for the simulation,
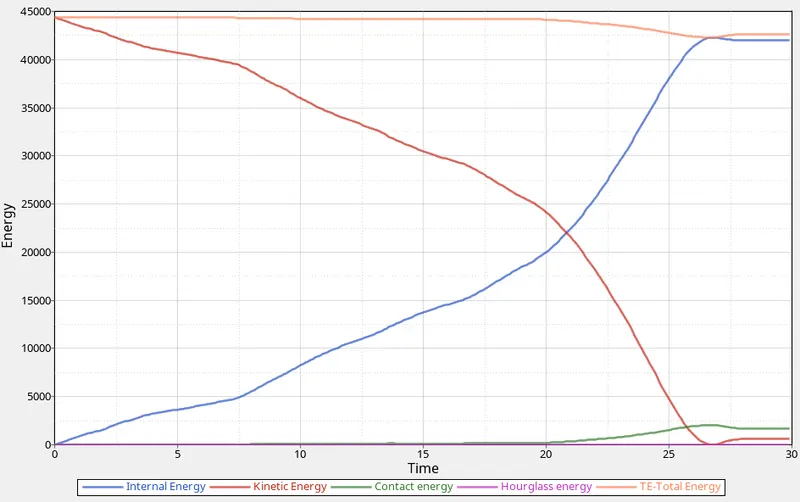
- Initially, for the crush tube, the internal energy was zero and kinetic energy was maximum.
- After the impact, the crush tube started deforming, therefore, the internal energy started to rise and kinetic energy started to decline.
- After about 20ms, the deformation rate was highest, as there is a sharper increase in the internal energy, which is also noticed in the RWALL forces plot above.
- At about 26.5ms, the kinetic energy was zero, and the internal energy was at its peak value but not equal to the initial maximum kinetic energy. The total energy also declined at becoming equal to the internal energy. This indicates that there was a loss of energy in friction, which can be seen as the contact energy started to rise.
- After 26.5ms, the internal energy became constant, implying the crush tube was completely deformed at 27ms. Also, there is a slight jump in kinetic energy and therefore the total energy, implying the crush tube rebounded with some kinetic energy at the end of the simulation.
Case 2:
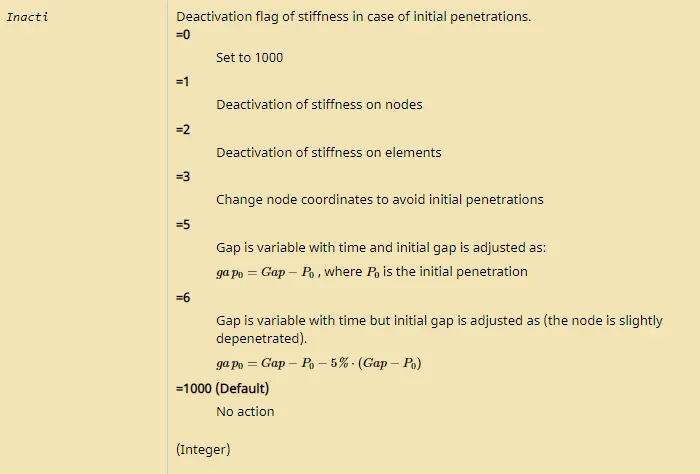
In the second case, the same previous model files from case 1 are used and the 'Inacti' parameter in the TYPE 7 interface is configured to 6.
The 'Inacti' parameter controls the action to take if initial penetrations exist in the model. The image below shows the different values for this parameter and their effect.
Results:
- Energy error: -3.8%
- Mass error: 0
- Simulation time (CPU): 172 s
Both energy error and mass error are low and within safe limits. So, the simulation results are acceptable.
The animation below shows the crash simulation.
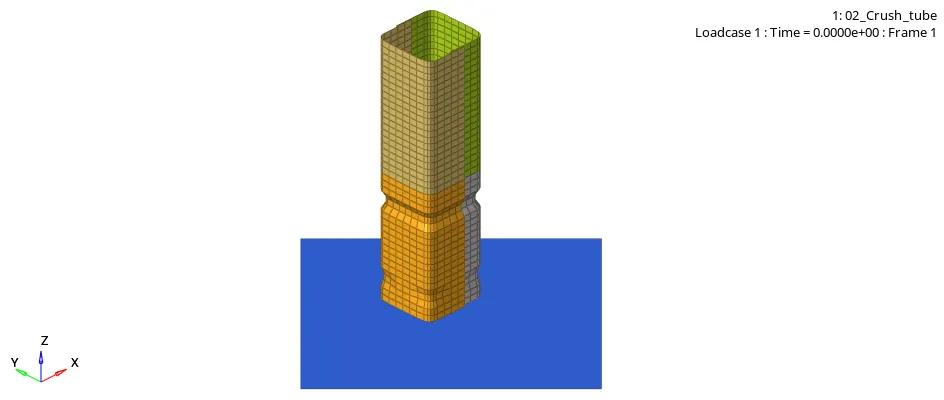
We can observe that the deformation behavior is the same as in case 1.
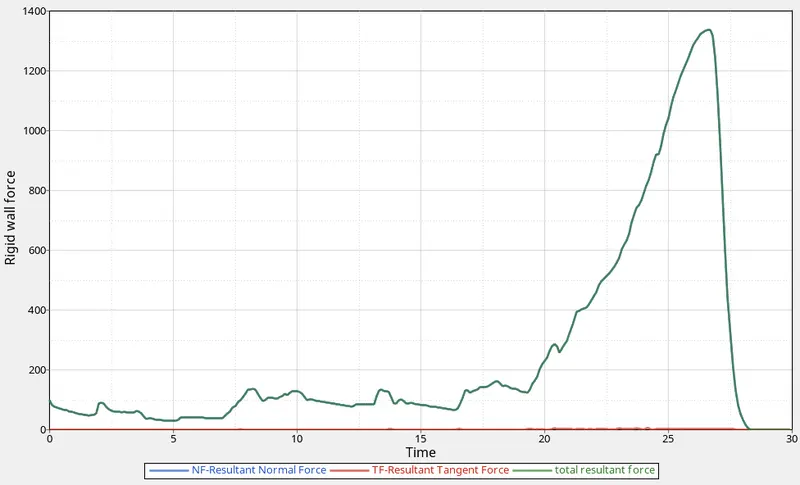
The image below shows the RWALL forces,
The image below shows the energy plot for the simulation,
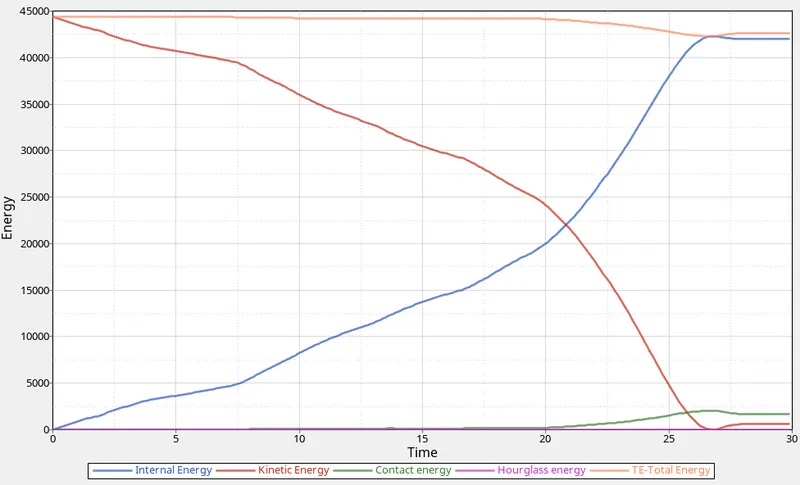
Rigid wall forces and energy plots are also the same as in case 1. Therefore, we can say that there was no initial penetration. If there had been any initial penetration, then the internal energy would have a non-zero value at the start of the simulation.
Case 3:
In the second case, the same previous model files from case 1 are used and the TYPE 11 interface is added. TYPE 11 interface is used to simulate the edge to edge contact.
There are situations where the Type 7 node to surface interface will not detect the contact due to edges crossing each other at angles.
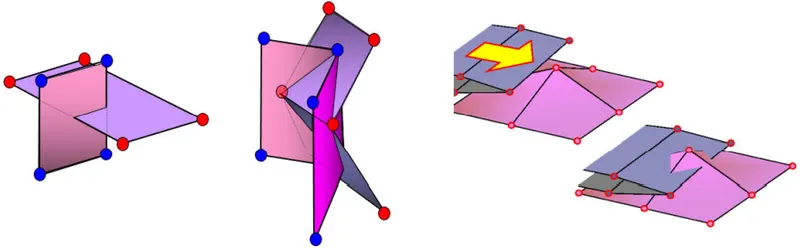
Therefore, in the case of edges crossing, the Type 11 interface is added to capture the physics correctly.
The 'Gapmin' value is kept lower in TYPE 11 parameters than in TYPE 7 so that TYPE 11 contact is not activated before TYPE 7. All other parameters for TYPE 11 are kept the same as in TYPE 7.
Results:
- Energy error: -3.8%
- Mass error: 0
- Simulation time (CPU): 195 s
Both energy error and mass error are low and within safe limits. So, the simulation results are acceptable.
The animation below shows the crash simulation.
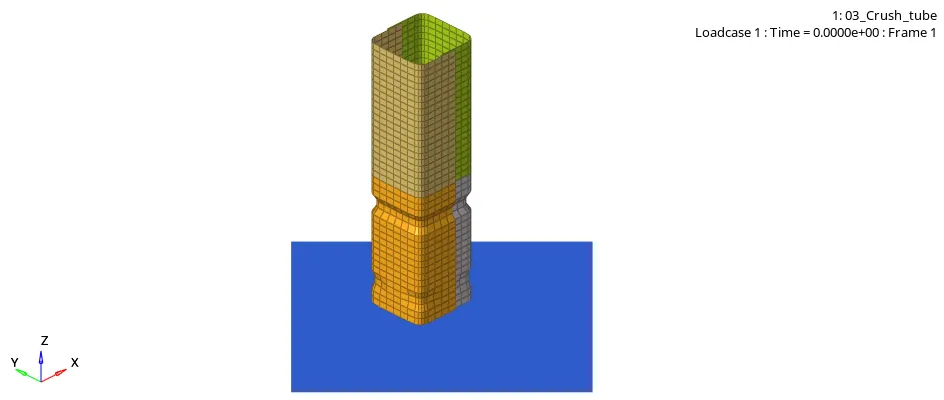
The image below shows the RWALL forces,
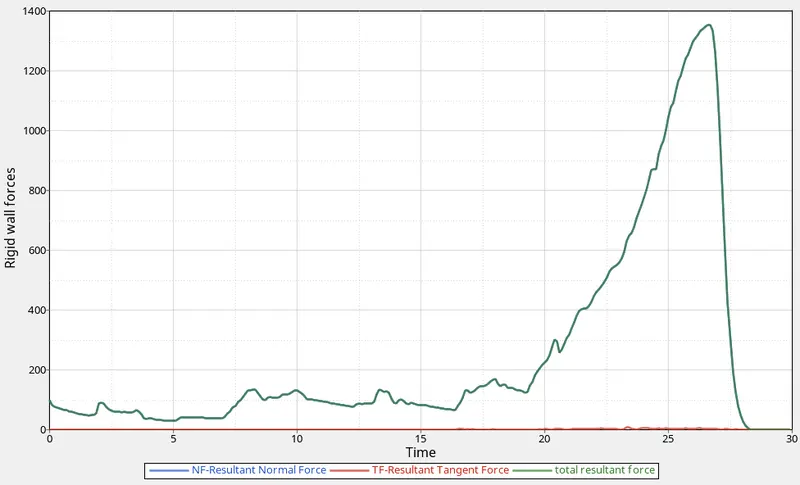
The image below shows the energy plot for the simulation,
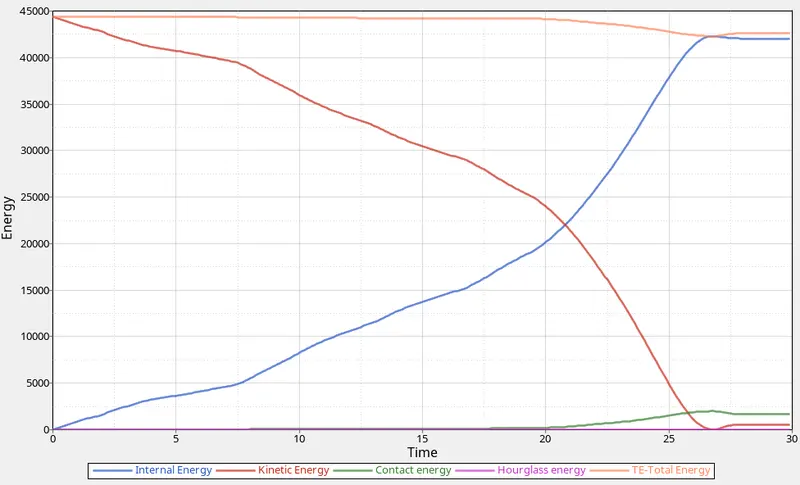
In this case, also, the deformation behavior is similar to what was observed in previous cases. Rigid wall forces and energy plots are also the same as in previous cases. Therefore, we can conclude that there was no edge to edge penetration in this model.
Note: In the next three cases we will compare the effect of notches.
Case 4:
In this case, all the notches are removed from the crush tube model. Except for this, the simulation setup is kept the same as in case 3.
To remove the notches, Geom>node edit>align tool is used. The new model without notches is shown in the image below,
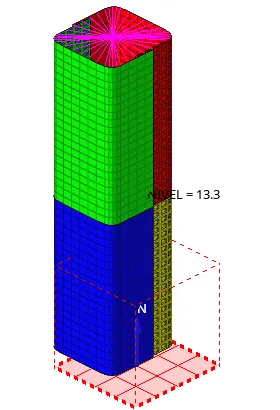
Results:
- Energy error: -2.4%
- Mass error: 0
- Simulation time (CPU): 195 s
Both energy error and mass error are low and within safe limits. So, the simulation results are acceptable.
The animation below shows the crash simulation.
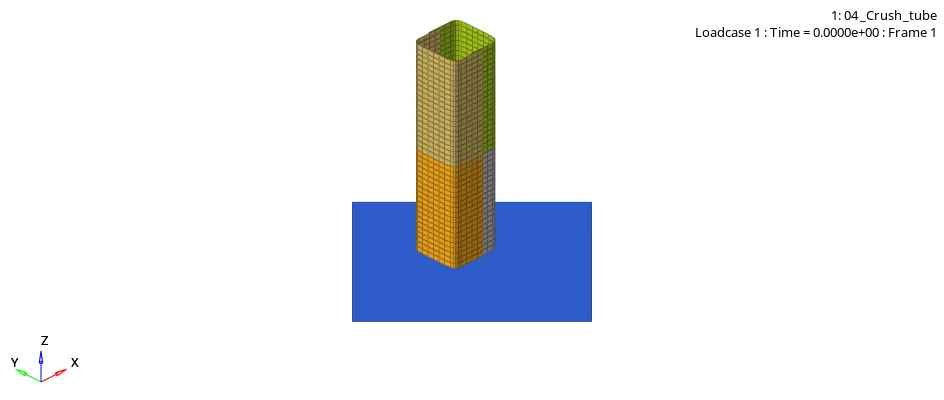
We can observe that the deformation is happening layer by layer in a sequential pattern, i.e., it starts from the bottom end (the end which is striking the rigid wall) and then moves up to the top end layer by layer.
The image below shows the RWALL forces,
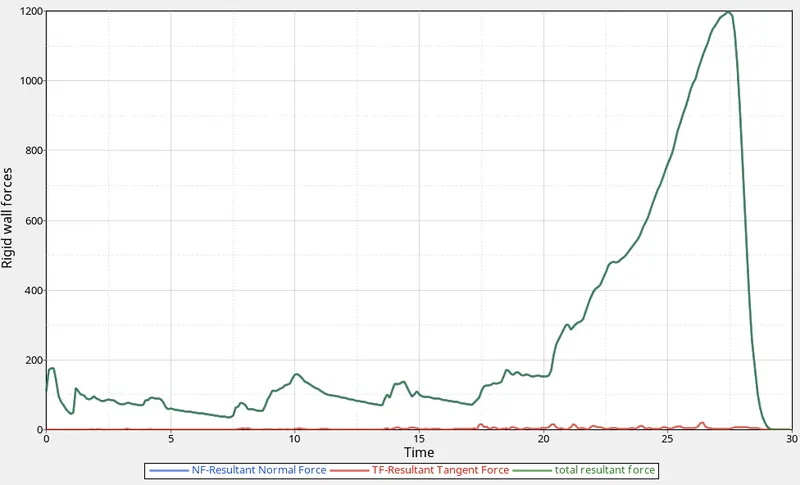
- From the above graph, we can observe that, @ 0ms, the crush tube crashed with the rigid wall and there was a sudden rise in normal force.
- Until about 20 ms, the normal force fluctuated but didn't change much, implying that the crush tube was absorbing most of the kinetic energy itself in deformation.
- After about 20 ms, the normal forces started rising, indicating that the crush tube was mostly deformed and not absorbing much energy.
- The normal force peaked at about 27 ms and then started declining to zero, indicating that the kinetic energy with the crush tube was almost diminished and the deformation completed.
- The peak normal force, in this case, is about 1200 N.
- The tangent force was almost negligible during the simulation, indicating that there was almost no sliding between the rigid wall and crush tube.
The image below shows the energy plot for the simulation,
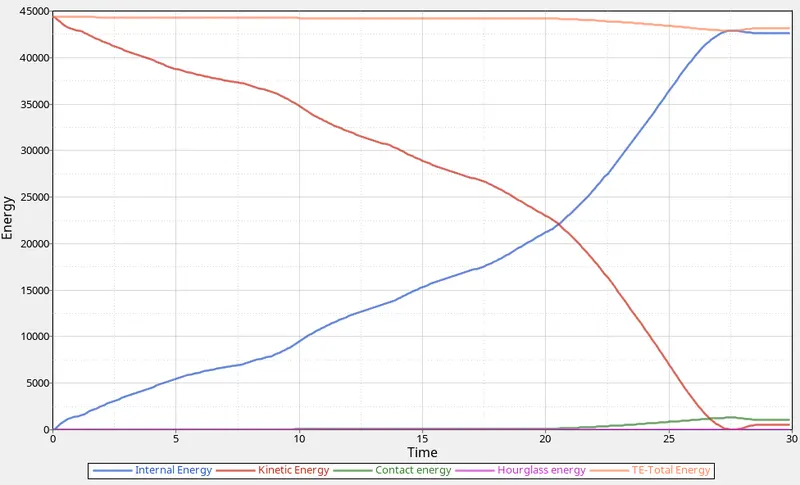
- Initially, for the crush tube, the internal energy was zero and kinetic energy was maximum.
- After the impact, the crush tube started deforming, therefore, the internal energy started to rise and kinetic energy started to decline.
- After about 20ms, the deformation rate was highest, as there is a sharper increase in the internal energy, which is also noticed in the RWALL forces plot above.
- At about 27.5ms, the kinetic energy was zero, and the internal energy was at its peak value but not equal to the initial maximum kinetic energy. The total energy also declined after 20ms becoming equal to the internal energy @27.5ms. This indicates that there was a loss of energy in friction, which can be seen as the contact energy started to rise in this time period.
- After 27ms, the internal energy became constant, implying the crush tube was completely deformed at 27ms. Also, there is a slight jump in kinetic energy and therefore the total energy, implying the crush tube rebounded with some kinetic energy at the end of the simulation.
The image below shows the internal energy plot for the four individual C-section components,
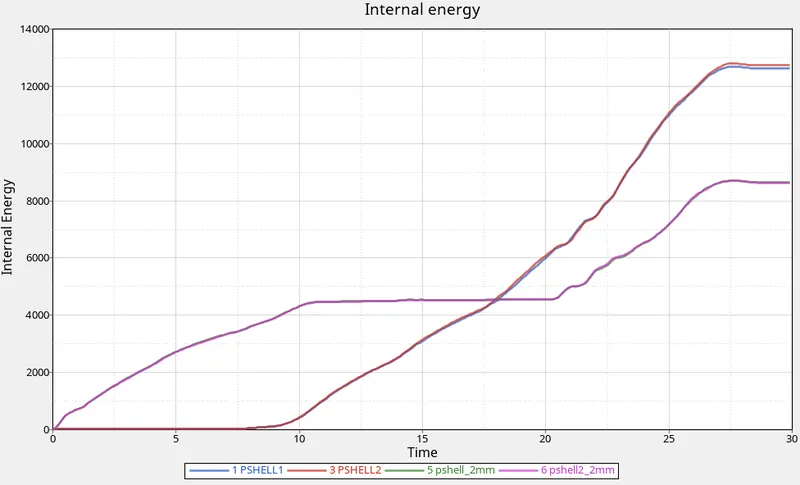
- At the start of the impact, only the lower two C-sections (pshell_2mm and pshell_2mm) started to deform. And the upper two C-sections started to deform only after about 10ms, when the lower C-sections were already deformed.
- Between 10ms and 20ms, there is no change in internal energy of lower C-sections but the upper C-sections' internal energy is still rising. This means that the upper two components were deforming during this time period but not the lower ones. This is in line with what we observed through the animation of simulation.
- After 20ms, all the four components continued to deform, as the crush tube still had high kinetic energy.
- At about 27.5ms, the internal energy for all four components became constant. Therefore, there was no further deformation.
- Peak internal energy for lower sections: 8683 J
- Peak internal energy for upper sections: 12679 J
Case 5:
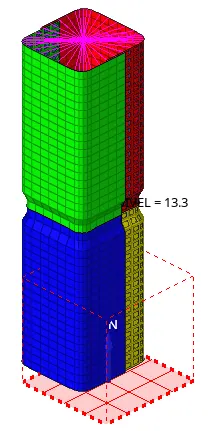
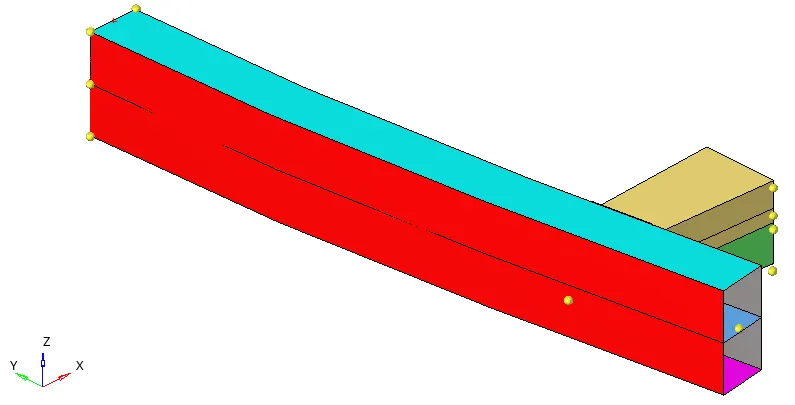
In this case, a notch is added in the middle of the crush tube. Except for this, the simulation setup is kept the same as in case 4.
To add the notch, Tool>translate tool is used. The new model with a notch in the middle running across the perimeter is shown in the image below,
Results:
- Energy error: -3.1%
- Mass error: 0
- Simulation time (CPU): 253 s
Both energy error and mass error are low and within safe limits. So, the simulation results are acceptable.
The animation below shows the crash simulation.
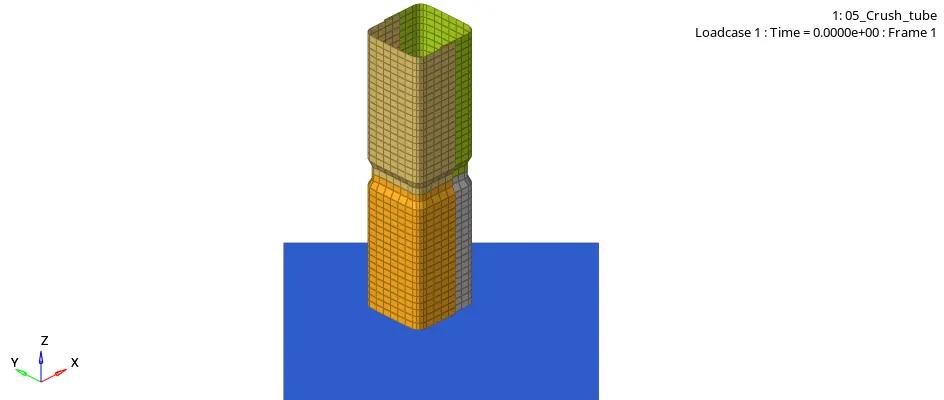
We can observe that the deformation first started just below the notch. Then, deformation in the lower two sections progressed from both ends. Once, the lower sections were deformed, the upper sections started to deform in the same way as in the previous case. Finally, both lower and upper sections were completely crushed at the end of the simulation.
The image below shows the RWALL forces,
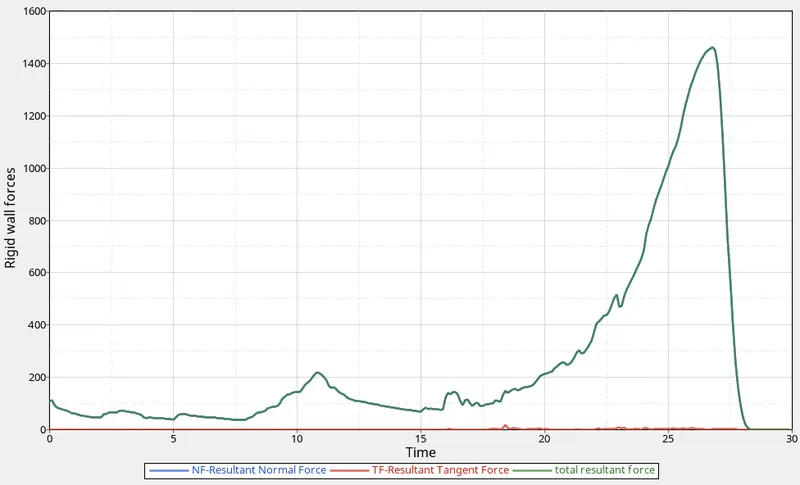
- From the above graph, we can observe that, @ 0ms, the crush tube crashed with the rigid wall and there was a sudden rise in normal force.
- Until about 18ms, the normal force fluctuated but didn't change much, implying that the crush tube was absorbing most of the kinetic energy itself in deformation.
- After about 18ms, the normal forces started rising, indicating that the crush tube was mostly deformed and not absorbing much energy.
- The normal force peaked at about 26.5 ms and then started declining to zero, indicating that the kinetic energy with the crush tube was almost diminished and the deformation completed.
- The peak normal force, in this case, is about 1467 N, which is greater than in the previous case, most probably attributed to more surface area in contact with the rigid wall.
- The tangent force was almost negligible during the simulation, indicating that there was almost no sliding between the rigid wall and crush tube.
The image below shows the energy plot for the simulation,
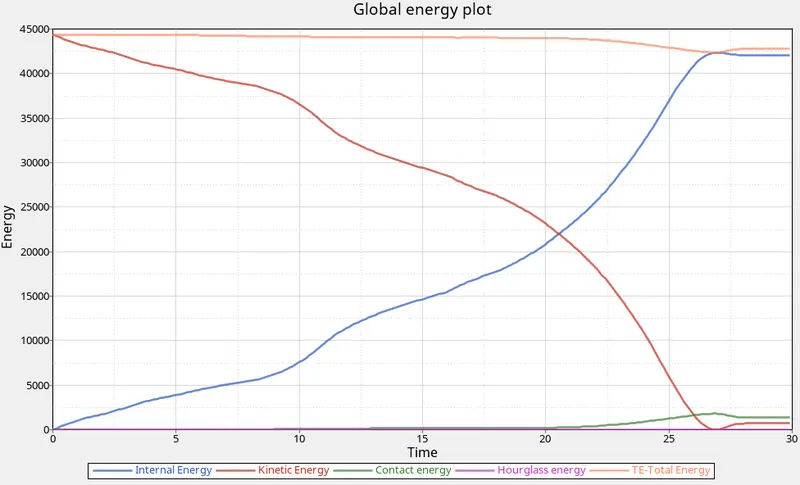
- Initially, for the crush tube, the internal energy was zero and kinetic energy was maximum.
- After the impact, the crush tube started deforming, therefore, the internal energy started to rise and kinetic energy started to decline.
- After about 20ms, the deformation rate was highest, as there is a sharper increase in the internal energy, which is also noticed in the RWALL forces plot above.
- At about 27ms, the kinetic energy was zero, and the internal energy was at its peak value but not equal to the initial maximum kinetic energy. The total energy also declined after 20ms becoming equal to the internal energy @27ms. This indicates that there was a loss of energy in friction, which can be seen as the contact energy started to rise in this time period.
- After 27ms, the internal energy became constant, implying the crush tube was completely deformed at 27ms. Also, there is a slight jump in kinetic energy and therefore the total energy, implying the crush tube rebounded with some kinetic energy at the end of the simulation.
The image below shows the internal energy plot for the four individual C-section components,
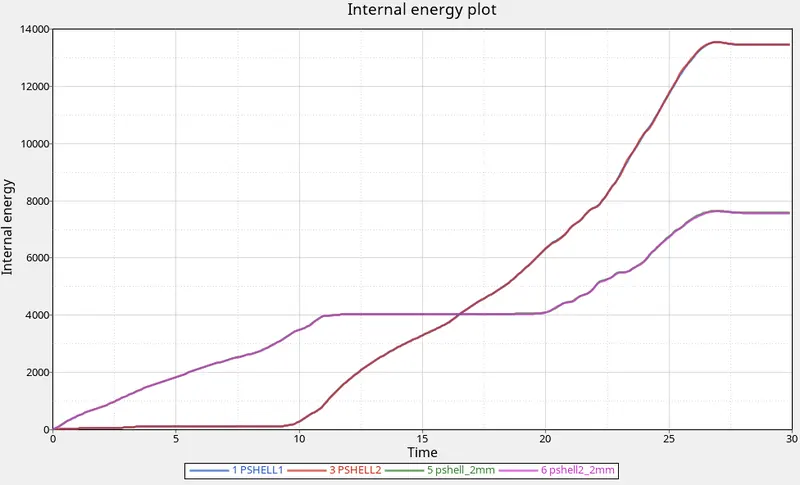
- The overall energy pattern is the same as in the previous case.
- But the internal energy for the lower section, in this case, is lower than that in the previous case. On the other hand, internal energy for the upper sections is higher in this case than in the previous case.
- Peak internal energy for lower sections: 7639 J
- Peak internal energy for upper sections: 13535 J
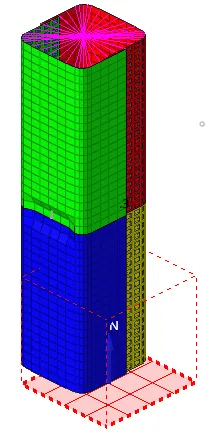
Case 6:
In this case, a notch is added only on the opposite two faces. Except for this, the simulation setup is kept the same as in case 4.
To add the notch, Tool>translate tool is used. The new model with the notch is shown in the image below,
Results:
- Energy error: -2.8%
- Mass error: 0
- Simulation time (CPU): 279 s
Both energy error and mass error are low and within safe limits. So, the simulation results are acceptable.
The animation below shows the crash simulation,
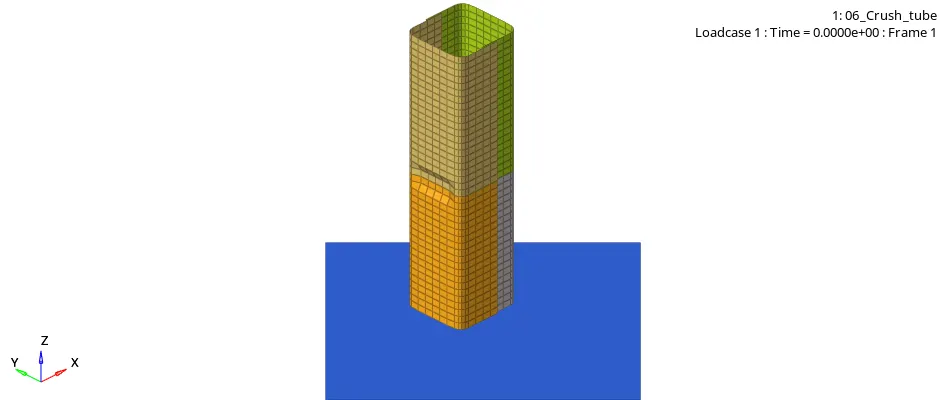
We can observe that the deformation first started just below the notch. Then, deformation in the lower two sections progressed from both ends. Once, the lower sections were deformed, the upper sections started to deform in the same way as in the previous case. Finally, both lower and upper sections were completely crushed at the end of the simulation.
The image below shows the RWALL forces,
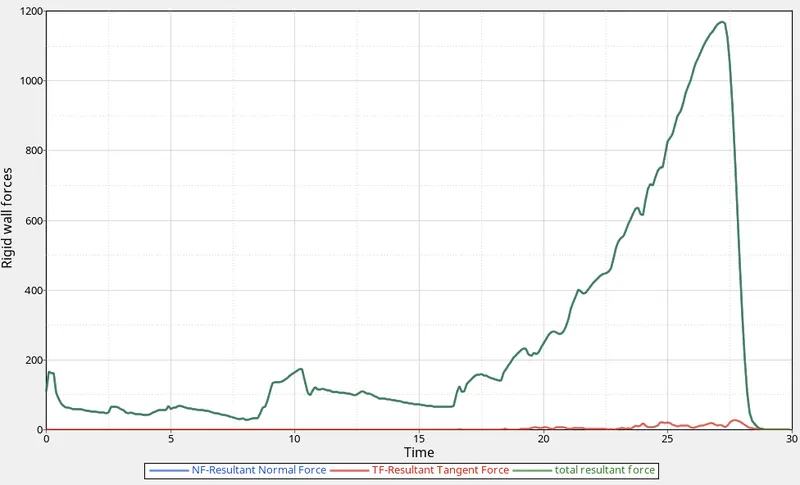
- From the above graph, we can observe that, @ 0ms, the crush tube crashed with the rigid wall and there was a sudden rise in normal force.
- Until about 16ms, the normal force fluctuated but didn't change much, implying that the crush tube was absorbing most of the kinetic energy itself in deformation.
- After about 16ms, the normal forces started rising, indicating that the crush tube was mostly deformed and not absorbing much energy.
- The normal force peaked at about 27ms and then started declining to zero, indicating that the kinetic energy with the crush tube was almost diminished and the deformation completed.
- The peak normal force, in this case, is about 1170 N, which is the lowest among the three cases.
- The tangent force was almost negligible during the simulation, indicating that there was almost no sliding between the rigid wall and crush tube.
The image below shows the energy plot for the simulation,
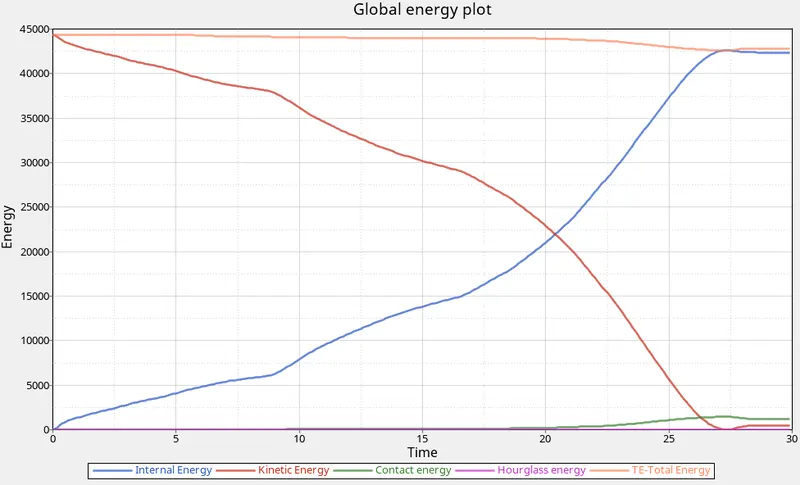
- Initially, for the crush tube, the internal energy was zero and kinetic energy was maximum.
- After the impact, the crush tube started deforming, therefore, the internal energy started to rise and kinetic energy started to decline.
- After about 20ms, the deformation rate was highest, as there is a sharper increase in the internal energy, which is also noticed in the RWALL forces plot above.
- At about 27.3ms, the kinetic energy was zero, and the internal energy was at its peak value but not equal to the initial maximum kinetic energy. The total energy also declined after 20ms becoming equal to the internal energy @27.3ms. This indicates that there was a loss of energy in friction, which can be seen as the contact energy started to rise in this time period.
- After 27.3ms, the internal energy became constant, implying the crush tube was completely deformed at 27.3ms. Also, there is a slight jump in kinetic energy and therefore the total energy, implying the crush tube rebounded with some kinetic energy at the end of the simulation.
The image below shows the internal energy plot for the four individual C-section components,
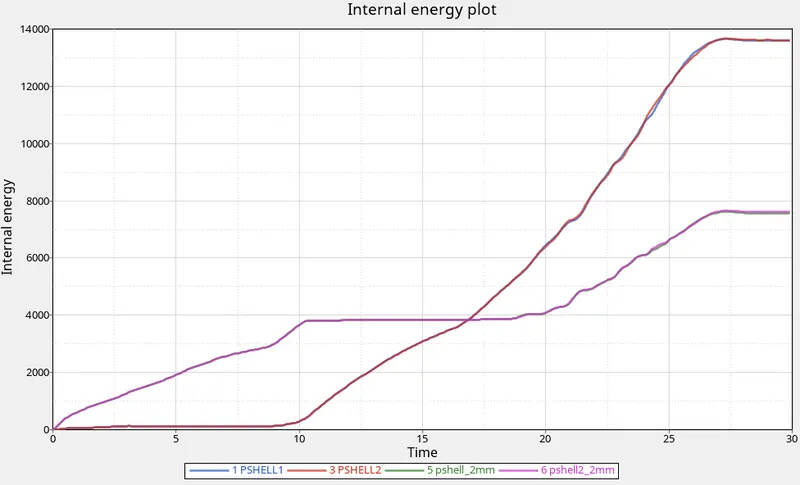
- The overall energy pattern is very similar to that of case 5.
- Peak internal energy for lower sections: 7657 J
- Peak internal energy for upper sections: 13622 J
Observation: How does the notch affect the results?
It is observed that the presence of notch speeds up the deformation, initiating it in the notch region first. The reason for this is that the presence of a notch creates stress concentration in that region. This type of notches are called triggers and are used in the structural components to initiate and control the deformation behavior.
Part 2:
The second task in this exercise is to mesh the given bumper model. The given bumper model is shown in the image below,
First, geometry cleanup is performed for the bumper model. And then, the mesh is generated with an average element size of 6mm. The meshed model is shown in the image below,