Assignment 5-RADIOSS Interfaces & Study of Effect of Notches Challenge
OBJECTIVES
1. To mesh the given bumper assembly with a mesh size of 6mm
2. To carry out simulations on the given crush tube model, so as to compare results as per the following requirements for each case:
- Run the crash tube model as it is.
- Change the Inacti=6 and run.
- Create the type 11 contact and run.
- Remove both notches and remove boundary condition on rigid body node then run.
- Create a new notch in the middle, select the whole section and run.
- Create a new notch with nodes only from opposing 2 faces and run.
THEORY
Interfaces (or) contact modeling:
The interfaces are defined as a model of how the parts interact when they come into contact with each other. While discussing the interfaces, there are four types of interfaces widely used. They are:
- Interface penalty method
- Type 7, Variable stiffness, Node to surface contact
- Type 11, Variable stiffness, edge to edge contact
- Type 24, Linear stiffness, node to surface & surface to surface contact
Another type is Type 19, which is the combination of both type 7 & type 11.
Penalty method:
This method treats the behavior between the slave nodes & master segments(surfaces) as springs that generate the resistive forces as a function of penetration, as shown below figure.
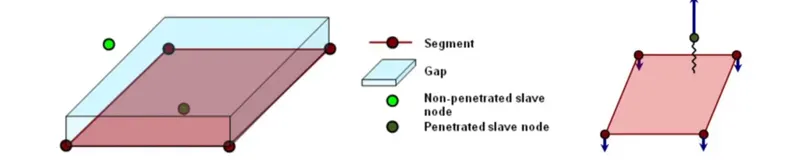
Time step is inversely proportional to the stiffness.
There are two types of time steps. They are:
- Nodal time step
- Kinematic time step
But the simulation is governed by the "Kinematic time step".
Type 7:
- This contact is used for node to surface contact.
- It can simulate all types of impact between a set of nodes and a master surface.
- It is non-oriented & slave nodes can belong to the master surface. Hence, the auto-impact is possible(can also be a self contact).
- In this method, the penalty method with variable stiffness can also be used.
- Resistive forces are applied to keep the slave nodes out of the contact gap.
- Stiffness is non-linear.
- Contact gap can be constant or variable.
Contact gap: It's a gap between the slave nodes & master segment, which indicates when a slave enters into that gap, which makes the resistive force come in to picture.
The resistive force vs penetration curve which is non-linear for the type 7 contact appears as shown in the below figure.
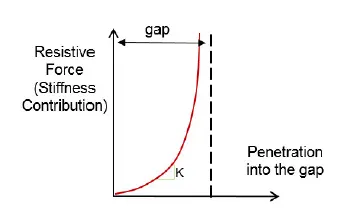
To have stability, maintain the penetration lower level, which makes the stiffness less.
Important parameters in Type 7:
There are 7 parameters, which are important to be assigned at the time of creating the type 7 contact. They are:
Igap: Which determines the size of the gap is calculated.
Gapmin: To indicate the minimum gap for the activation of the interface.
Inacti: Action to take if initial penetration exists.
Istf: Affects how the stiffness of the stiffness is calculated.
Iform: To indicate the formulation of friction.
Stmin: To indicate, how much minimum stiffness to be used in the interface
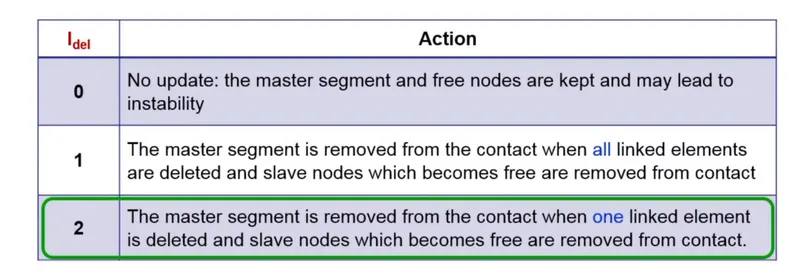
Idel: To indicate, what to do with the slave nodes & master segments if elements failed/deleted that they are attached to.
Igap:
|
Igap |
Gap type |
Description |
|
0 |
Constant gap |
The gap is defined by the Gapmin & is constant for all the contact. (Default) |
|
1 |
Variable gap |
The gap varies according to the characteristics of the impacted master surface & impacting slave node. |
|
3 |
Variable gap |
The variable gap with gap scale factor & mesh-size correction. |
It depends on the Gapmin value (Recommended value for Gapmin is 0.5 mm).
Recommended value: 2 (or) 3
Reason: Majorly, used is 3. Because gap scale factor & mesh size correction is taken into account. Because of adding gap scale factor, it puts a scale factor to the founded gap. In so many cases, there will be so many components with each other(i.e., By default the components will rest on each other). And if we don't want any reaction force to activate there. The Fscale gsp is going to relax the interface contacts by a bit. Which allows the slave node to reach up to the gap of 0.8. Which reduces some calculations for the solver.
Mesh-size correction: If the mesh size is big, then the nodes will be far away from each other. It is very likely, instead of nodes coming in to contact with the master segment, the edge of the slave node or element comes in to contact with the master. Because the contact is not well defined. If the mise size correction factor can be overcome.
Limitation of Type 7: It will consider only the nodes as the slave nodes.
Inacti:
Before discussing Inacti, the initial penetration should be understood.
Initial penetration: Some nodes even pass behind or past the master segment or element as shown in the below figure, which causes locking in simulations, leading to computational failure.
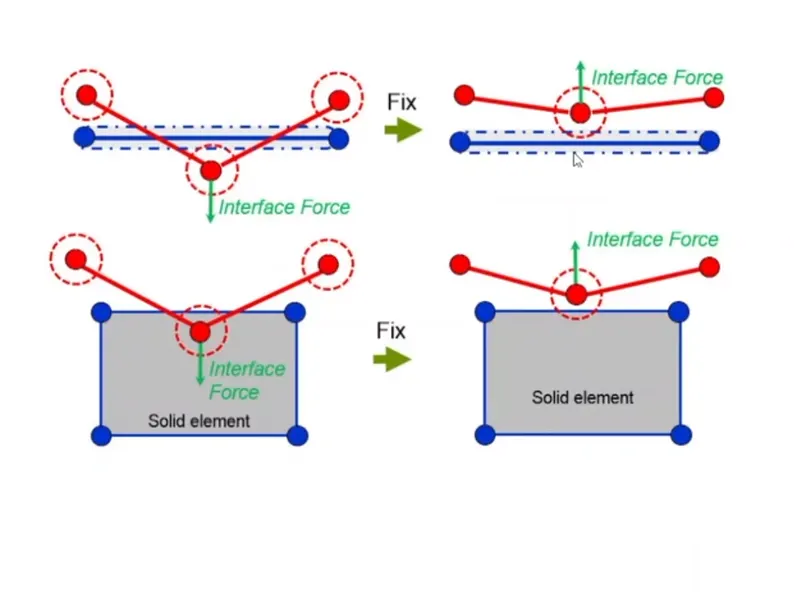
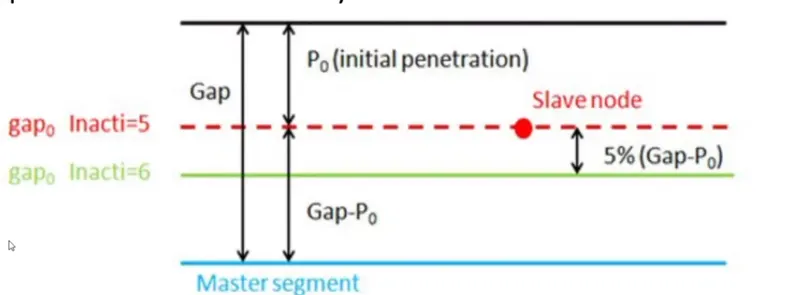
This can be overcome by using a fixed algorithm. After using it would be like, which puts a load on simulation, which leads to the pushing force going on this node, which results in the energy error in the simulation. There are so many values, and the recommended is 6, as shown in the below figure.
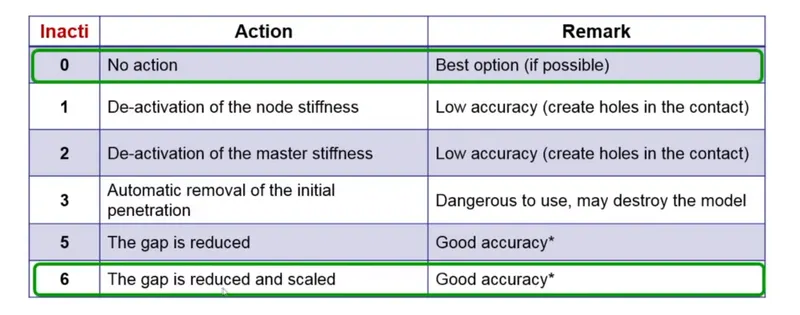
Reason: In the case of going for value 5, it will scale down even further as compared to case 5; the gap is reduced to P0 as shown below figure. Because of that, In the case of vibrations at the slave side, the contact will get activated & deactivated. Which creates the problem. But whereas in the case of 6, it will scale down even further too, in such a way likeless than (Gap-p0). This indicates the less gap when compared to (Gap-p0) of inacti 5. This leads a slave node to vibrate. Because sound wave propagation through it reduces the contact calculations & increases the stability of simulation.
Istf:
The recommended value is 4. The reason is: Because of minimum stiffness, the resistive forces that are being applied on the slave node will be kept to a minimum.
| k = Max[stmin, min(stmax, Ko)] |
where, Ko = min(Km, Ks); Km---> Stiffness of master segment, Ks---> Stiffness of slave nodes.
Example: If a soft component is coming in contact with a hard component, The soft component is going to absorb more resistive force & So that the stiffness of the soft component should be considered. Because, the component is soft, its stiffness is less. The final value for contact stiffness can be bounded by lower(Stmin) & Upper limits (Stmax).
Iform:
Iform means "sliding force computation". The recommended value is Iform: 2.
Reason: Because the, sliding forces are computed using the stiffness parameters of the parameters. But whereas in Iform: 1, the sliding forces are computed using the viscous parameters.
Idel:
The parameter"Idel" indicates the update for deleted elements due to failure. The recommended value is 2. The reason is shown in the below figure.
Finally, the recommended values for the parameters are:-
| Igap | 2 (or) 3 |
| Gapmin | ≥ 0.5 mm |
| Stmin | 1000 N/m (or) 1 KN/mm |
| Istf | 4 |
| Inacti | 6 |
| Idel | 2 |
| Iform | 2 |
Advantages & Disadvantages of Type 7 contact:-
Advantages:
- Physically correct representation
- High accuracy for describing the self contact & buckling.
- Best used with shells to shells (or) solids to shells.
Disadvantages:
- Requires more stringent modeling practices.
- Do not tolerate intersections(Slave node passing master segment).
- Time step may reduce due to increasing interface stiffness.
- With respect to the methodology, It will not see the contact due to edges crossing each other at angles.
Type 11 contact:
- It is also known as edge-to-edge contact. In the case of edge crossing, a type 11 interface can be added to capture the physics correctly.
- It is defined by identifying the master & slave lines in terms of edges.
- It works similar to type 7 contact in terms of penalty formulation, gap definition, search method.
- Slaves will receive stresses & forces. And the object which is to be analyzed is the "Slave".
- Coarser the mesh, stiffer the structure. Hence the master has typically meshed coarser. So that the slave doesn't penetrate into the master. That's why the less deformable (or) highly stiffer structure is taken as master & less stiff as a slave.
Note: Type 19 contact is the combination of both type 7 & type 11 contacts.
PROCEDURE
STAGE 1: Meshing of Bumper Model
Import the bumper model into hypermesh.
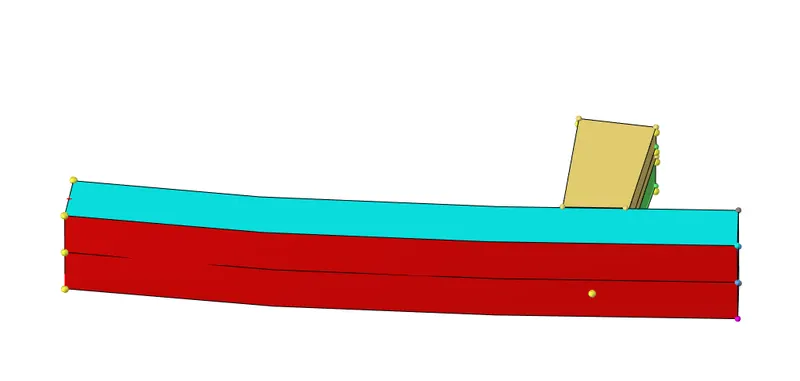
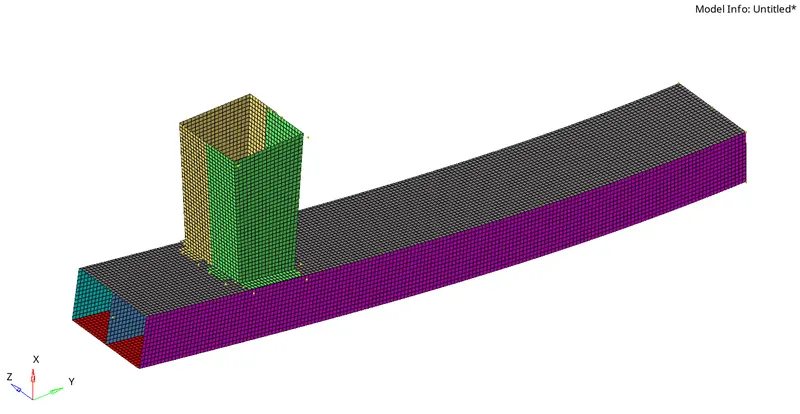
Check for topology. And do the required geometry cleanup on the model. The model looks like the below figure.
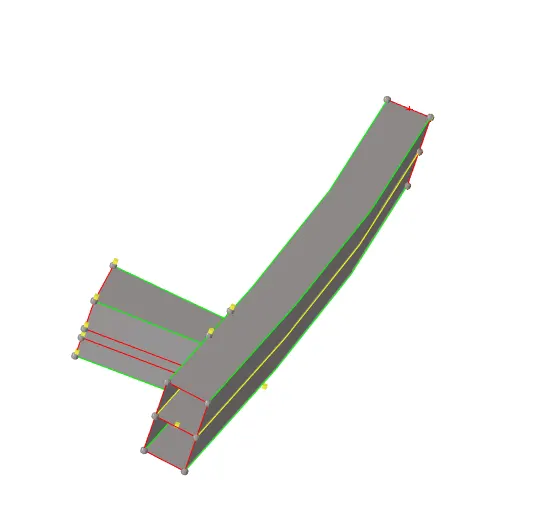
Meshing:- Set the given mesh parameters and mesh the bumper model with element size 6.

STAGE 2: Running the simulation for different cases
case 1: Run the crash tube model as it is.
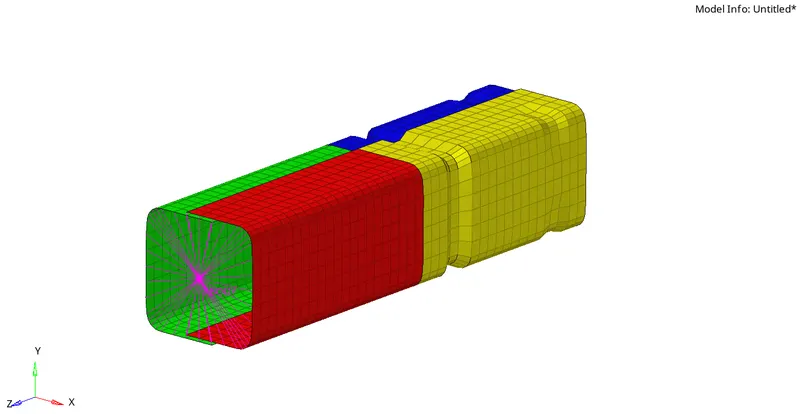
For this case, we have to run the model as it is. firstly the model will look like the below figure.
Firstly, we can move to the solver tab. This can be enabled through View > Browsers > Hypermesh > Solver. Then, we simply need to right-click in the solver interface and go to create > TH > PART to create TH/PART.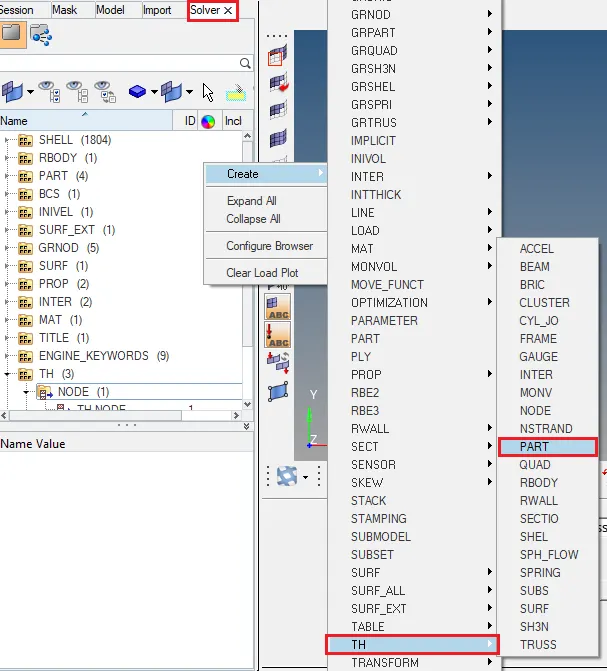
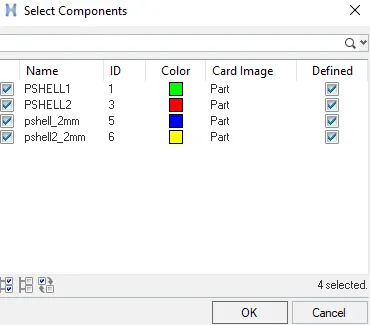
While editing the TH/PART attributes, we need to select all the components as shown.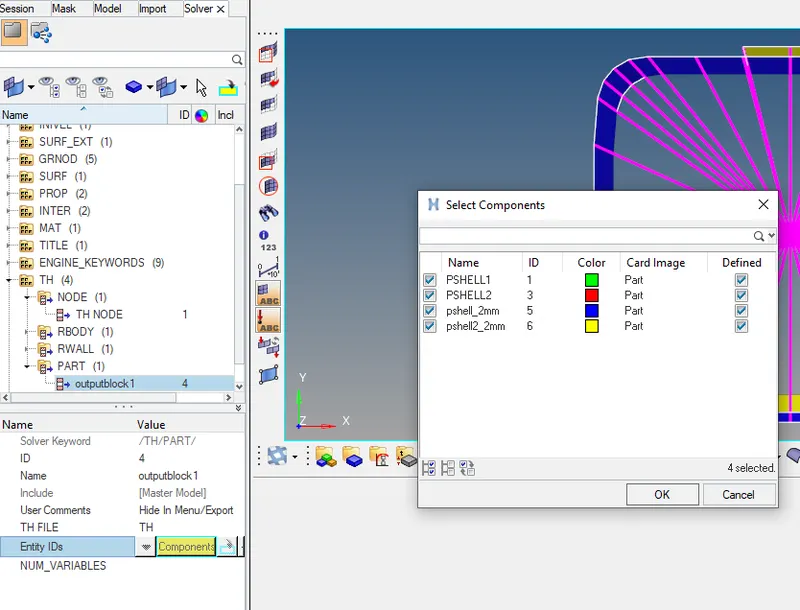
In the radioss section, we can click save as to save the file if it hasn't been saved yet. Care must be taken to include '_0000.rad' in the file name since it's the starter file. After that, we can check the connectors option and input '-nt 4' in the options bar before clicking 'Radioss'. This starts the Radioss simulation, which will run for a few minutes.

The animation file is shown below.
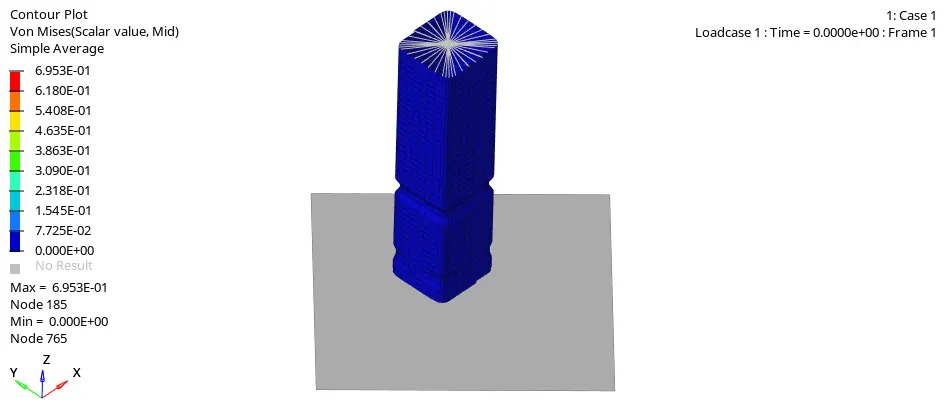
- From the above animation, it is evident that the presence of the notches results in stress concentrations in those regions and as a result, buckling occurs there first.
- This will happen in all the following cases involving notches. The region below the highest notch is completely deformed first.
- After the deformation of the lower part, buckling moves onto the upper part, where buckling takes part next until the crush tube is completely sandwiched between the rigid wall and the source of the force application.
Moving on, we can take a look at the output files to discern possible errors:

As we can see, the energy error is -3.8%. It is acceptable since it is below -15%. In addition to that, there is no mass error (0%)
Taking a look at the energy and rigid wall plots:
INTERNAL ENERGY
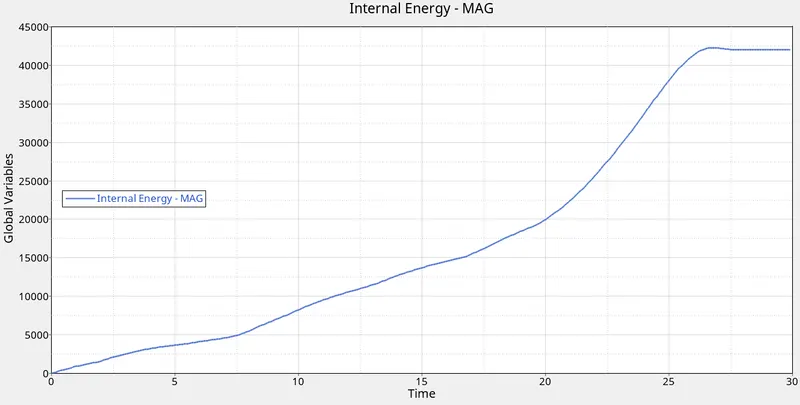
The kinetic energy is traveled along the crush tube, which means while traveling the body it has kinetic energy but, it suddenly hit the wall or any other body/ surface that kinetic energy is converted into internal energy to stop the load condition.
- If we observe the graph the internal energy is less and with respect to time, it increased gradually because there is a change in energy. firstly the kinetic energy will be higher but after that, it will be converted into internal energy.
- At the end of the simulation total, kinetic energy will be converted into internal energy.
SELF CONTACT FORCE
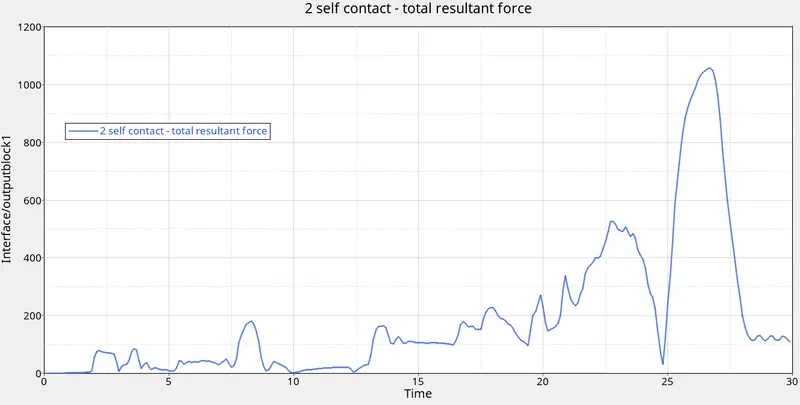
- The self contact force is 1057.05 N. the maximum self contact force occurs at the end of the simulation. so the crush tube is completely deformed and the master and slave nodes contact successfully.
RIGID WALL FORCE
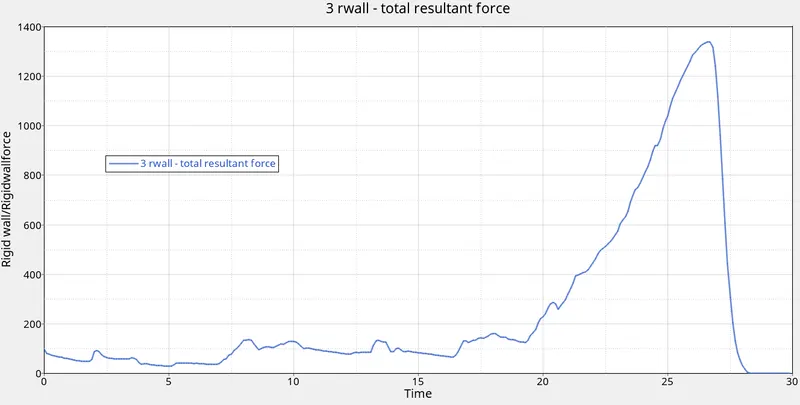
if we observe the rigid wall force it will increase with respect to time up to 20ms point of time and the rigid wall force range is in between the 200KN. after that, there is a sudden increase in its rigid wall force, due to the crush tube reaching the last stage, so the crush tube force is changed to the rigid wall force so at that time the rigid wall force is more compared to the previous.
CASE 2: Change the Inacti=6 and run
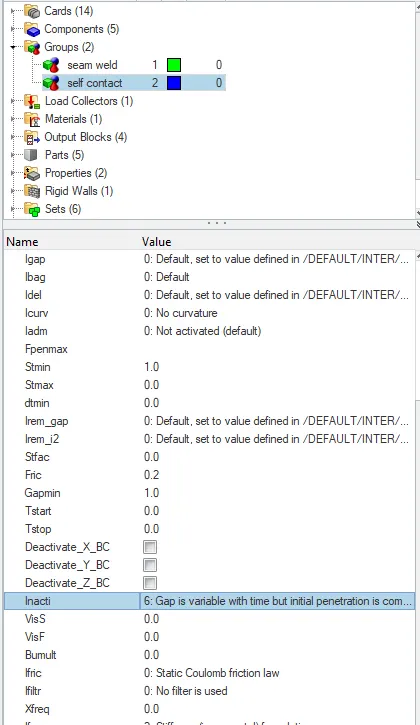
In this case, In the interfaces card, the inacti value is changed to 6. Then, the simulation is run. With this, the gap will be scaled further in between the slave & master.
Then the obtained simulation from the h3d file in terms of von-mises stress appears as shown in the below animation.
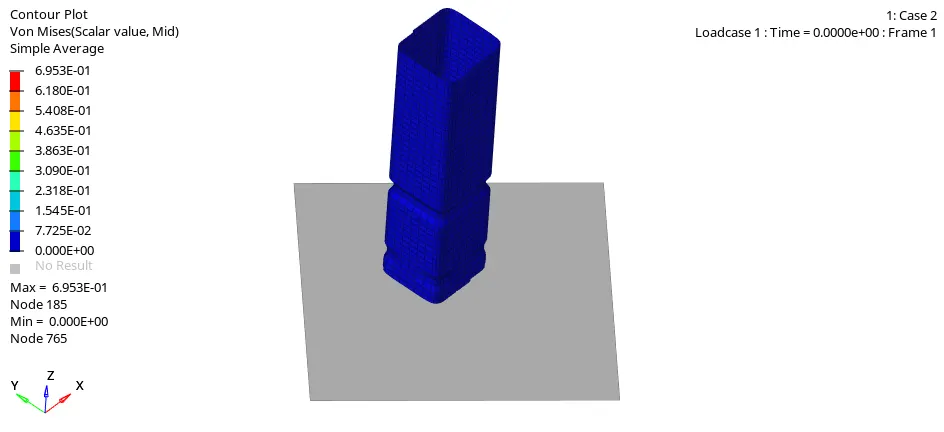
There isn't any discernible difference between case 1's and case 2's animations, they're both very similar. Even though the Inacti parameter was changed, it didn’t have any effect on the simulation as there was no initial penetration to manage in the first place.
Next, we can take a look at the output file:
As we can see, the values are the same as in case 1. The energy error is the same -3.8% (also the same mass error of 0%). Moving on to the plots:
INTERNAL ENERGY
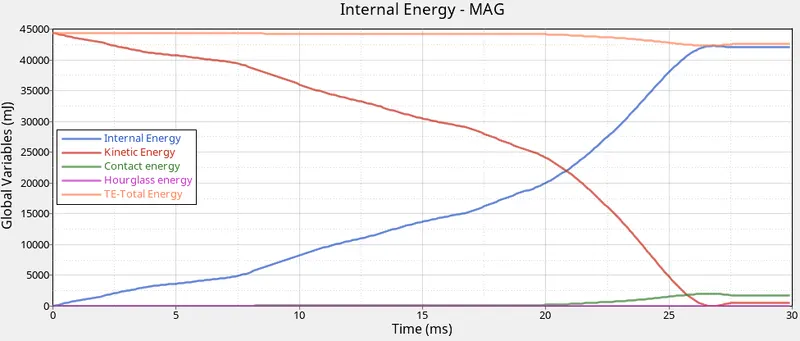
There isn't much to be said as the graphs are exact copies of that of case 1. The only thing we have learned from the energy plot is that there is no initial penetration since there is no difference between case 1 and case 2 energy plots (since the simulation was tweaked to detect such penetrations through the inacti function). If any initial penetrations existed, internal energy would start from a non-zero value.
SELF CONTACT FORCE
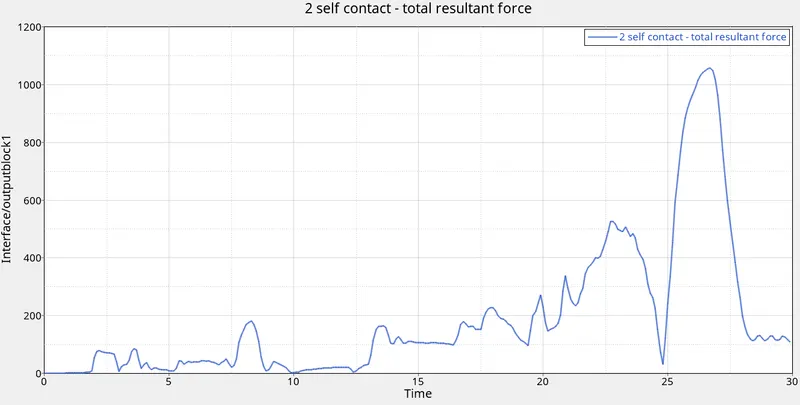
The maximum self contact force is noted at the end of the simulation due to the contact of the master and the slave node. the maximum self contact force is 1057.05 N and the time taken by the contact force is 26ms. this is the contact force.
RIGID WALL FORCE
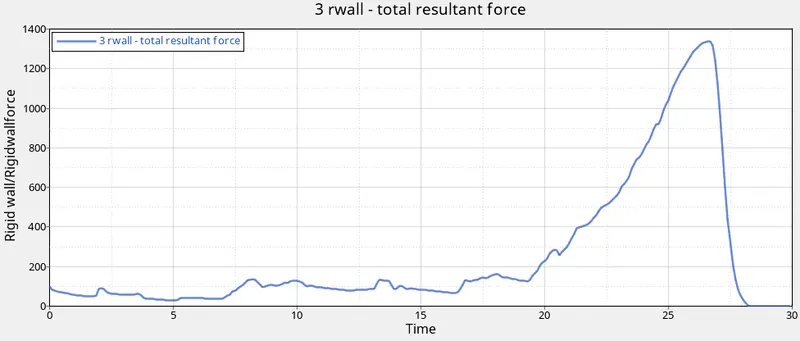
RWall forces also exhibit the same characteristics as in case 1.
CASE 3: Create the type 11 contact and run
In this case, the new contact is named "Type 11". In this contact, some parameters are to be entered, as shown in fig 5.39. In order to get, better results.
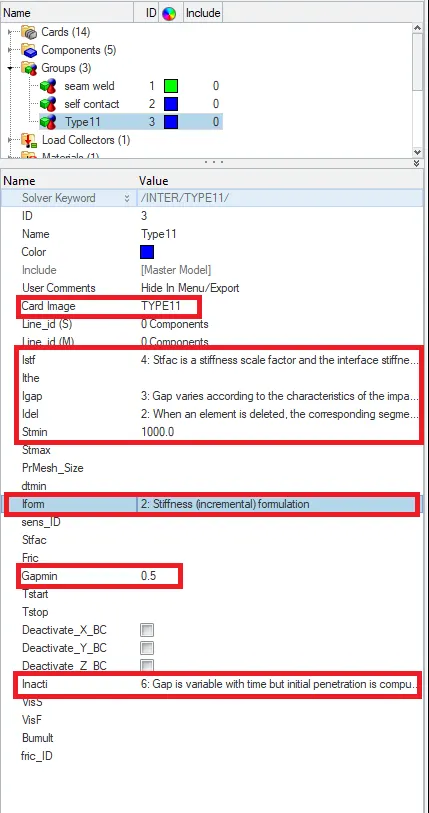
While defining the slaves & master, ensure that all elements should be as a slave & as well as master.
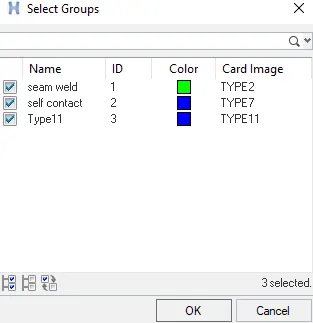
After creating the contact, then for obtaining the output a TH is requested for that contact. While defining the TH for that contact, the interfaces should be entered.
The next step is to run the simulation. After running the simulation, the obtained simulation from h3d file in terms of von-mises stress appears as shown in the below animation.
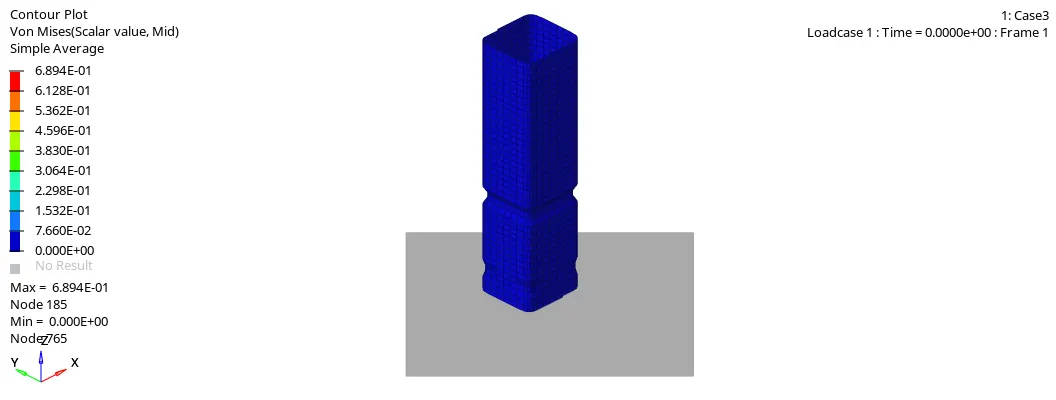
And here are the output file values:
Energy error is still within the -15% limit at -1.6%. Mass error is non-existent. Moving on to the plots:
INTERNAL ENERGY
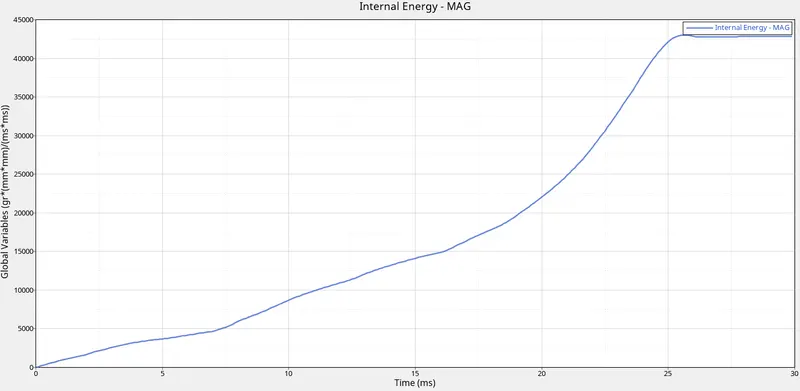
If we noticed in this type 11 we got a kinetic energy conversion at the point of 20ms of time in the x-axis exactly. so, here we can say the energy conversion rate is faster in type 11 compared to type 7. the crush tube energy is contacted to the rigid wall.
SELF CONTACT FORCE
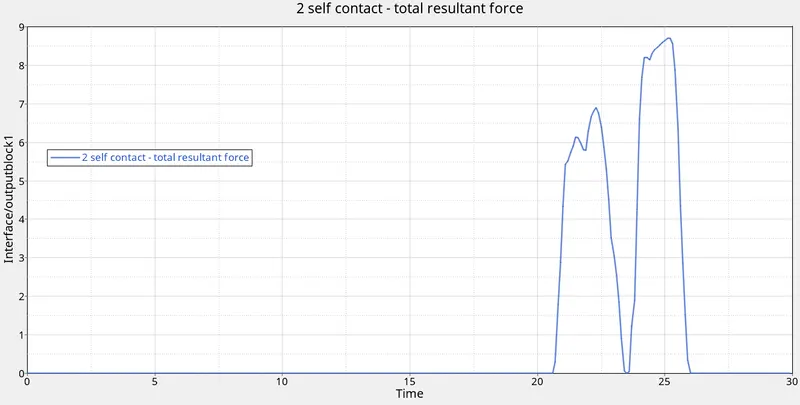
The contact force has a lot of fluctuation due to type 11. it is a line-to-line contact or edge-to-edge contact. so here the contact force is fluctuated due to the line-to-line contact. the maximum contact is noted at 26ms with a self contact force of 2.77 N.
RIGID WALL FORCE
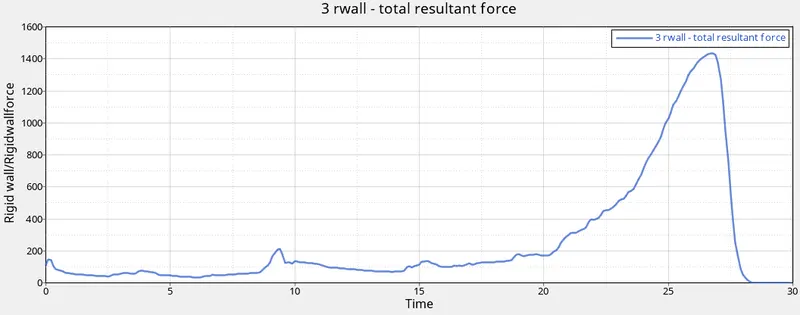
Here, the deformation characteristics are similar to what was observed in previous cases. There is no discernible difference between the energy and rigid wall plots of this case and previous cases. Therefore, we can conclude that there was no edge-to-edge penetration in this model.
CASE 4: Remove both notches and remove boundary condition on rigid body node then run
For this case, we are required to remove the notches and boundary conditions. To do that, after importing the solver deck file (starter file for case 3), we can make use of one of the mesh edit functions available on Hyperworks - the align node tool (F7).
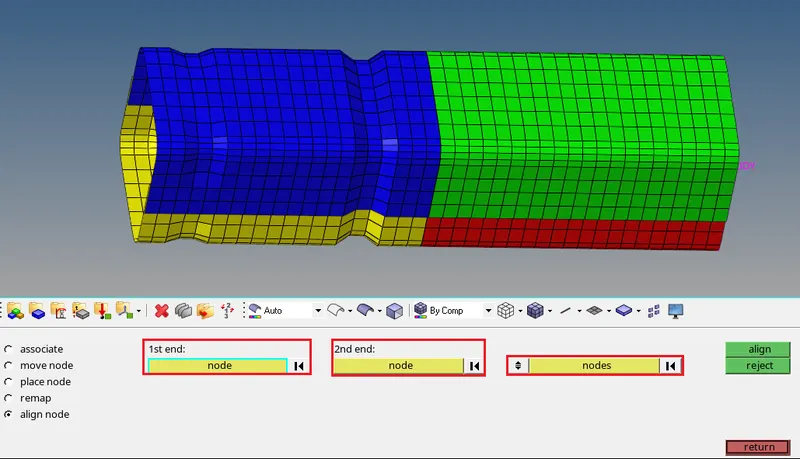
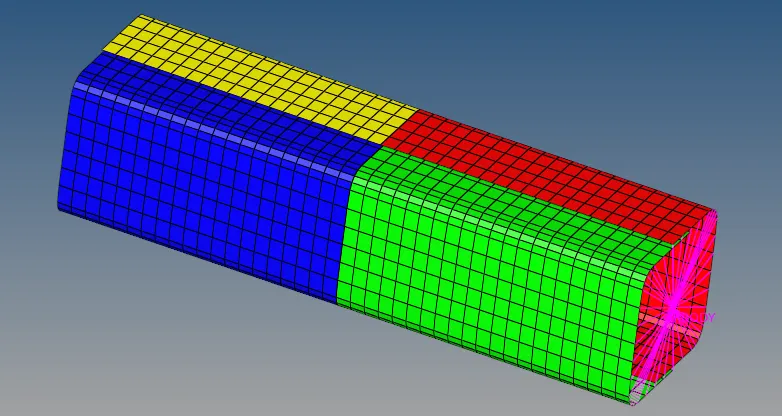
Without notches:
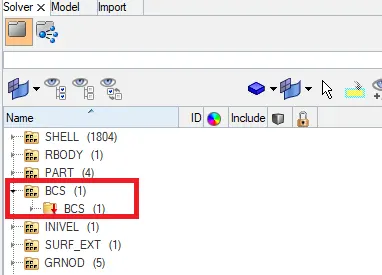
The next step is to remove the boundary condition on the rigid body node. Which is present in the tab bar in the solver browser.
Then the simulation is run. After running the simulation, the obtained h3d file is imported into another window. To view the simulation. The obtained simulation appears as shown in the below animation.
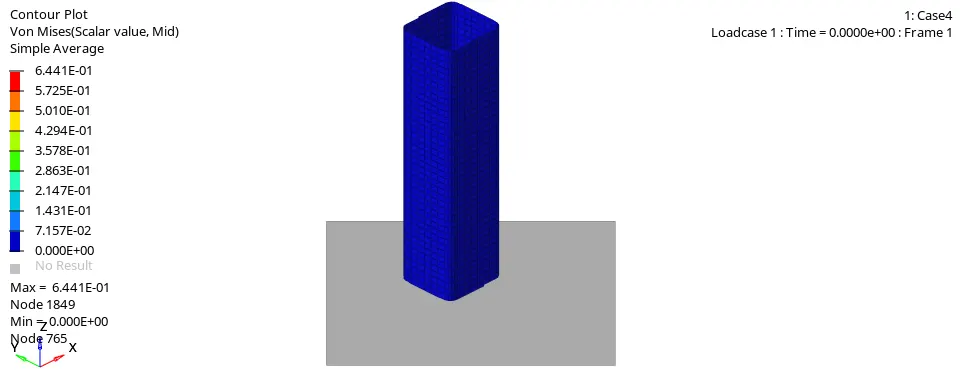
Since there are no notches present, the buckling started at the contact area of the rigid wall and the tube. Whereas, in previous cases, the initial buckling or deformation would happen at the notches.
Here are the output values, which are acceptable numbers:

Take a look at the energy plot:
INTERNAL ENERGY
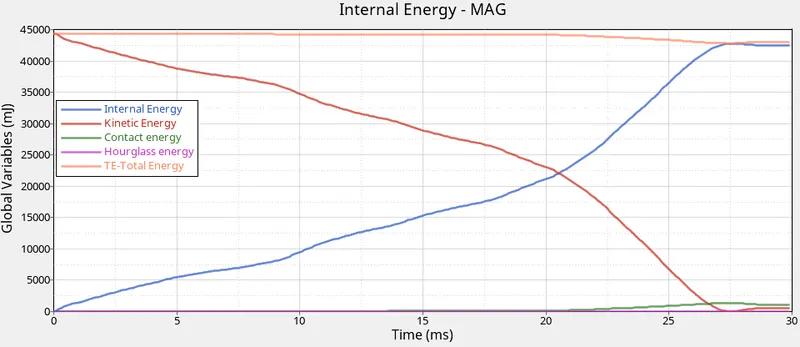
The kinetic energy decreases from maximum with an increase in internal energy.
SELF CONTACT FORCE
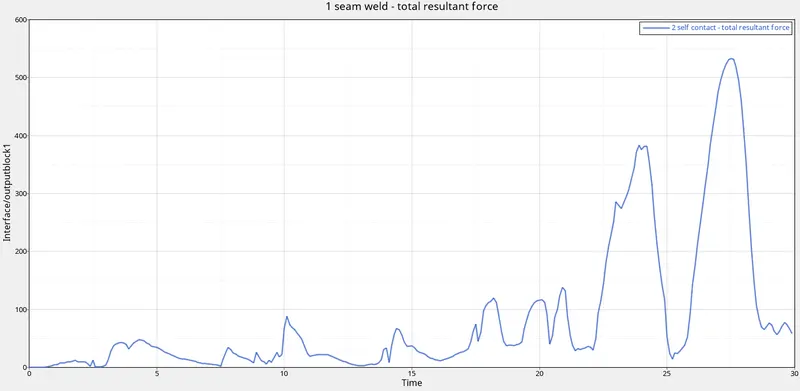
There is a reduction in the contact forces. Because the notches & boundary conditions are removed. So, the energy will be observed by the elements will be faster when compared to the previous cases with the notches.
RIGID WALL FORCE
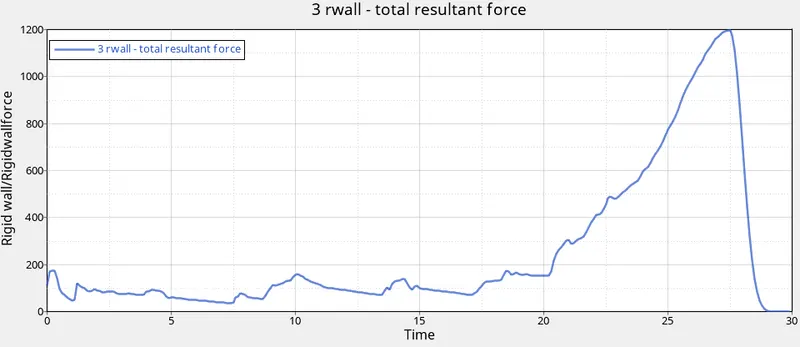
The total resultant force peaks at almost 1197.7 kN. Just as in the case with internal energy in the previous plot, there is a steep increase at the 20ms mark here as well. At this point, a large amount of force is being transferred to the rigid wall considering the crush tube is almost completely deformed to absorb any more energy.
CASE 5: Create a new notch in the middle, select the whole section and run
In this case, a notch is created at the middle of the tube.
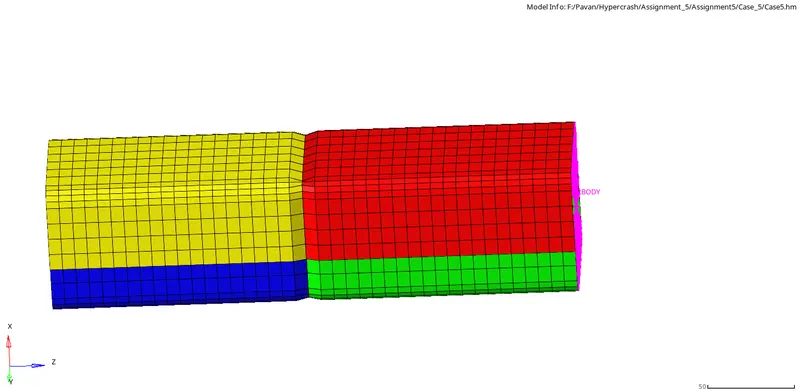
Now, we need to run the analysis through the radioss engine and generate the simulation. This is what it looks like:
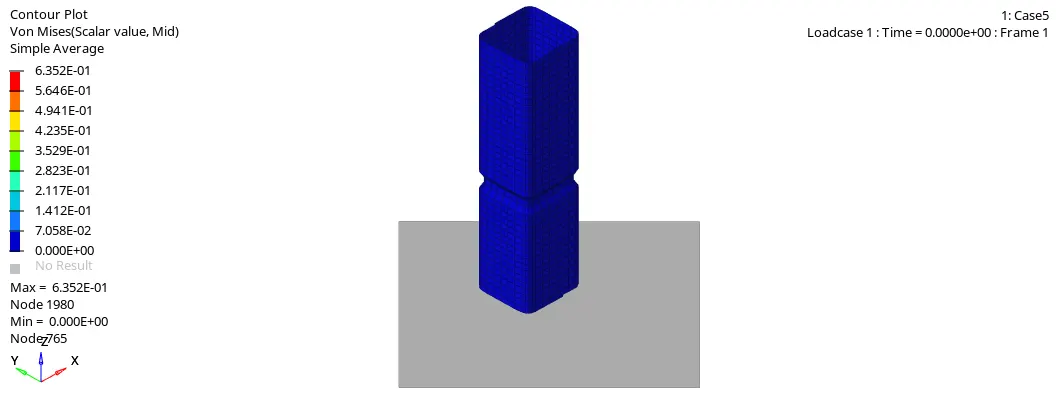
Just as in the first 3 cases, the notch is the region where the tube undergoes deformation first. Then the region closer to the rigid wall is deformed next, which would be the lower half of the tube.
Taking a look at the readings in the output file, we can see that the values are acceptable:

Moving on to the energy and rigid wall plots:
INTERNAL ENERGY
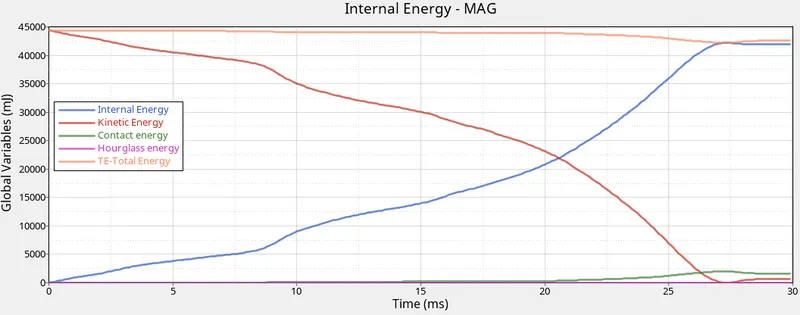
There is no immediate difference between case 4 and case 5.
SELF CONTACT FORCE
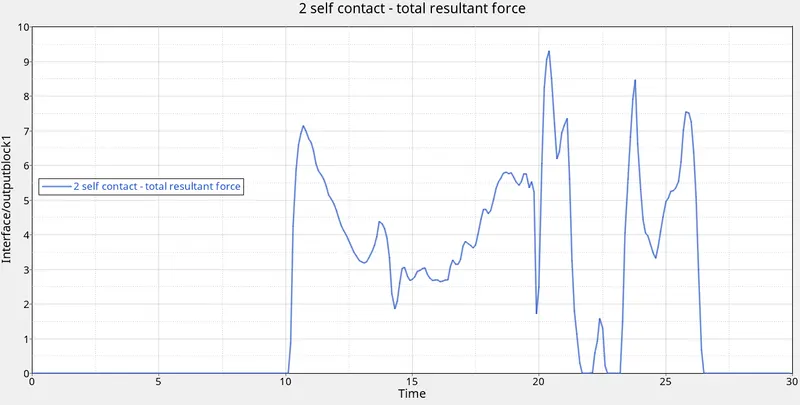
The self contact force is fluctuated due to the notch creation at the middle of the crush tube. so the rigid body of the master node force is acting in the middle of the crush tube and that force is directly acting on the rigid body with a contact force and also the rigid body is not fixed. because we deleted the boundary conditions.
RIGID WALL FORCE
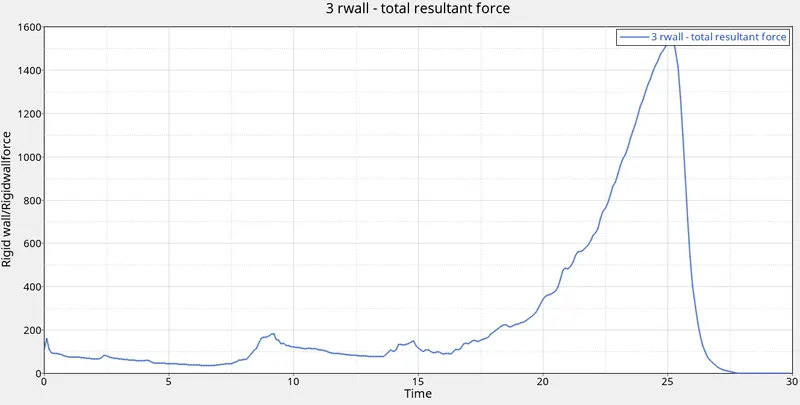
The Max rigid wall force is noted 1173.51N and in the time range of 26ms. this is equal to case 2 of the crush tube.
CASE 6: Create a new notch with nodes only from opposing 2 faces and run
For this case, we can make use of case 5's starter file and follow the same process of creating notches but instead of creating one all around the tube, we simply create two separate notches on opposing faces of the crush tube.
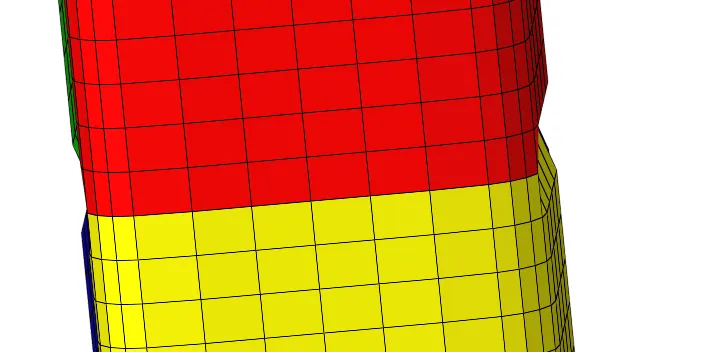
We can then carry out the analysis using radioss as outlined in the main procedure. The simulation is as follows: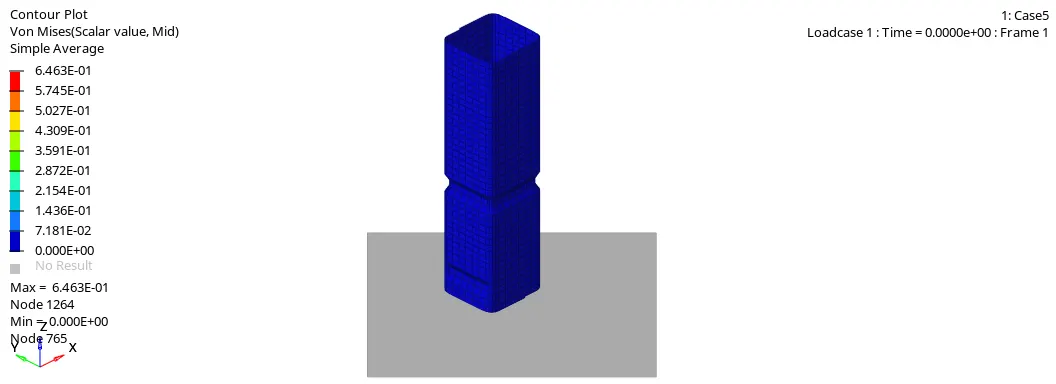
Just as in the previous case, initial buckling takes place along the notches and the overall deformation follows the same pattern. The region above the highest notch is virtually unaffected until the 10ms mark when most of the regions below the notches have been deformed. Moving on to the output file readings:

They have acceptable energy and mass error values.
Taking a look at the energy and rigid wall plots:
INTERNAL ENERGY
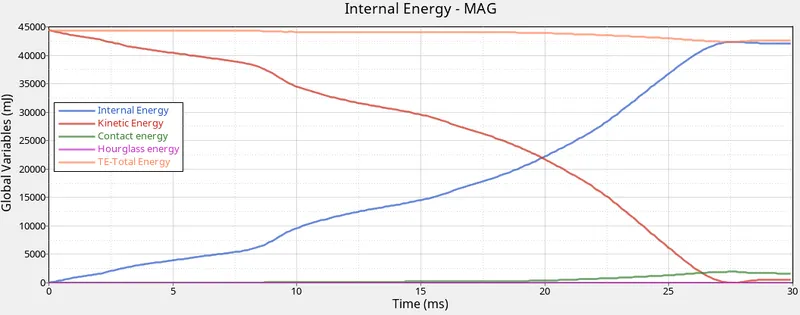
Again, the plots are quite similar in nature to the earlier case.
SELF CONTACT FORCE
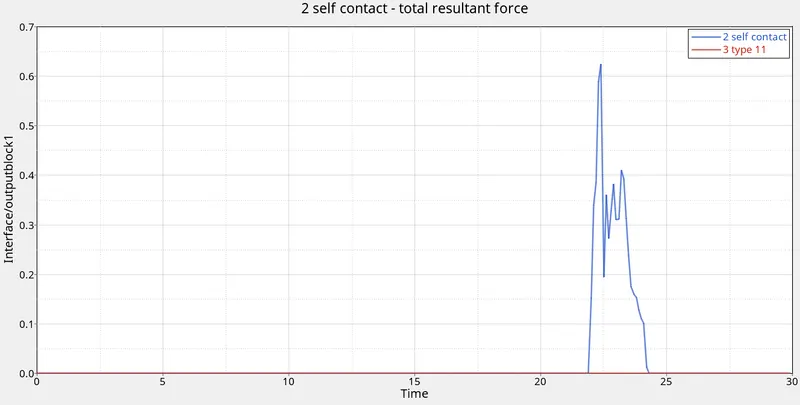
The self contact force is developed at starting of type 11 due to the notch present in the middle. The max self contact force is 1705.12 N and the time is 21ms.
RIGID WALL FORCE
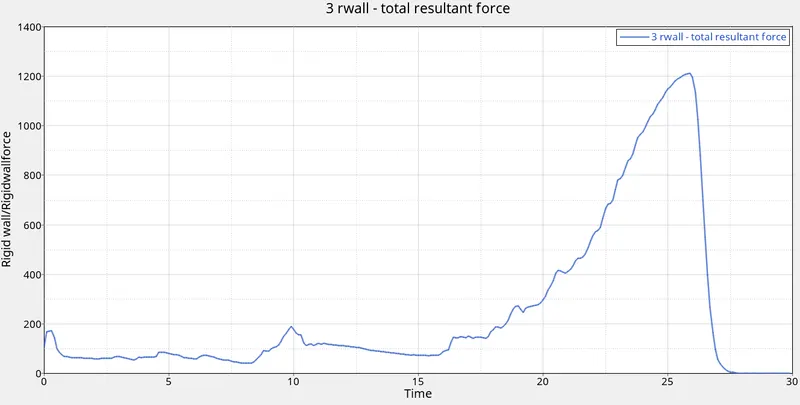
The max rigid wall force is noted at 1264.3 N. the crush tube deformed totally and that energy is impacted on the rigid wall.
COMPARISON OF ABOVE CASES:
| PARAMETERS/CASES | CASE 1 | CASE 2 | CASE 3 | CASE 4 | CASE 5 | CASE 6 |
| ENERGY ERROR | -3.8% | -3.8% | -1.6% | -3% | -3.5% | -3.4% |
| MASS ERROR | 0.00% | 0.00% | 0.00% | 0.00% | 0.00% | 0.00% |
|
MAX CONTACT FORCE |
1057.05 N | 1057.05 N | 2.77 N | 536.78 N | 1858.89 N | 1705.12 N |
| MAX RIGID WALL FORCE | 1338.18 N | 1338.18 N | 1588.7 N | 1197.7 N | 1173.51 N | 1264.3 N |
CONCLUSION:
- Generated the mesh for the given bumper component with a mesh size of 6 mm.
- Changed the parameters for the given crash tube model as various cases.
- Finally, plotted the graphs with RWALL forces, contact forces, internal energy & compared the results.
LEARNING OUTCOMES:
- Contact modeling
- Types of contacts
- What is master and slave node
- Observing the variation in results with respect to the change in notches.