Assignment 4-RADIOSS Material Laws Challenge
Objective :
To create a simple drop test simulation using three different materials under different cases with the help of Radioss solver and Hyperview.
I. Mat law 2 Johnson cook.
II. Mat law 27 Plast_Brit.
III. Mat law 36 Elastic - Plastic.
Explanation of Radioss materials :
- These three laws come under Elasto - Plasticity isotropic materials i.e, the material behaves like elastic and by hardening, materially contributes more plasticity, and properties are the same in all direction of the material.
- The strain hardening behavior of materials is a major factor in structural response as metalworking processes or plastic instability problems. A proper description of strain hardening at large plastic strains is generally imperative.
- For many plasticity problems, the hardening behavior of the material is simply characterized by the strain-stress curve of the material. For the proportional loading, this is generally true. However, if the loading path is combined, the characterization by a simple strain-stress curve is no longer adequate.
- The incremental plasticity theory is generally used in computational methods. Plasticity models are written as rate-dependent or independent. A rate-dependent model is one in which the strain rate does affect the constitutive law. This is true for a large range of metals at low temperatures relative to their melting temperature.
Mat law 2 Johnson cook:
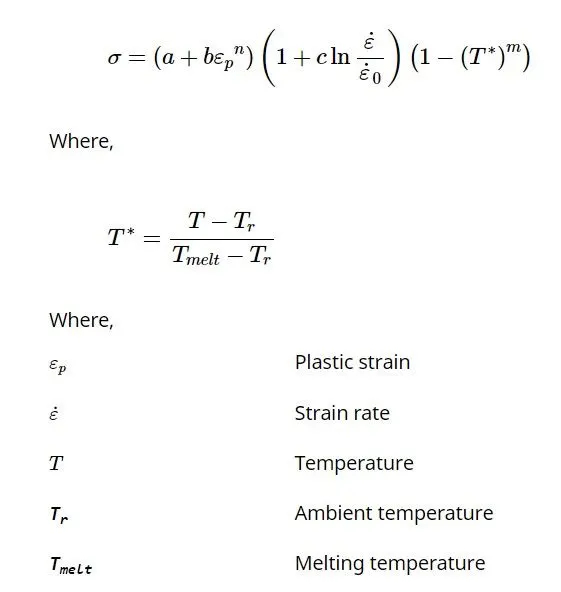
This law represents an isotropic elastoplastic material using the Johnson cook material model. This model expresses material stress as a function of strain, strain rate, and temperature. Built-in failure criteria based on the maximum plastic strain available.
MAT LAW 27:
This law combines an isotropic elastoplastic Johnson-Cook material model with an orthotropic brittle failure model. Material damage is accounted for prior to failure. Failure and damage occur only in tension. This law is applicable only for shells.
MAT LAW 36:
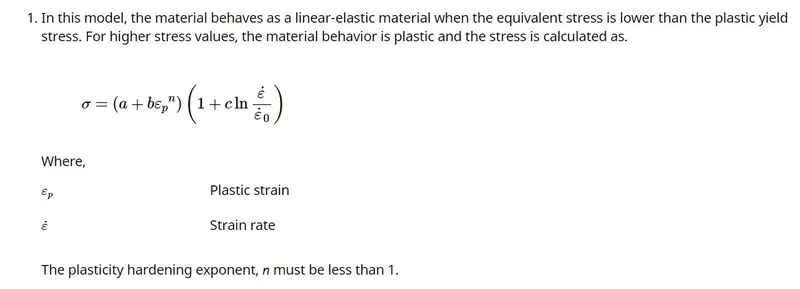
- This law models an isotropic elastoplastic material using user-defined functions for the work-hardening portion of the stress-strain curve (for example, stress vs. plastic strain) for different strain rates.
- This material property is available for brick and shell elements.
Case:1
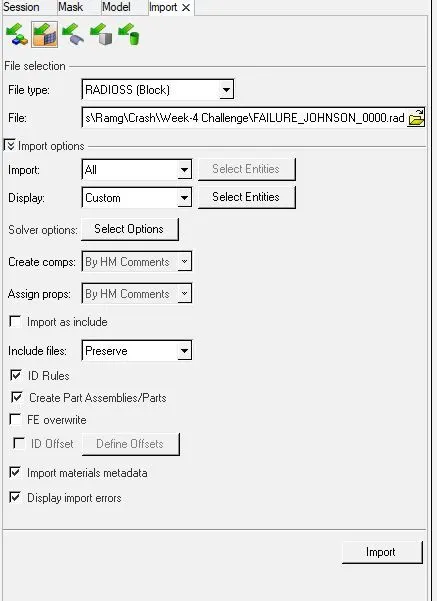
- The Model is imported using the rad file.
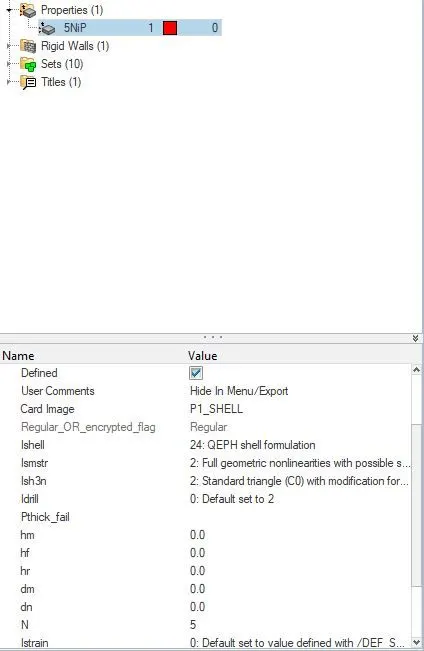
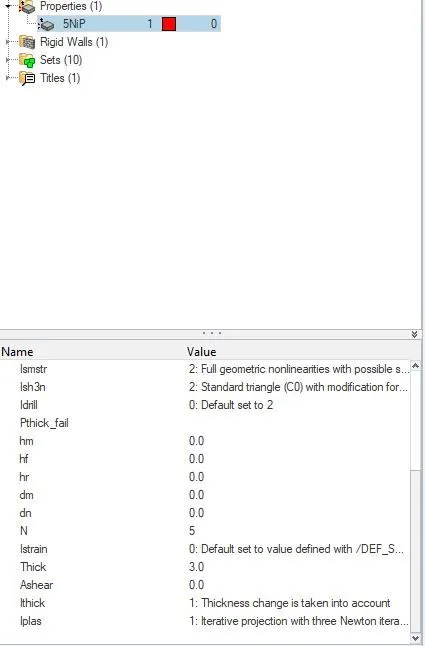
- The default properties are used for this simulation.
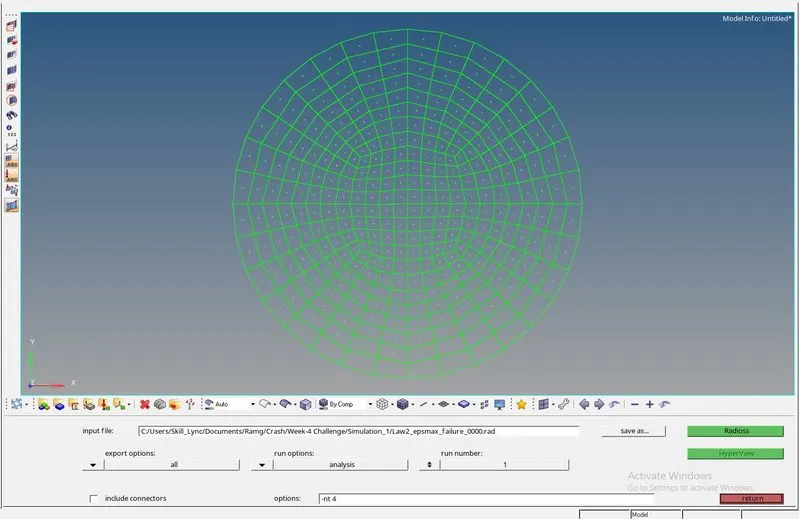
- The output name is saved as Law2_epsmax_failure.
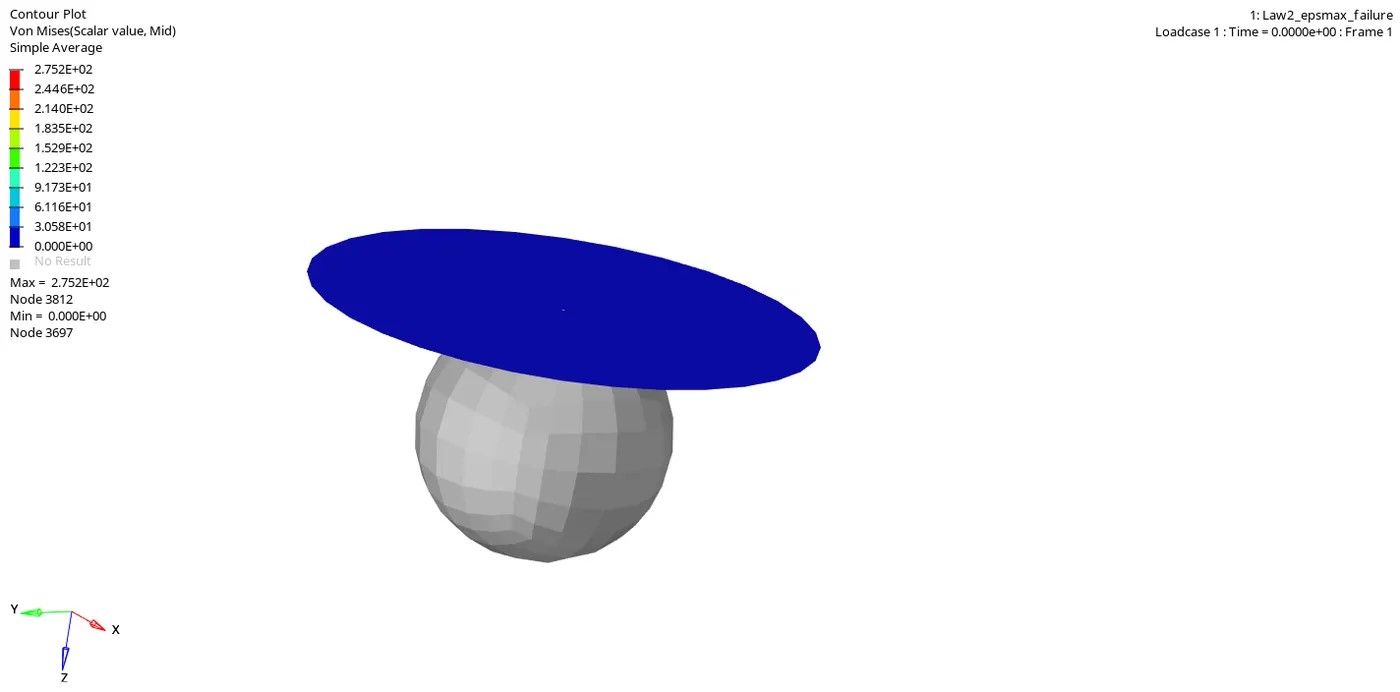
- Using the Hyperview, contour plot for von mises stress is plotted and the animation is shown above:
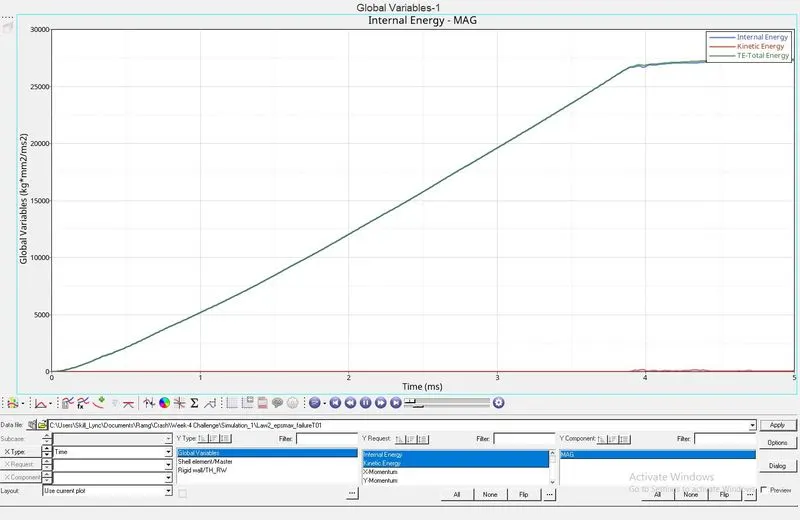
- Using the Hypergraph, the Energy plot is plotted.
- From this plot, we can infer that the kinetic energy is almost zero.
- There is a linear increase in the total energy& internal energy up to 3.8ms.
- At about 4ms, there is a small dip in the internal energy and from there the internal energy & kinetic energy have slight differences.
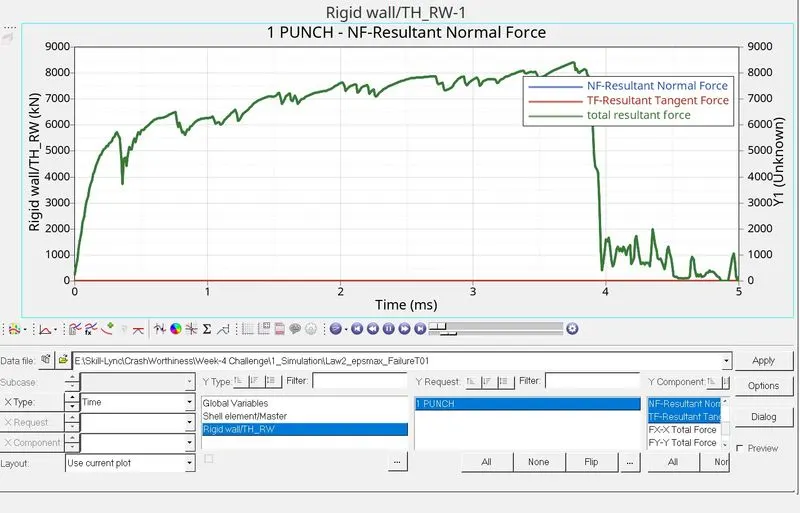
- From the plot, it can be seen that the resultant tangent force is completely zero.
- The total resultant force has a steep increase in the beginning up to 5.7 KN and from there onwards, there are ups & downs in the curve.
- The number of dips decreases as the analysis progresses.
Case-2:
The Model is imported using the rad file.
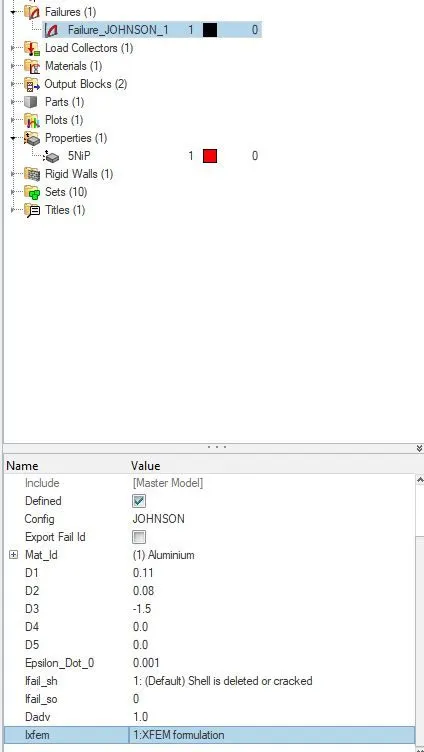
- In the property card, Ifail_sh=1, Dadv=1, and Ixfem=1 were changed for this simulation.
- Since, Ixfem value is set as 1, while in simulation the elements will break into most real form and fails, and the Ifail_sh value is set as 1, before deleting the elements crack will occur.
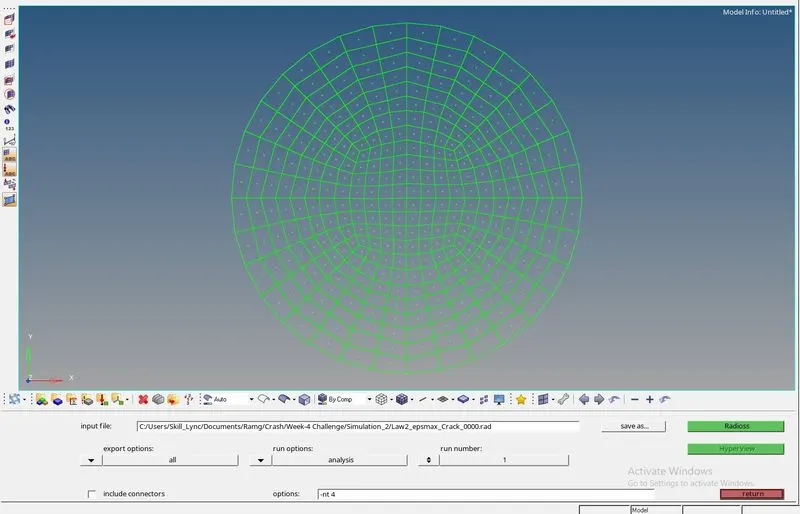
- The simulation is run using the output name is saved as Law2_epsmax_Crack.
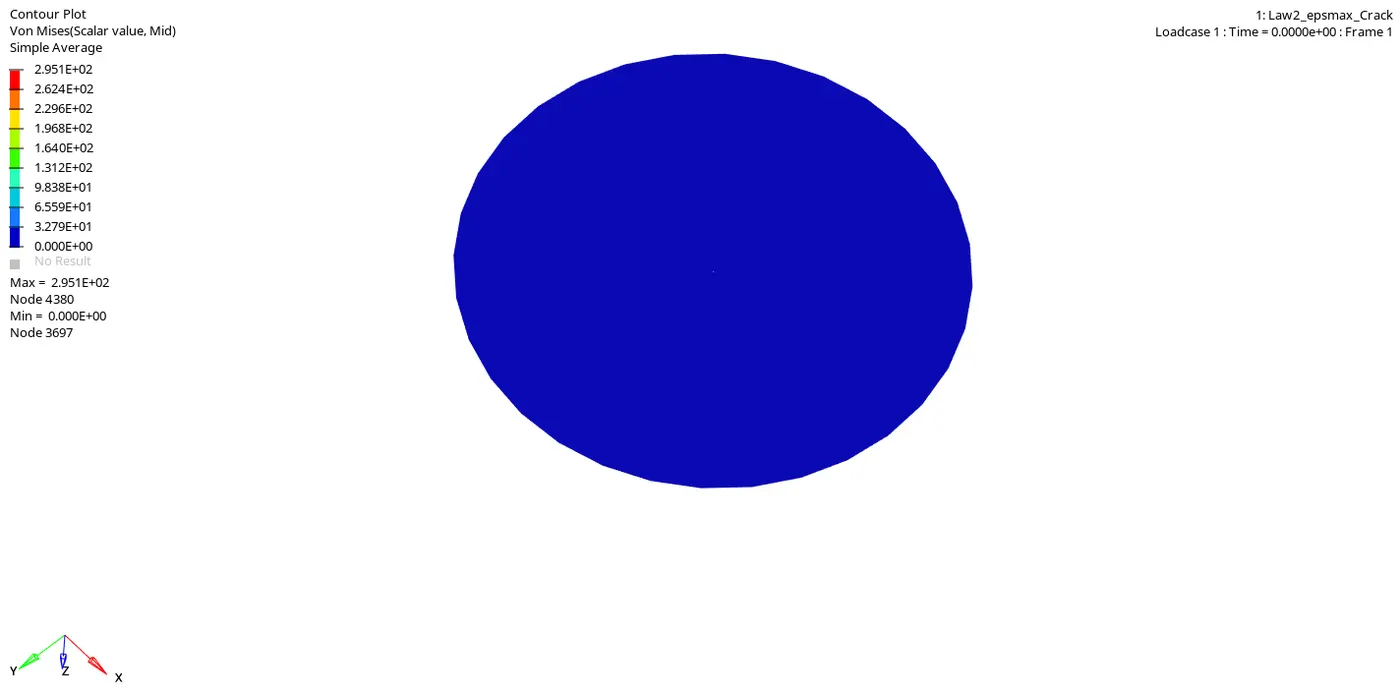
- Using the Hyperview, contour plot for von mises stress is plotted and the animation is shown above:
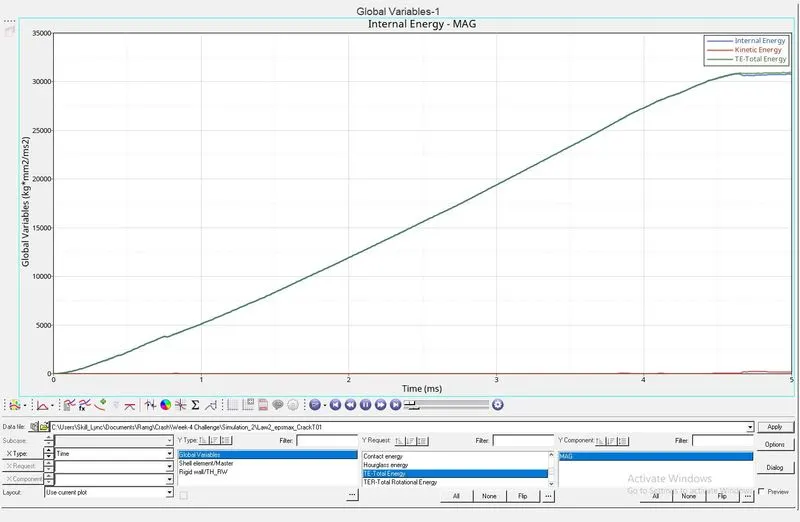
- Using the Hypergraph, the Energy plot is plotted.
- From this plot, we can infer that the kinetic energy is almost zero.
- There is a linear increase in the total energy& internal energy up to 3.8ms.
- At about 4ms, there is a small dip in the internal energy and from there the internal energy & kinetic energy have slight differences.
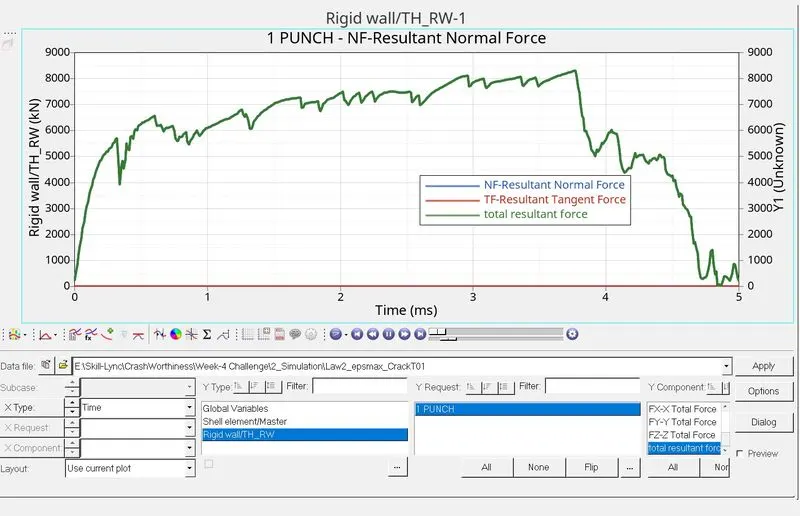
- From the plot, it can be seen that the resultant tangent force is completely zero.
- The total resultant force has a steep increase in the beginning up to 5.7 KN and from there onwards, there are ups & downs in the curve.
- The number of dips decreases as the analysis progresses.
Case-3:
- The Model is imported using the rad file.

- Johnson's card is deleted for this simulation.
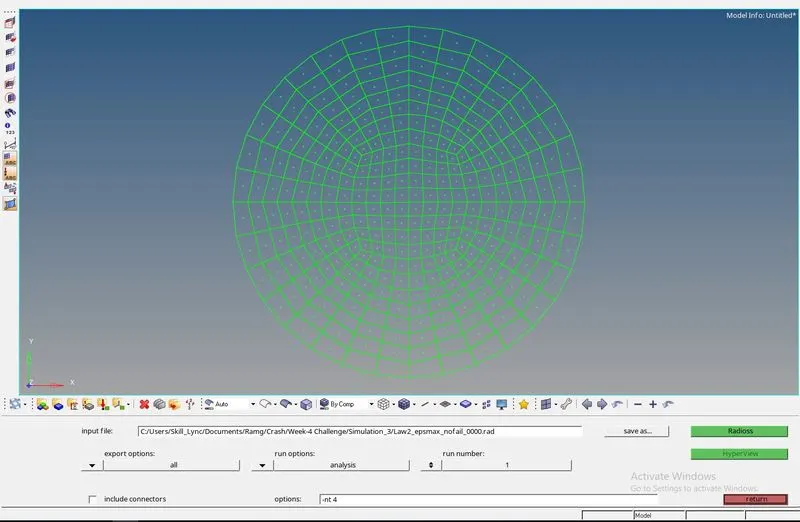
- The simulation is run using the output name is saved as Law2_epsmax_Nofail.
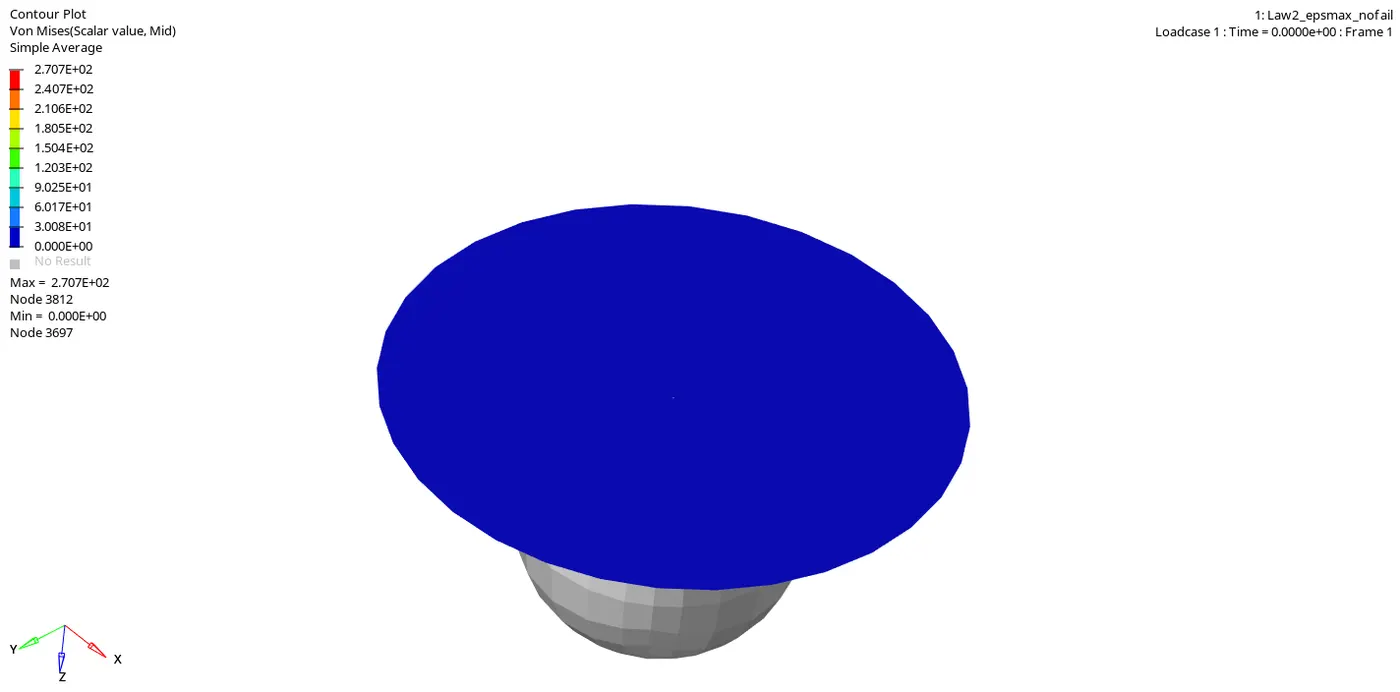
- Using the Hyperview, the contour plot for von mises stress is plotted and the animation is shown above.
- Since the failure card is deleted the elements are deleted in unrealistic form.
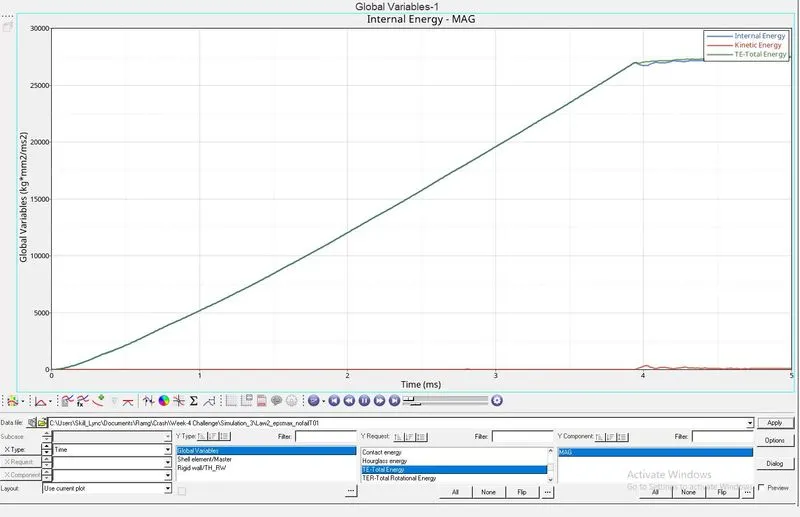
- Using the Hypergraph, the Energy plot is plotted.
- From this plot, we can infer that the kinetic energy is almost zero.
- There is a linear increase in the total energy& internal energy up to 3.8ms.
- At about 4ms, there is a small dip in the internal energy and from there the internal energy & kinetic energy have slight differences.
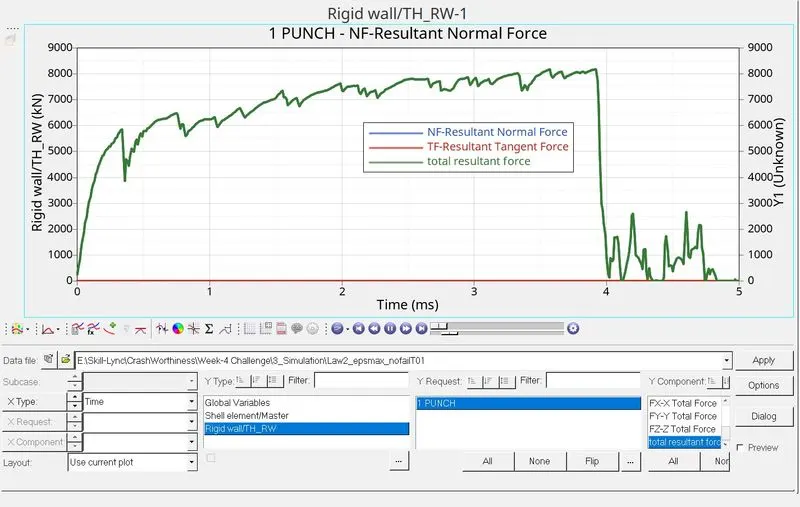
- From the plot, it can be seen that the resultant tangent force is completely zero.
- The total resultant force has a steep increase in the beginning up to 5 KN and from there onwards, there are ups & downs in the curve.
- There was a steep decrease in the curve at about 3.9ms and from there onwards there were many ups and down's in the curve.
Case-4:
- The Model is imported using the rad file.
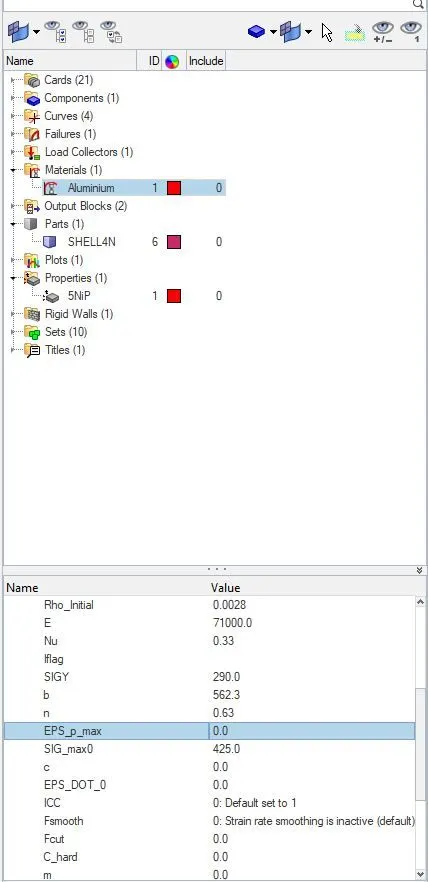
- The Eps_max value is deleted for this type of simulation.
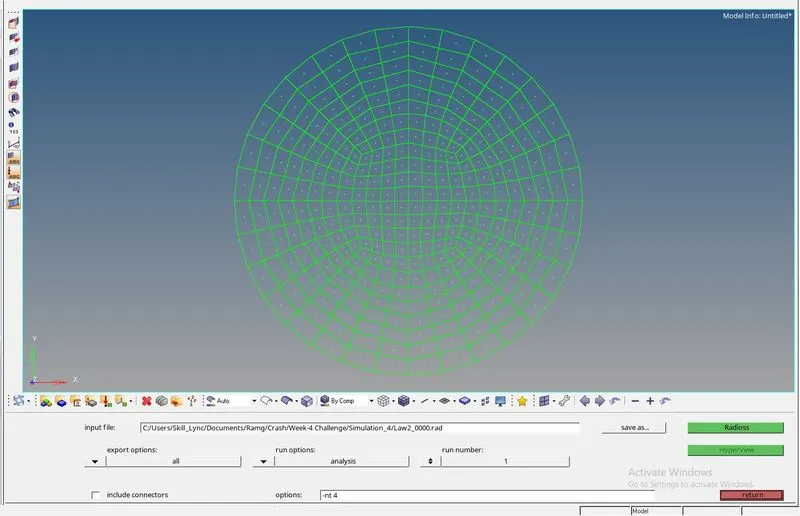
- The simulation is run using the output name is saved as Law2.
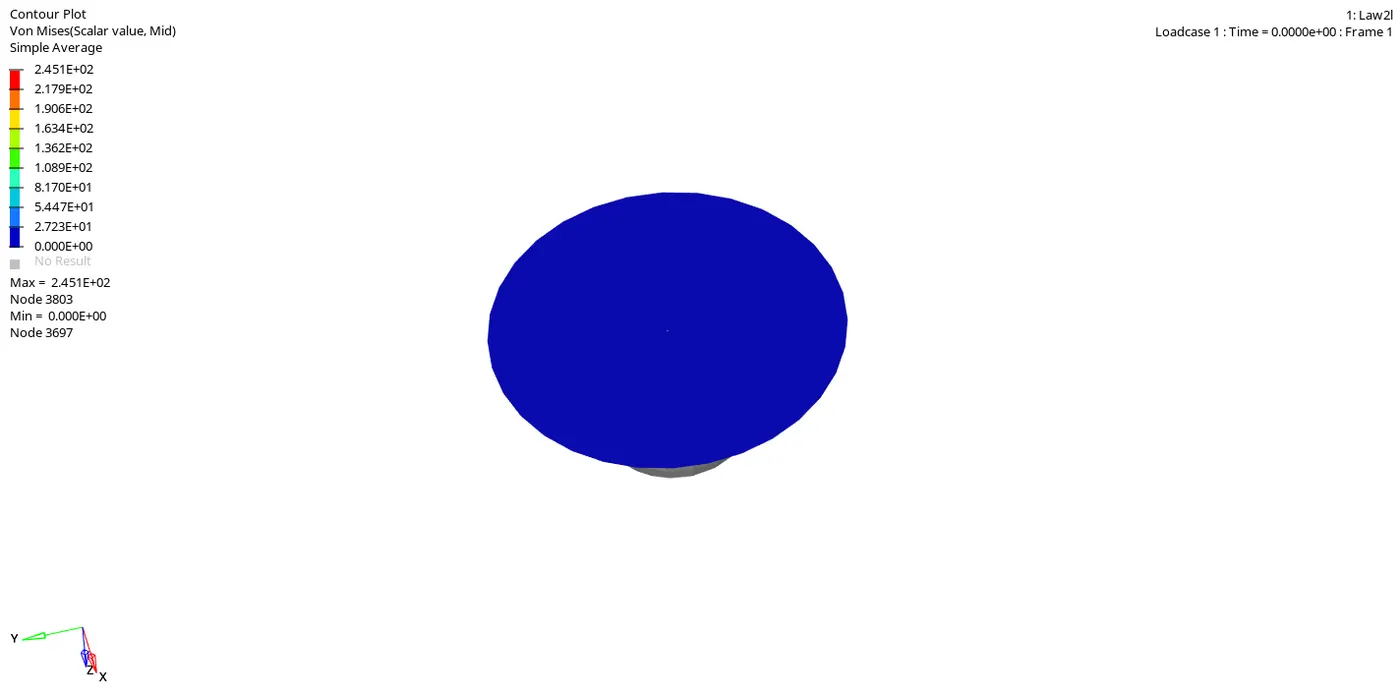
- Using the Hyperview, contour plot for von mises stress is plotted and the animation is shown above:
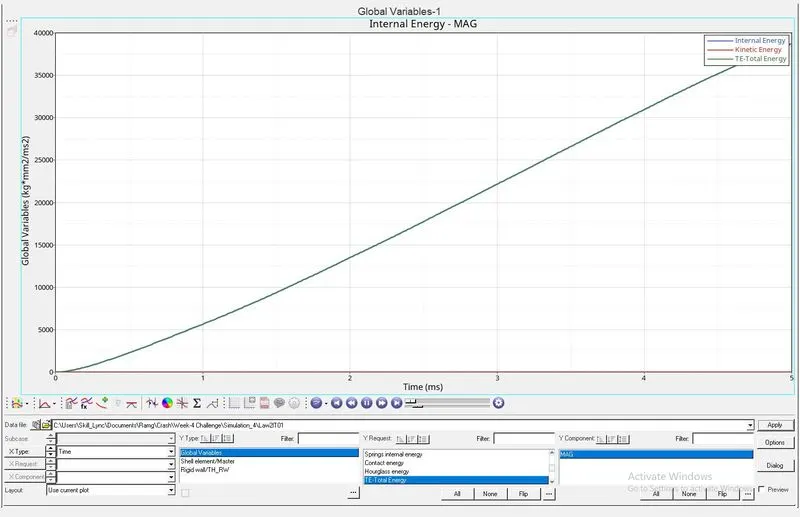
- Using the Hypergraph, the Energy plot is plotted.
- From this plot, we can infer that the kinetic energy is zero.
- There is a linear increase in the total energy& internal energy.
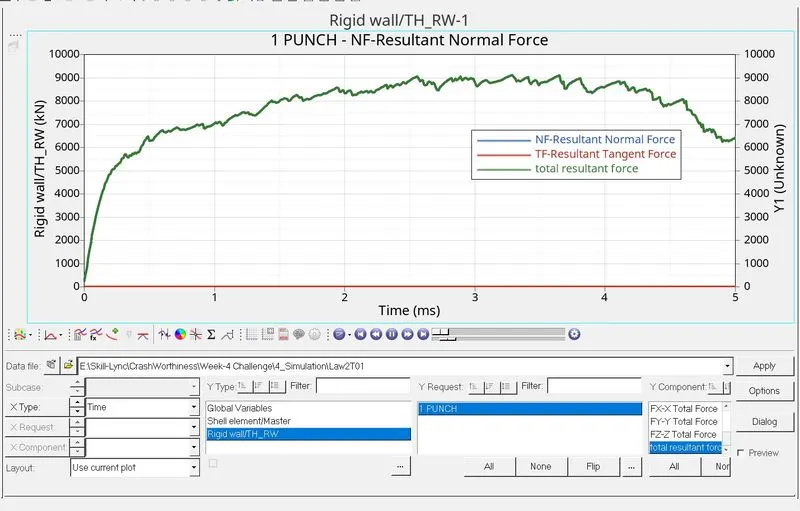
- As for the rigid wall forces, the resultant tangent force is completely zero. The total resultant force as in the previous cases sees a steep increase at the beginning up to 5.6 kN. Then the force increases slowly. There are no major falls & rises in the curve, as in the previous cases.
- From the curve, we can see an average rise and then an average fall which is stopped at 5 ms as the analysis is stopped. If the analysis would have run for some more time, we could have seen the results further.
Case-5:
- The Model is imported using the rad file.
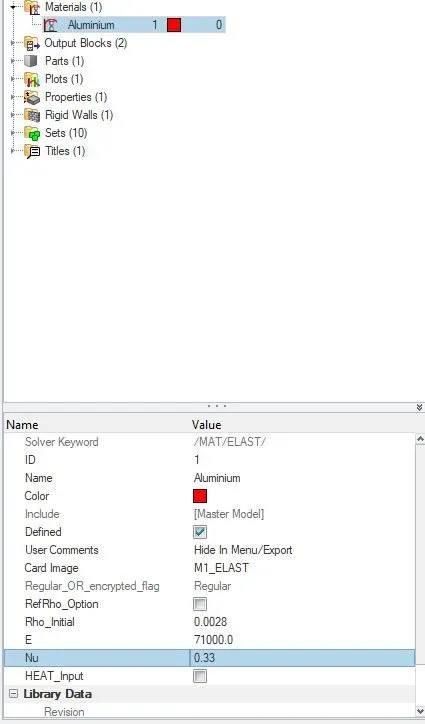
- The material property card is changed to law1 and the same density, E, and nu value as used in the previous cases.
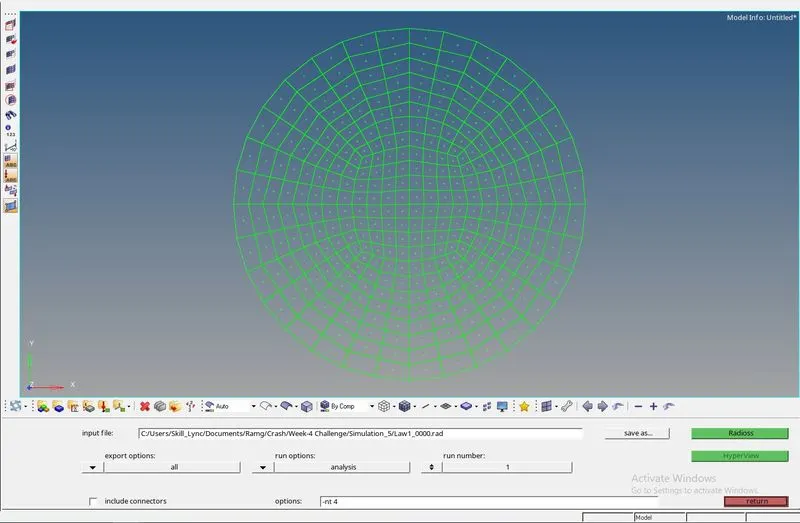
- The simulation is run using the output name is saved as Law1.
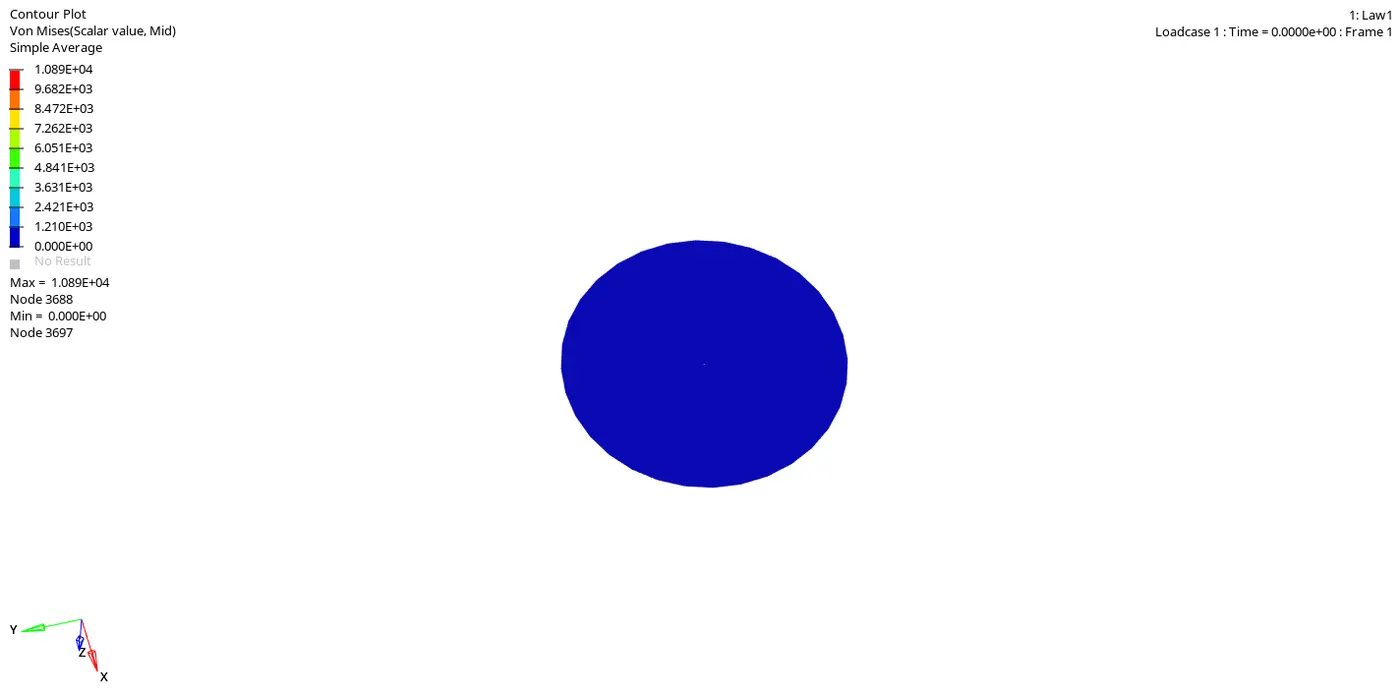
- Using the Hyperview, contour plot for von mises stress is plotted and the animation is shown above:
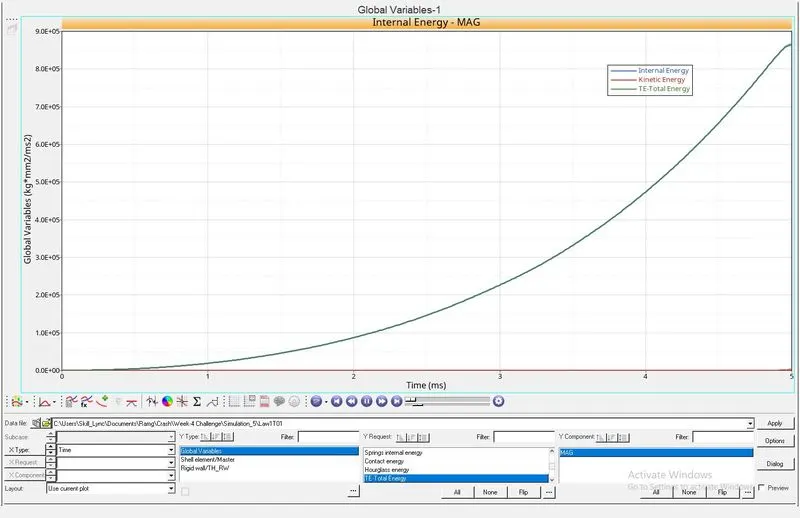
- The internal energy & total energy have a linear increase from the beginning. At the ending of the analysis, it starts to stabilize but as the analysis is ending at 5 ms the curve has stopped abruptly.
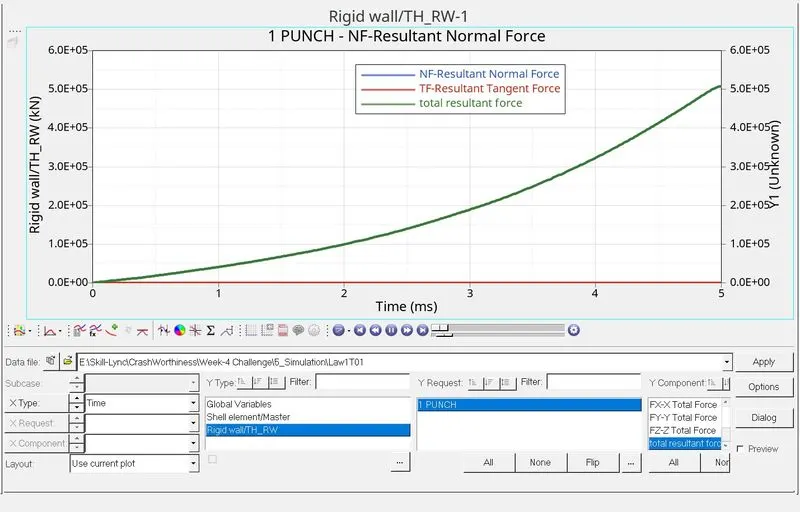
- The total resultant force also increases with less steepness.
Case-6:
- The Model is imported using the rad file.
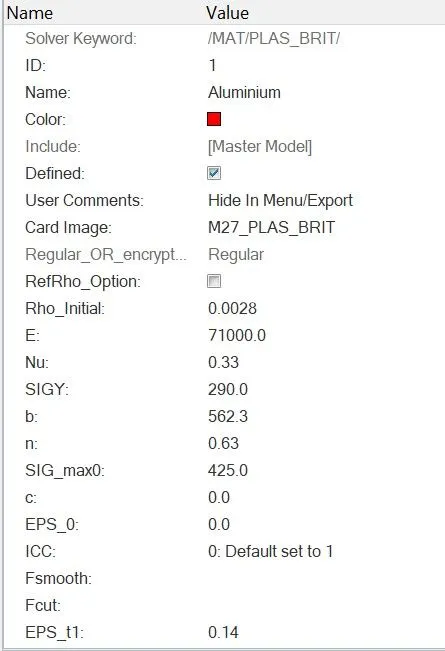
- The material card is assigned according to the given data.
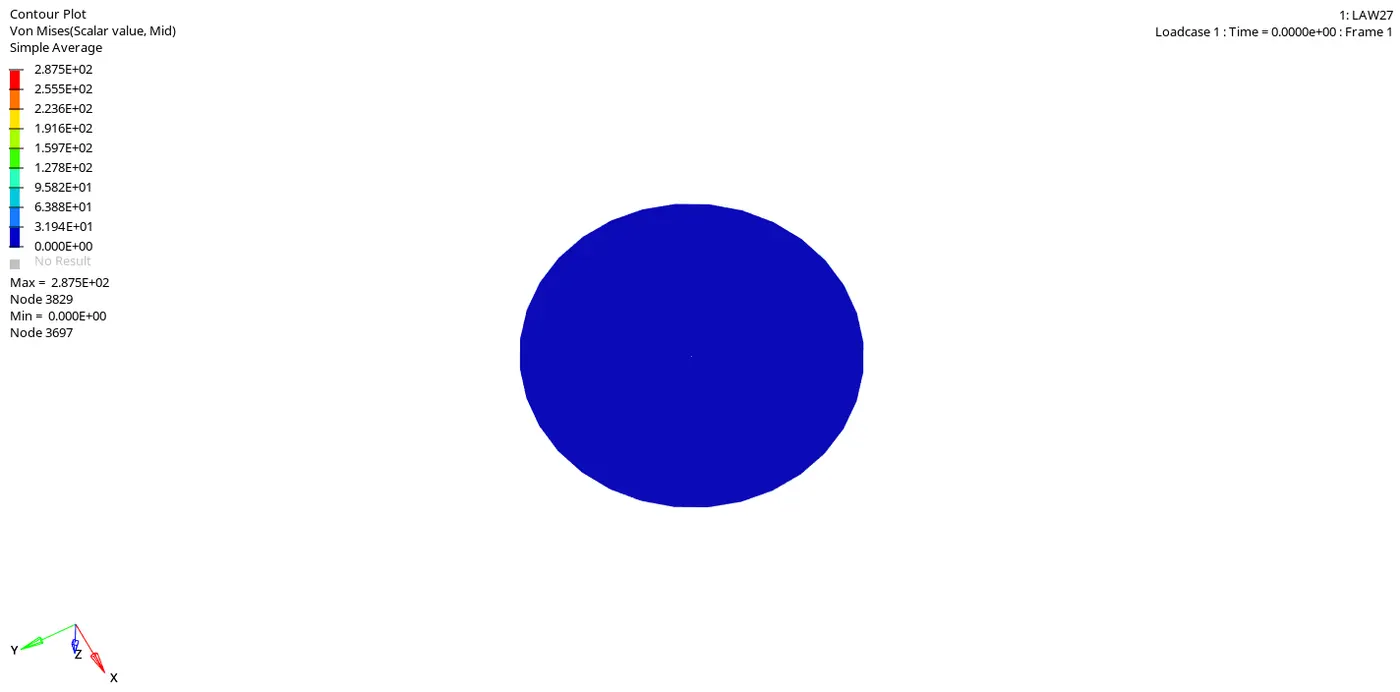
- Using the Hyperview, contour plot for von mises stress is plotted and the animation is shown above:
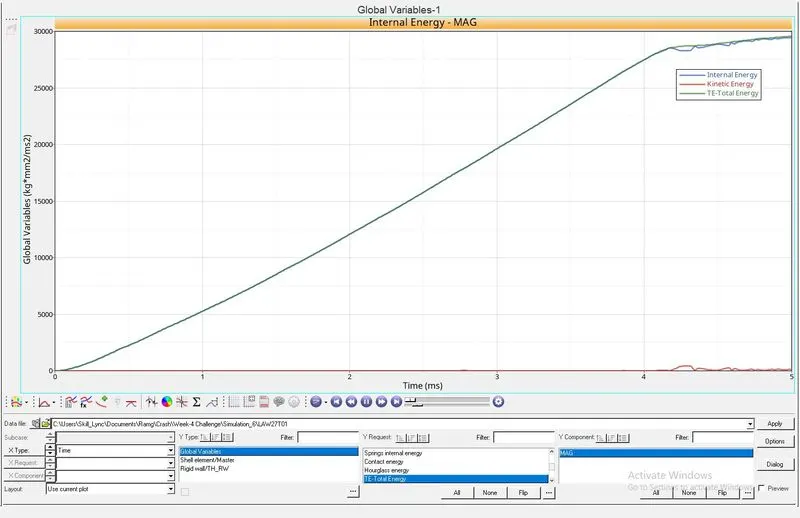
- The Kinetic energy is zero up to 4ms after that it is slightly fluctuating and return to zero.
- The internal energy increases steadily from the initial stage and then it also slightly fluctuates from 4.2 ms up to 5ms.
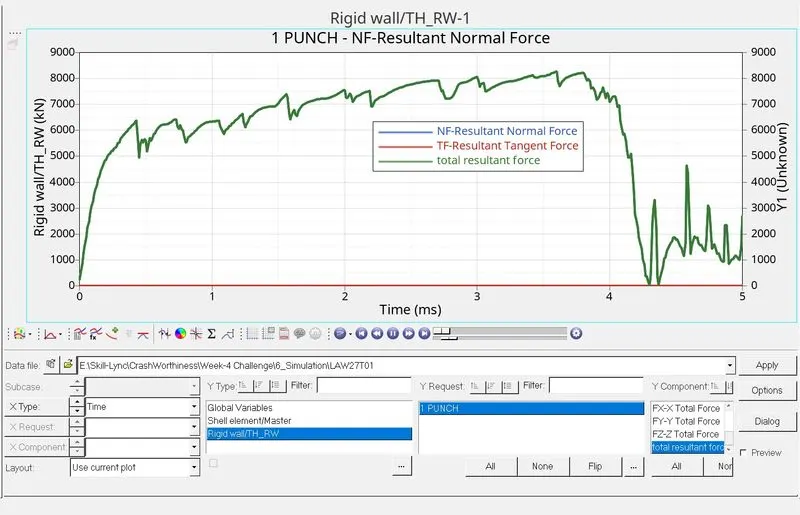
- In the rigid wall forces plot, the resultant tangent force is zero throughout the analysis. The total resultant force as in other cases sees a steep increase up to 6.4 kN. Then there is a decrease.
- Afterward, there is a continuous rise and falls in the curve. After 4 ms, the fall steepens and reaches almost zero. After that, again there is a steep increase & decrease from thereon. The curve abruptly stops at 5 ms as the analysis ends.
Case-7:
- The Model is imported using the rad file.
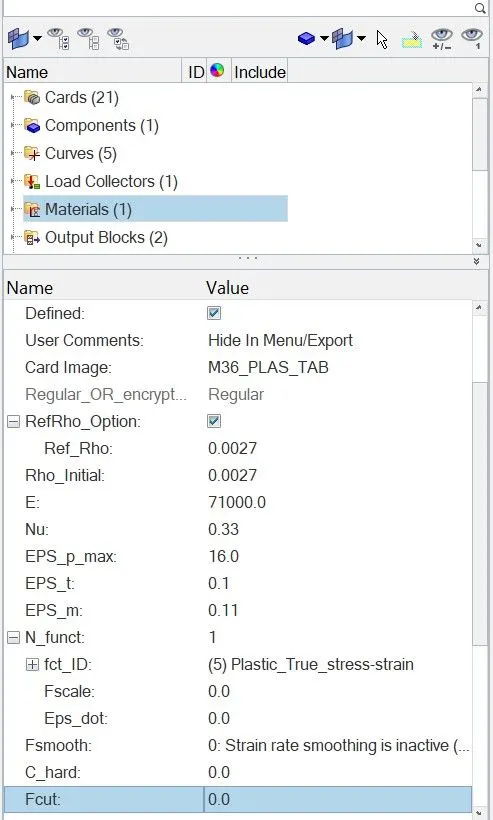
- The material card is changed to Mat36.
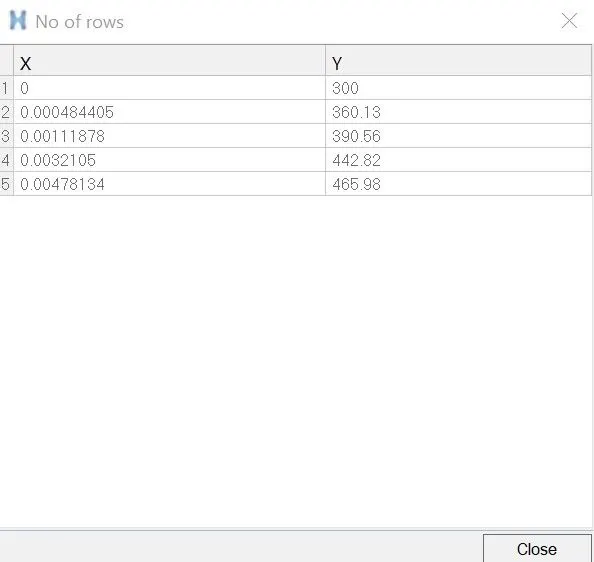
- Then under the curves card, the new curve is created using the given coordinates.
- After this, the curve is assigned to the materials card.
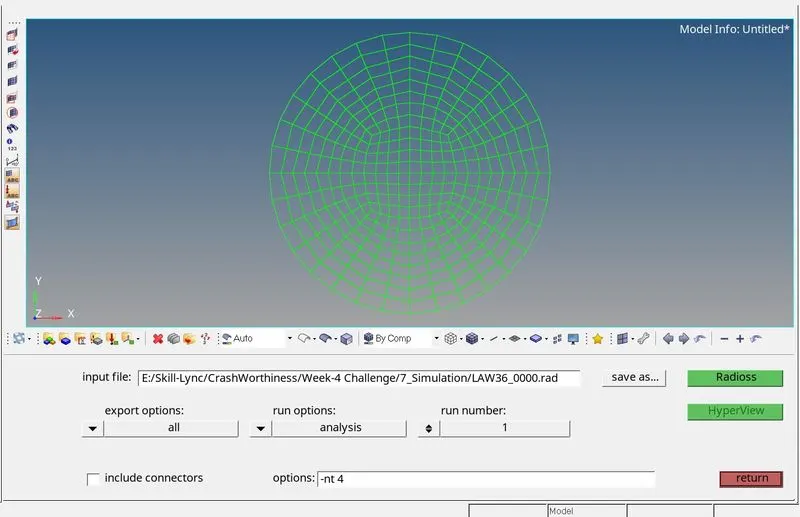
- The simulation is run using the output name is saved as Law36.
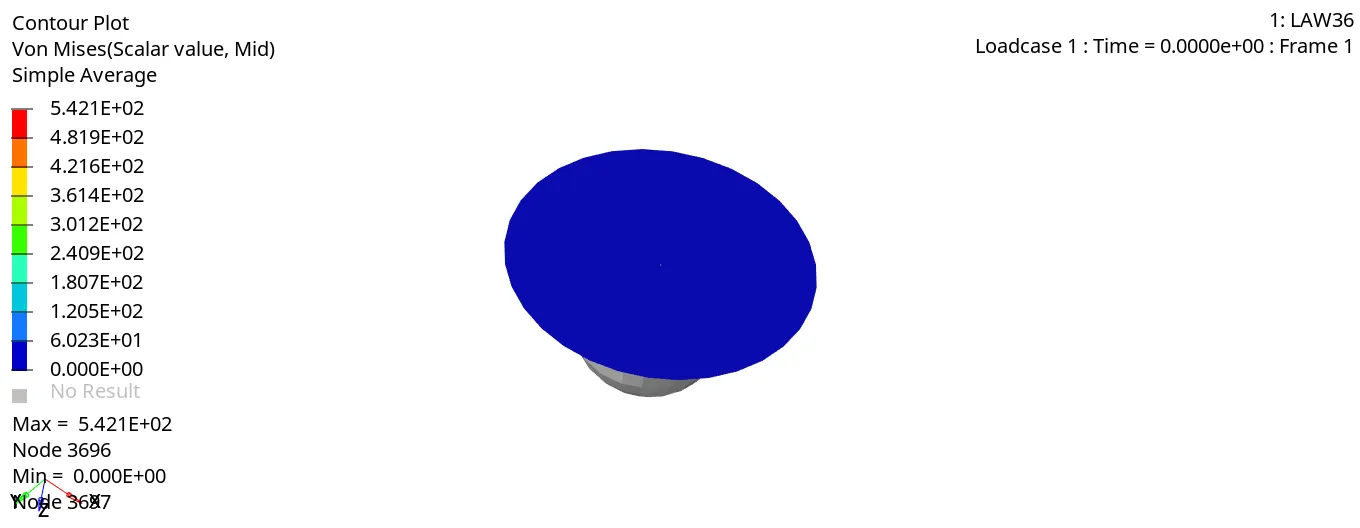
- Using the Hyperview, contour plot for von mises stress is plotted and the animation is shown above:
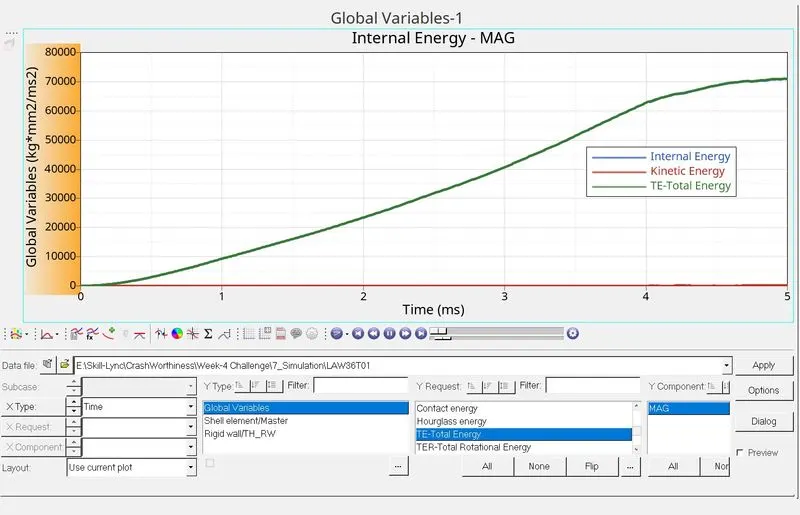
- Based on the energy graph, we can see that there is a higher amount of internal energy in the model and when the elements in the model fail or break, the slope for internal energy and total energy bends towards the x-axis but increases again at the end.
- This is the reason why we can see the PUNCH component getting displaced during the final stages of failure.
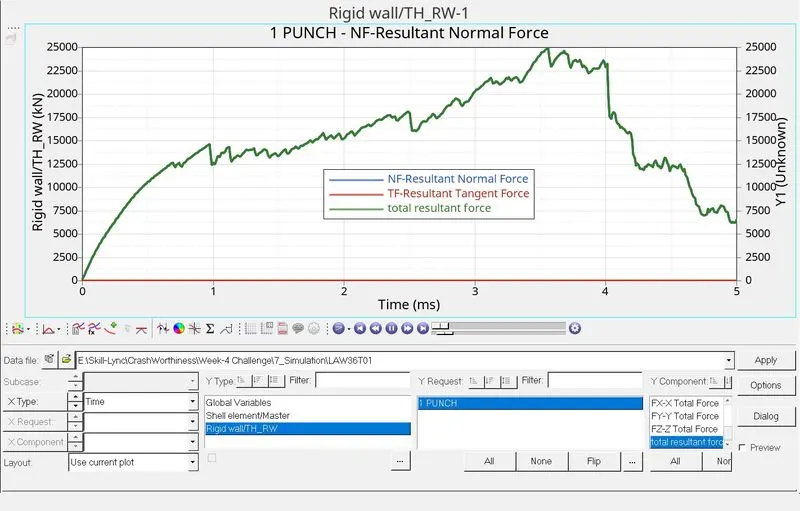
- The total resultant force gradually increases up to 0.8 ms and then it fluctuates.
- The resultant tangent force is zero throughout the simulation.
- The force, in this case, is high as compared to other cases since it is lab test data provided for the stress & strain values, plastic failure strain & other parameters.
For all cases the number of cycles, Energy error, Mass error, and simulation time is compared as follows:
| Case | No of Cycles | Energy Error | Mass Error | Simulation Time(s) |
| 1 | 49380 | -0.6 to 1.3% | 0.0% | 102.68 |
| 2 | 49217 | -1.1 to 5.9% | 0.0% | 127.50 |
| 3 | 49408 | -0.6 to 1.2% | 0.0% | 111.40 |
| 4 | 49304 | -0.6 to 1.2% | 0.0% | 117.26 |
| 5 | 47969 | -0.6 to 4.0% | 0.0% | 110.0 |
| 6 | 49508 | -0.6 to 1.1% | 0.0% | 115.87 |
| 7 | 40981 | -3.3 to 0.9% | 0.0% | 95.89 |
Conclusions:
- In case-1, the maximum energy absorbed by the material 28000 Kgmm2/ms2.
- In case-2, the maximum energy absorbed by the material increases to around 30500. Since Ifail_sh, Dadv, and Ixfem value is defined the plastic deformation occurs in correspondence to the value.
- In case-3, the maximum energy absorbed by the material is around 28000 Kgmm2/ms2, and the elements are deleted in unrealistic form.
- In case-4, the maximum energy absorbed by the material is around 40000 Kgmm2/ms2 since the eps_max value is deleted the material will act as a plastic material and it is not ruptured and more stress is produced on the material.
- In case-5, the maximum energy absorbed by the material is around 8500 since law 1 is applied the material will act as elastic material and the difference between case-4 & case-5 is that in case-4 the material will act as plastic hardening due to more stress is applied whereas in case-5 the material will act as an elastic material.
- In case-6, the maximum energy absorbed by the material 28000 Kgmm2/ms2. since it's a brittle material it absorbs more energy before it breaks.
- In case-7, the maximum energy absorbed by the material 70000 Kgmm2/ms2, the M36 material user-defined material.