Assignment 4-RADIOSS Material Laws Challenge
Objective - To perform multiple cases with different material cards and parameters and further compare the results to conclude which case could best represent on-field situtation.
Comparison of all 7 cases based on errors and run time.
|
Case No |
Total No. of Cycles |
Energy Error (%) |
Mass Error |
Simulation Time (s) |
|
Case 1 – Law2_epsmax_failure |
49380 |
1.3% |
0 |
250.48 s |
|
Case 2 – Law2_epsmax_crack |
49217 |
5.9% |
0 |
262.59 s |
|
Case 3 – Law2_epsmax_nofail |
49408 |
1.2% |
0 |
228.24 s |
|
Case 4 – Law2 |
49304 |
1.2% |
0 |
77.47 s |
|
Case 5 – Law1 |
47969 |
4% |
0 |
73.71 s |
|
Case 6 – Law27 |
49508 |
1.1% |
0 |
79.58 s |
|
Case 7 – Law36 |
52967 |
1.2% |
0 |
96.13 s |
Based on energy error – Ideally energy error should be close to 0%, but an error of 1%-2% is acceptable. Otherwise any positive error means energy has been created which indicates a model issue.
Hence, it could be concluded parameters considered for cases 2 and 5 do not represent realistic conditions.
Case 01 – Law2_epsmax_failure
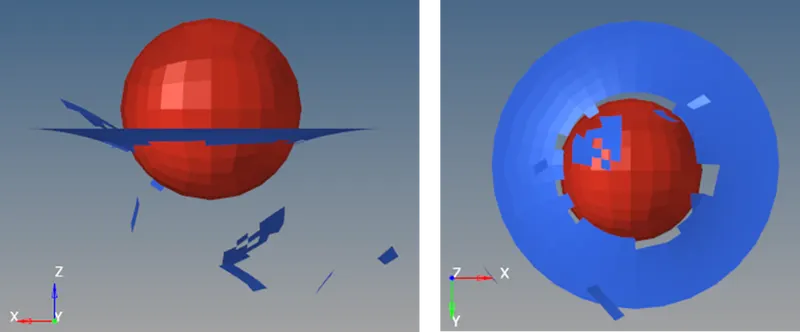
In the above images it could be seen most elements gets deleted and some elements flies out from their respective location. Energy is lost with deleted elements, hence this model cannot represent real life scenario.
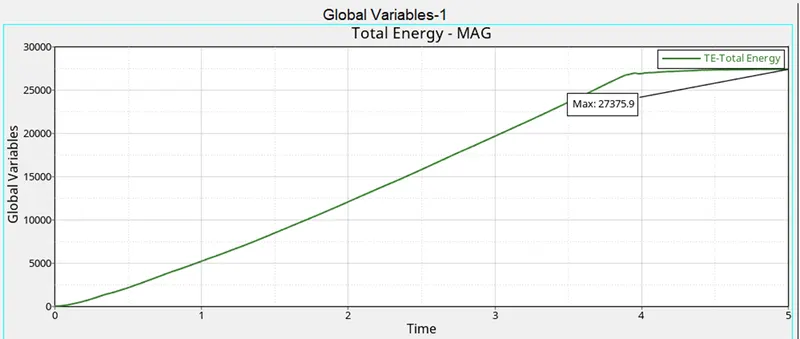
Internal Energy increases with time upto the point of failure. With deletion of elements energy is lost.
Case 02 – Law2_epsmax_crack
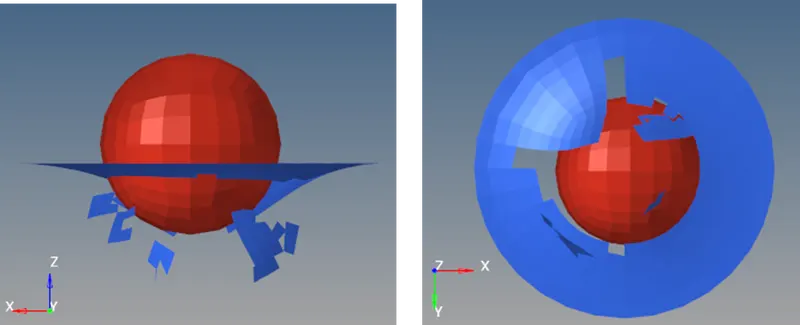
In the above images it could be seen less elements gets deleted as compared to Case -01 and most elements flies out from their respective location. Energy is lost with deleted elements, hence this model cannot represent real life scenario.
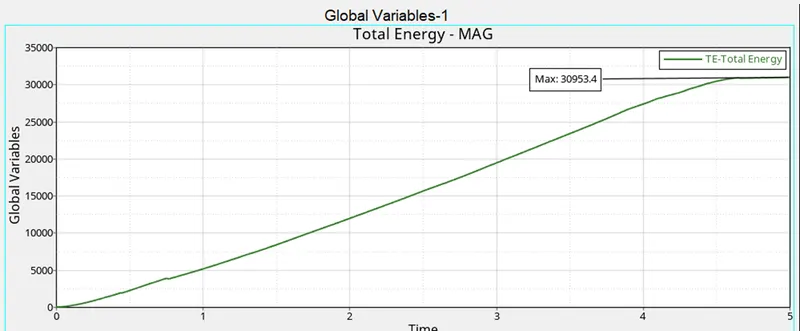
Internal Energy increases with time upto the point of failure. With deletion of elements energy is lost.
Case 03 – Law2_epsmax_nofail
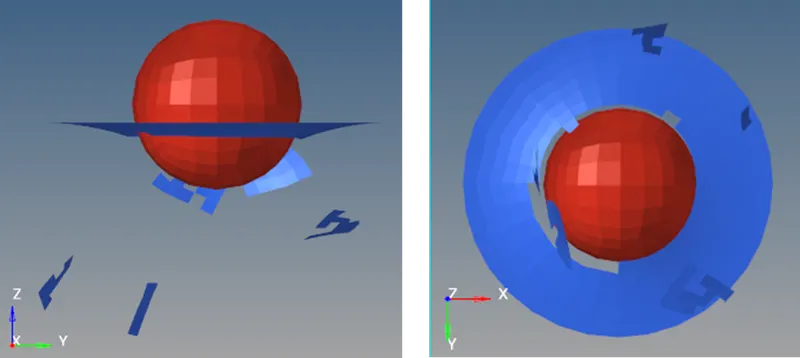
In the above images it could be seen maximum elements gets deleted as compared to Case -01 and Case -02 and few elements flies out from their respective location. Energy is lost with deleted elements, hence this model cannot represent real life scenario.
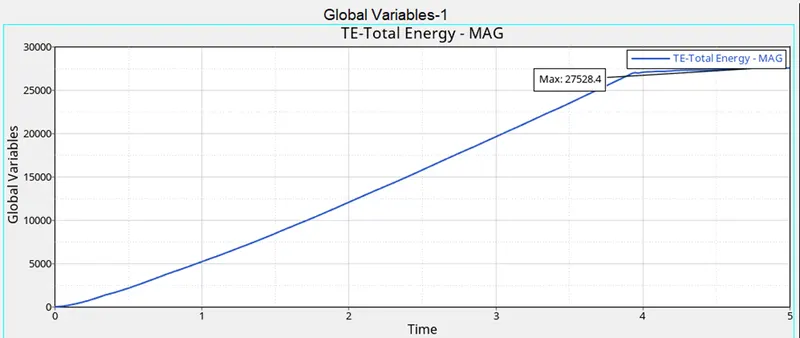
Internal Energy increases with time upto the point of failure. With deletion of elements energy is lost.
Case 04 – Law2
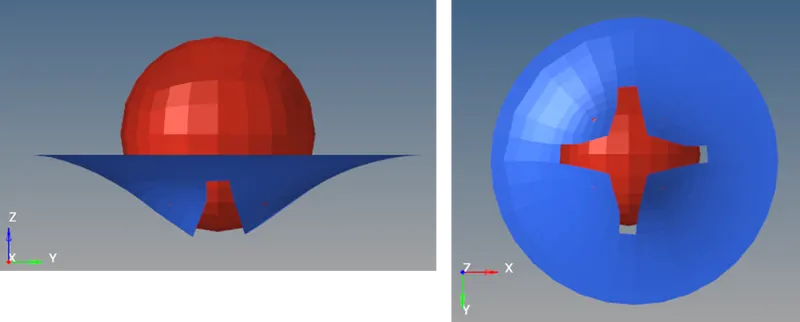
In the above images it could be seen no elements gets deleted, instead a crack is generated at the center of the wall and elements gets displaced and spreads out from their respective location. Since no energy is lost in deleting elements this model can represent real life scenario.
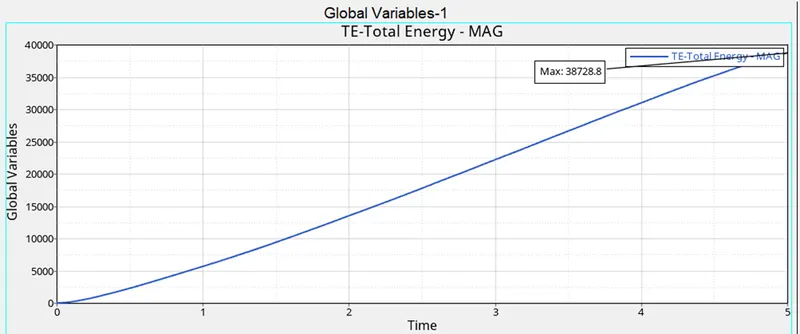
Internal Energy increases with time upto the point of failure. But since elements are cracked and not deleted, internal energy remains within the component.
Case 05 – Law1
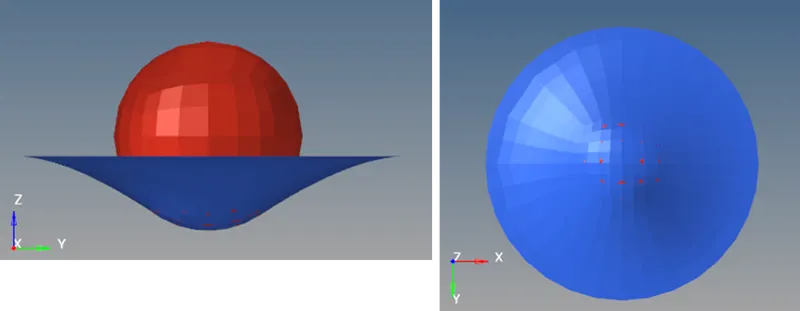
In the above images it could be seen no elements gets deleted and also no crack is generated. As elastic material is used for the wall no energy is lost in deleting elements, this model can represent real life scenario.
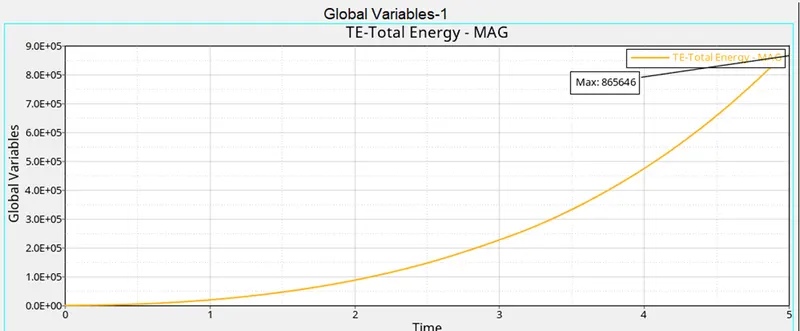
Since material is elastic. Internal energy keeps on increasing with time and applied load.
Case 06– Law27
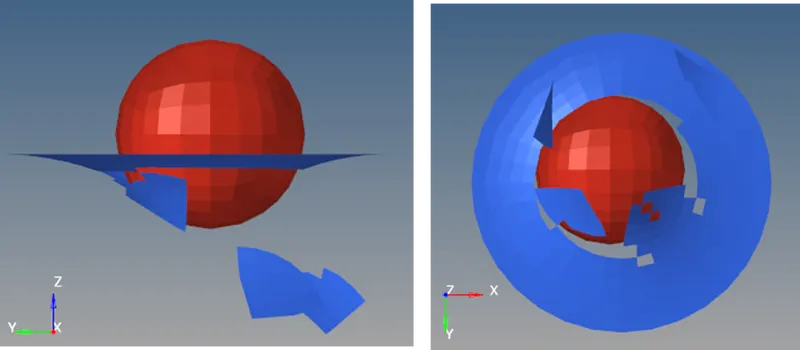
In the above images it could be seen very few elements gets deleted and a crack is generated at the center of the wall and elements gets displaced and spreads out from their respective location. Energy is lost with deleted elements, hence this model cannot represent real life scenario.
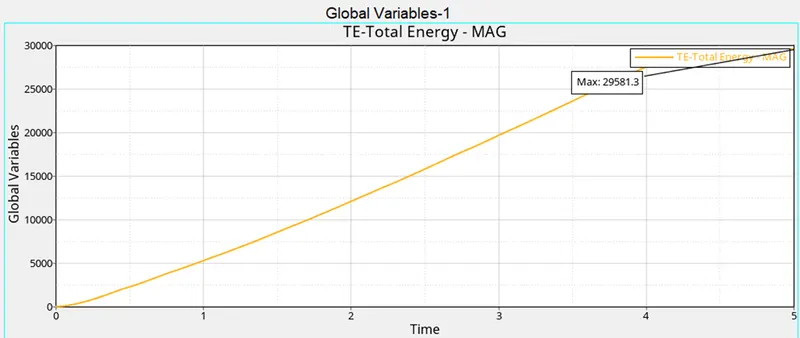
Internal Energy increases with time upto the point of failure. With deletion of elements energy is lost.
Case 07– Law36
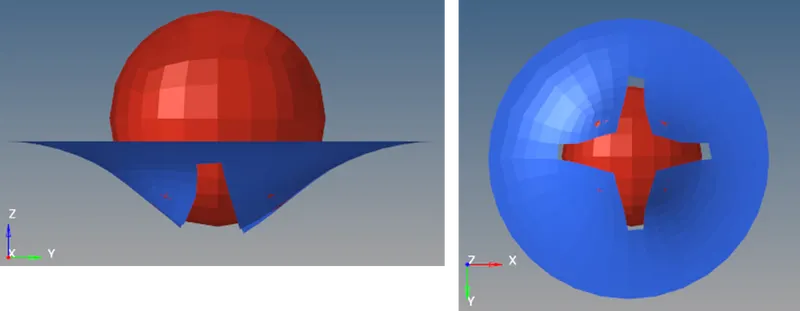
In the above images it could be seen no elements gets deleted, instead a crack is generated at the center of the wall and elements gets displaced and spreads out from their respective location. Since, no energy is lost in deleting elements, this model can represent real life scenario.
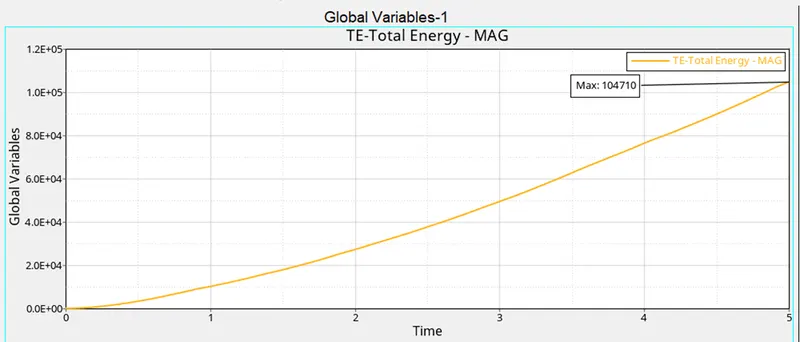
Internal Energy increases with time upto the point of failure. But since elements are cracked and not deleted, internal energy remains within the component.
Conclusion - Based on all above results it could be concluded Case 4 and Case 6 could represent on-field scenario as failure happens but elements do not get deleted and energy is not lost instead retained within the system.