Assignment 4
1.Compare SI vs CI and list down differences (assignment no 2-SI)
Theory
| SI Engine | CI Engine |
| During the intake or suction process, air and fuel are brought inside engine (mpfi) | During the intake or suction process, only air alone is sucked inside engine cylinder |
| The fuel used Gasoline , LPG, CNG which is highly volatile. Self Ignition temperature is high. | The fuel used Diesel which is low volatile. Self-ignition temperature is low. |
| Ignition is by Spark Plug | Ignition is by High Pressure Fuel Injection |
| The compression ratio is 6 to 10. The upper limit is fixed by the antiknock quality of the fuel. | The compression ratio is 16 to 20. The upper limit is limited by the weight increase of the engine. |
| Lower thermal efficiency because of the low compression ratio. | High thermal efficiency because of the high compression ratio. |
| Quantity Governed engine, Air Fuel ratio is maintained at stoichometric through out the major operating zone | Quality Governed Engine, Air/Fuel ratio is varied from very high value of 100 to a minmum value19, Correspondingly engine load is varied from no load to full Load |
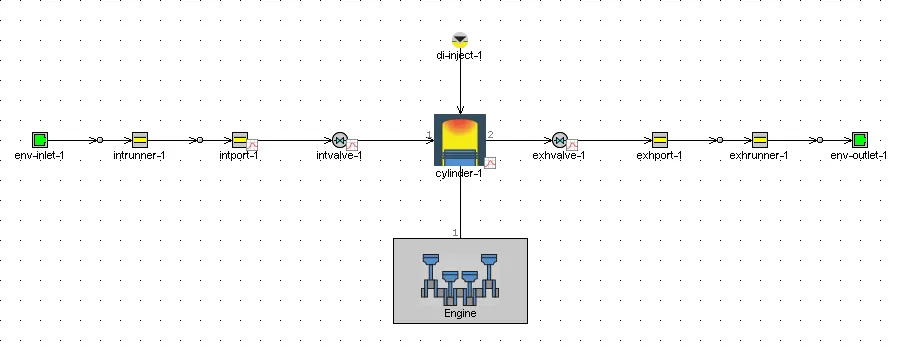
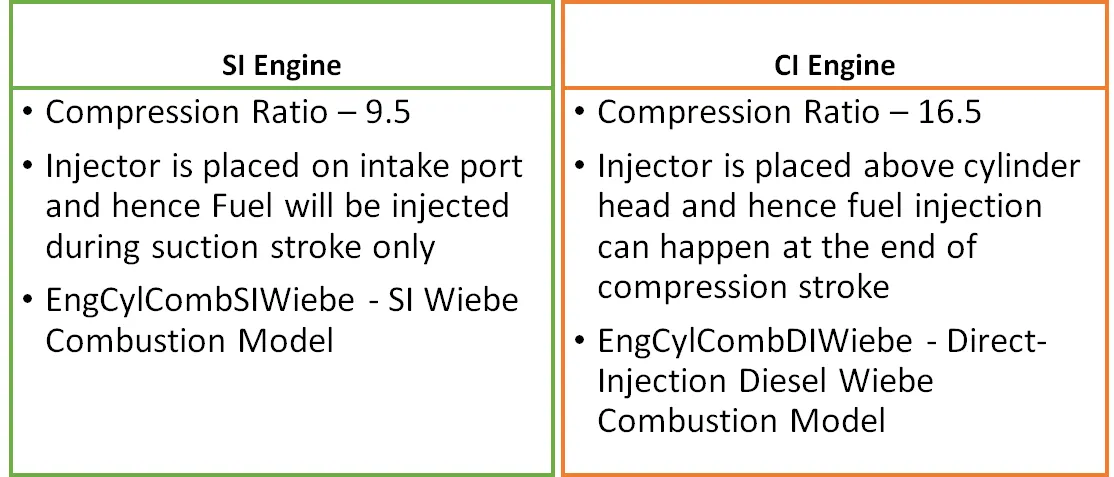
Given CI Engine Model
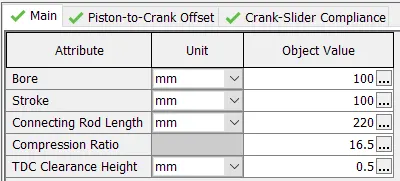
Engine Specification
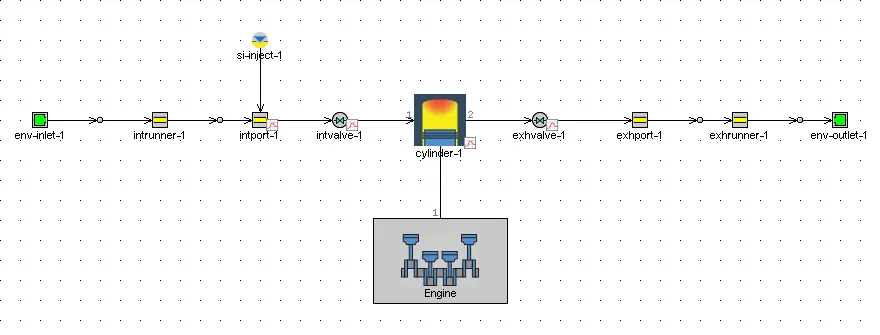
SI Engine Model
Engine Specification
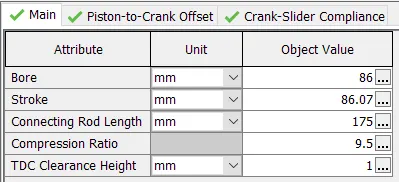
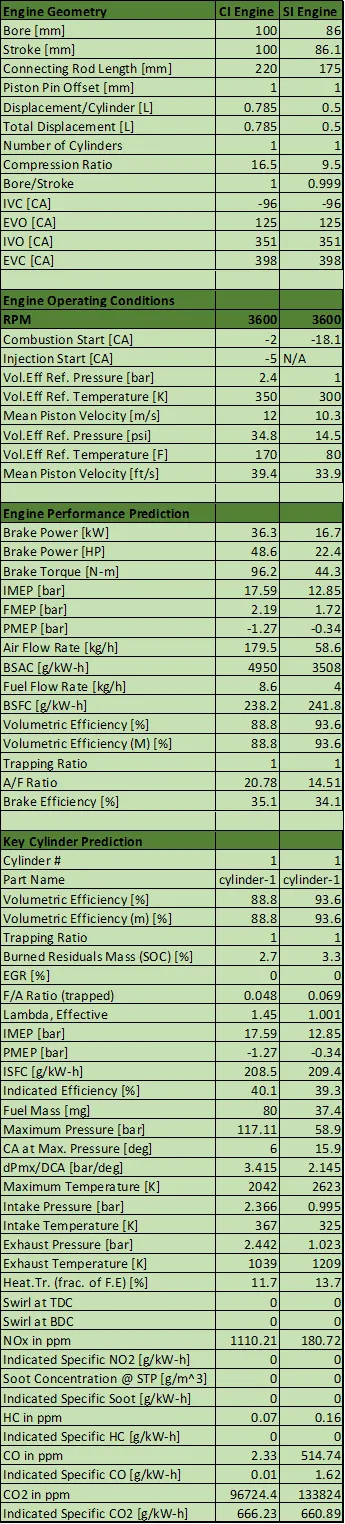
Given Engine Major Comparisons to be Observed apart from Engine Geometry
Complete List of Comparisons were shown below
2. Comment on BSFC , Exhaust Temperature, A/F ratios
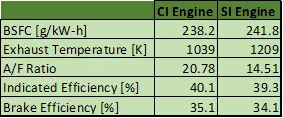
Since, CI Engine is operating at leaner A/F ratio, It is thermally efficient and hence lower bsfc
Also leaner A/F ratio and its combustion chemistry makes the Exhaust temperature lower
3.Change MFB 50 and observe impact on performance
In CI Engines, MFB 50 can be changed by following means
1. Advancing the Main Injection Timing --> Advances MFB 50
2. Increasing the Rail Pressure --> Reduces Combustion duration and therby advances the combustion (MFB50)
3. Adding EGR Retards the Combustion centre --> Retards MFB 50
4. Increasing Boost Pressure, Advances the combustion --> Advances MFB 50
In this Challenges only 1st & 2nd Options are tried out
Advancing the Main Injection Timing --> Advances MFB 50
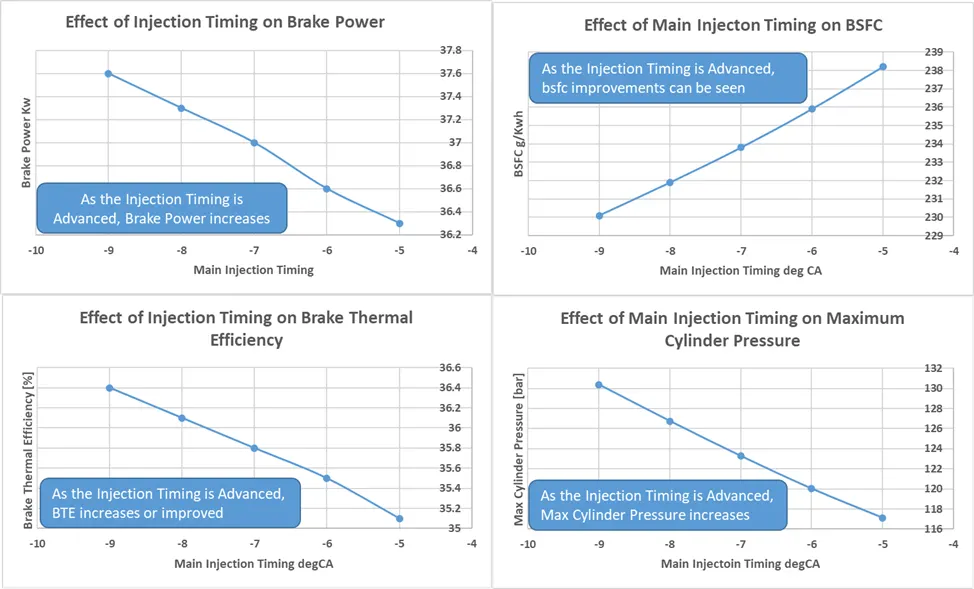
In this simulation, MFB 50 was advanced by advancing Main Injection Timing and following are the inferences

Main Injection Timing was advanced from -5deg CA to -9 degCA, Following are the inferences,
| RPM | 3600 | 3600 | 3600 | 3600 | 3600 |
| Fuel Mass [mg] | 80 | 80 | 80 | 80 | 80 |
| Injection Start [CA] | -5 | -6 | -7 | -8 | -9 |
| Combustion Start [CA] | -2 | -3 | -4 | -5 | -6 |
| Brake Power [kW] | 36.3 | 36.6 | 37 | 37.3 | 37.6 |
| Brake Torque [N-m] | 96.2 | 97.1 | 98 | 98.8 | 99.6 |
| IMEP [bar] | 17.59 | 17.75 | 17.91 | 18.06 | 18.2 |
| FMEP [bar] | 2.19 | 2.21 | 2.23 | 2.24 | 2.26 |
| PMEP [bar] | -1.27 | -1.27 | -1.26 | -1.26 | -1.26 |
| Air Flow Rate [kg/h] | 179.5 | 179.5 | 179.5 | 179.5 | 179.5 |
| BSAC [g/kW-h] | 4950 | 4902 | 4858 | 4817 | 4780 |
| Fuel Flow Rate [kg/h] | 8.6 | 8.6 | 8.6 | 8.6 | 8.6 |
| BSFC [g/kW-h] | 238.2 | 235.9 | 233.8 | 231.9 | 230.1 |
| ISFC [g/kW-h] | 208.5 | 206.6 | 204.8 | 203.1 | 201.5 |
| Brake Efficiency [%] | 35.1 | 35.5 | 35.8 | 36.1 | 36.4 |
| Indicated Efficiency [%] | 40.1 | 40.5 | 40.9 | 41.2 | 41.5 |
| Maximum Pressure [bar] | 117.11 | 120.01 | 123.27 | 126.75 | 130.38 |
| CA at Max. Pressure [deg] | 6 | 7 | 8 | 8 | 8 |
| dPmx/DCA [bar/deg] | 3.415 | 3.415 | 3.415 | 3.416 | 3.52 |
| Maximum Temperature [K] | 2042 | 2047 | 2052 | 2058 | 2064 |
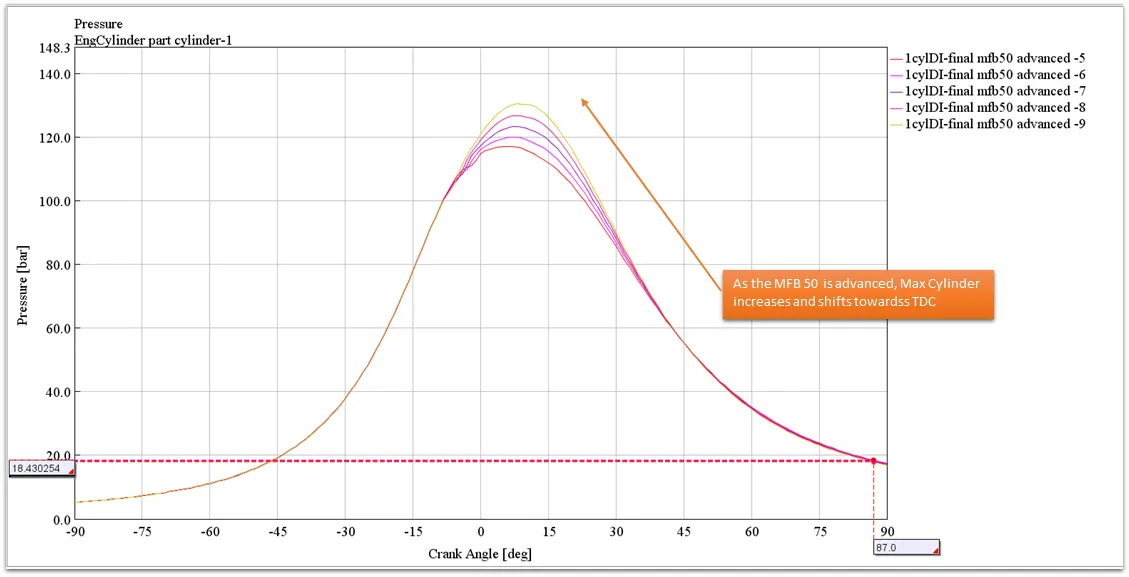
Increasing the Rail Pressure --> Reduces Combustion duration and there by advances the combustion (MFB50)
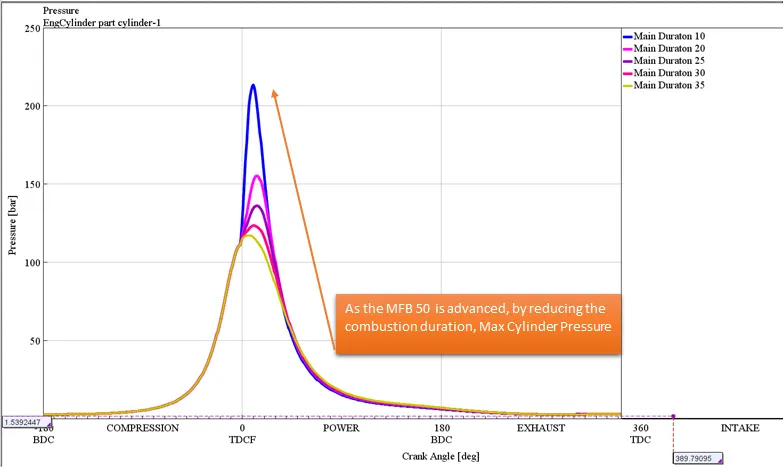
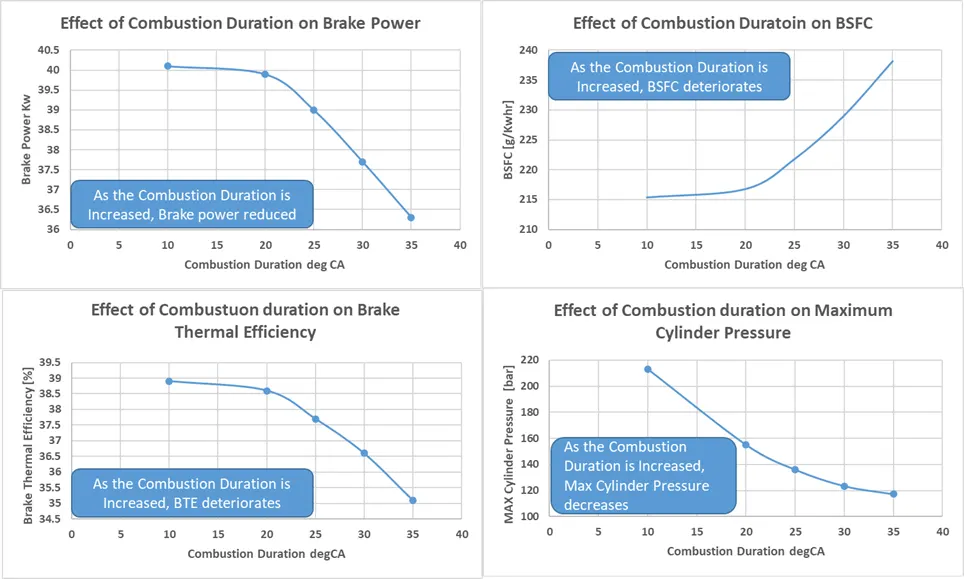
In this simulation, MFB 50 was advanced by Reducing Main Combustion duration which is possible in the real time by increasing the Injection Pressure.
Case Set up
Main Combustion Duration was reduced from 35deg CA to 10 deg CA

Inferences
| RPM | 3600 | 3600 | 3600 | 3600 | 3600 |
| Combustion Start [CA] | -2 | -2 | -2 | -2 | -2 |
| Injection Start [CA] | -5 | -5 | -5 | -5 | -5 |
| Main Duration (10-90%) | 10 | 20 | 25 | 30 | 35 |
| Brake Power [kW] | 40.1 | 39.9 | 39 | 37.7 | 36.3 |
| Brake Torque [N-m] | 106.4 | 105.7 | 103.3 | 100.1 | 96.2 |
| IMEP [bar] | 19.7 | 19.3 | 18.82 | 18.24 | 17.59 |
| FMEP [bar] | 2.68 | 2.39 | 2.29 | 2.23 | 2.19 |
| PMEP [bar] | -1.22 | -1.24 | -1.25 | -1.26 | -1.27 |
| Air Flow Rate [kg/h] | 179.4 | 179.4 | 179.5 | 179.5 | 179.5 |
| BSAC [g/kW-h] | 4472 | 4502 | 4607 | 4758 | 4950 |
| Fuel Flow Rate [kg/h] | 8.6 | 8.6 | 8.6 | 8.6 | 8.6 |
| BSFC [g/kW-h] | 215.4 | 216.8 | 221.8 | 229 | 238.2 |
| Brake Efficiency [%] | 38.9 | 38.6 | 37.7 | 36.6 | 35.1 |
| Lambda, Effective | 1.449 | 1.449 | 1.45 | 1.45 | 1.45 |
| IMEP [bar] | 19.7 | 19.3 | 18.82 | 18.24 | 17.59 |
| PMEP [bar] | -1.22 | -1.24 | -1.25 | -1.26 | -1.27 |
| ISFC [g/kW-h] | 186.2 | 190 | 194.8 | 201.1 | 208.5 |
| Indicated Efficiency [%] | 45 | 44.1 | 43 | 41.6 | 40.1 |
| Fuel Mass [mg] | 80 | 80 | 80 | 80 | 80 |
| Maximum Pressure [bar] | 213.25 | 155.17 | 136.04 | 123.38 | 117.11 |
| CA at Max. Pressure [deg] | 10 | 14 | 14 | 11 | 6 |
| dPmx/DCA [bar/deg] | 13.957 | 4.068 | 3.416 | 3.416 | 3.415 |
| Maximum Temperature [K] | 2449 | 2251 | 2169 | 2100 | 2042 |
| Intake Pressure [bar] | 2.366 | 2.366 | 2.366 | 2.366 | 2.366 |
| Intake Temperature [K] | 368 | 367 | 367 | 367 | 367 |
| Exhaust Pressure [bar] | 2.437 | 2.439 | 2.44 | 2.441 | 2.442 |
| Exhaust Temperature [K] | 924 | 966 | 990 | 1015 | 1039 |
| Heat.Tr. (frac. of F.E) [%] | 16.1 | 13.7 | 12.9 | 12.3 | 11.7 |
| Swirl at TDC | 0 | 0 | 0 | 0 | 0 |
| Swirl at BDC | 0 | 0 | 0 | 0 | 0 |
| NOx in ppm | 1109.12 | 1109.55 | 1109.78 | 1110.02 |
1110.21 |
Nox Emission Increases as the MFB 50 is advanced
Conclusion :
As the MFB 50 was advanced towards TDC, Brake Power increases , Thermal Efficiency is Improved but on the flip side Nox emission is increased