Compare SI vs CI and Study of Non - predictive Combustion Model
Assignment 4
Explore Tutorial No 1- CI final
General Layout
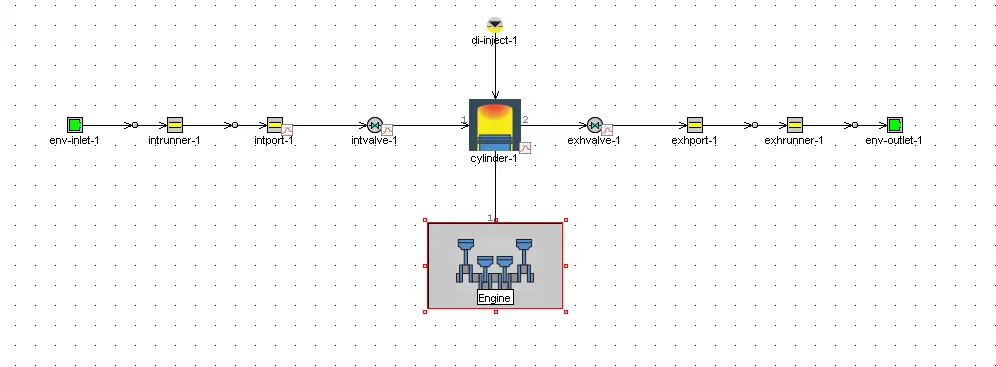
Engine Template
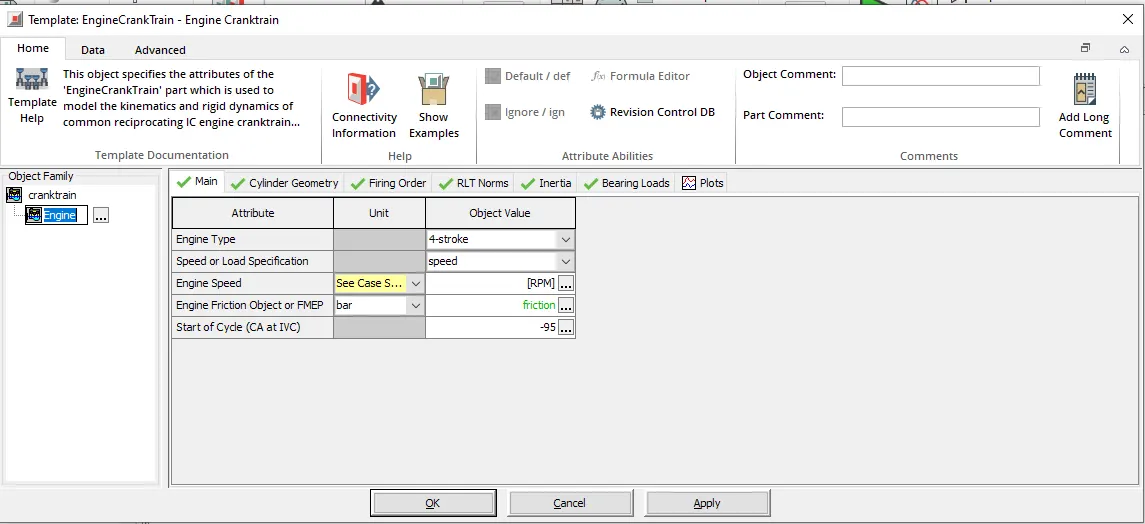
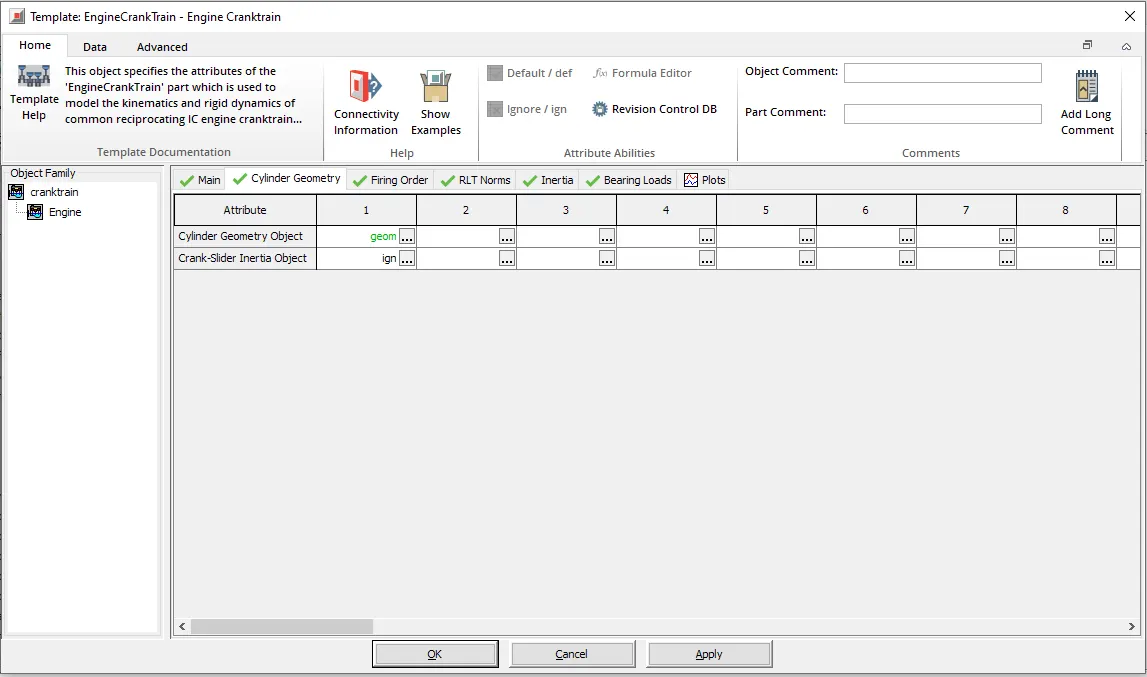
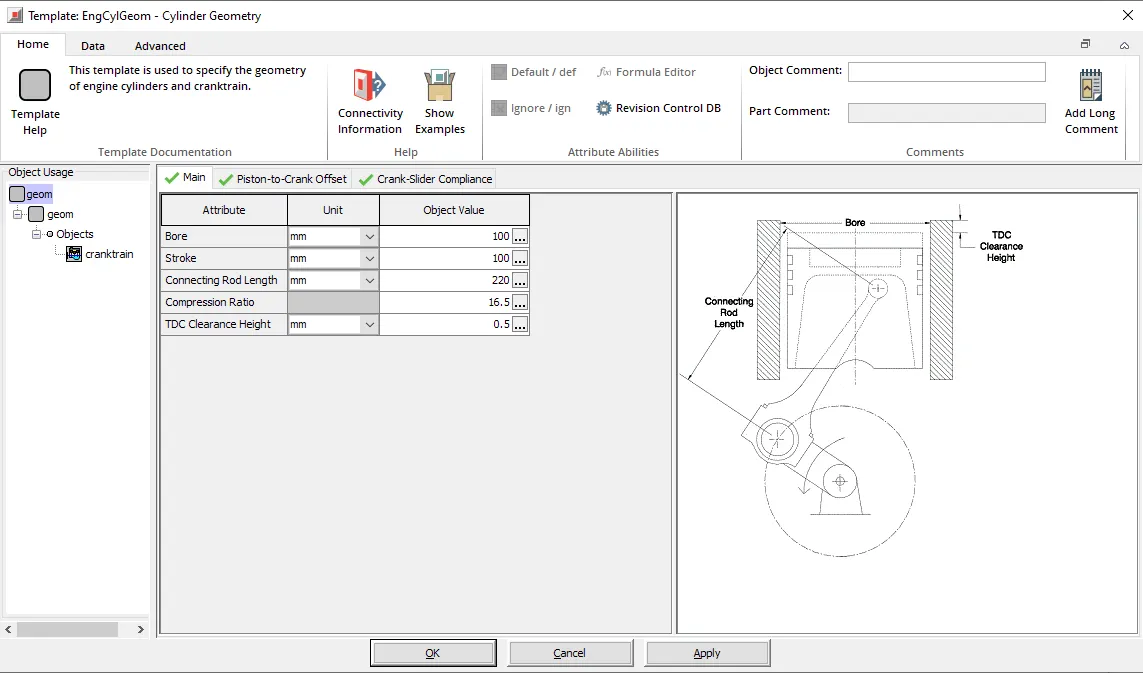
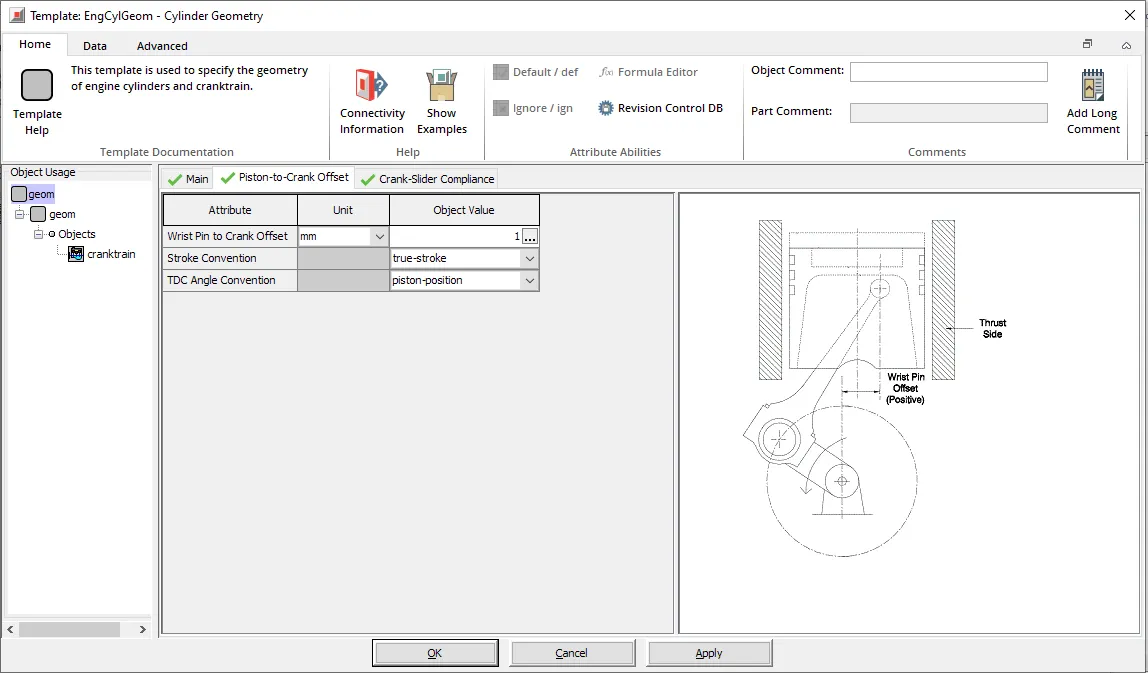
Cylender Template
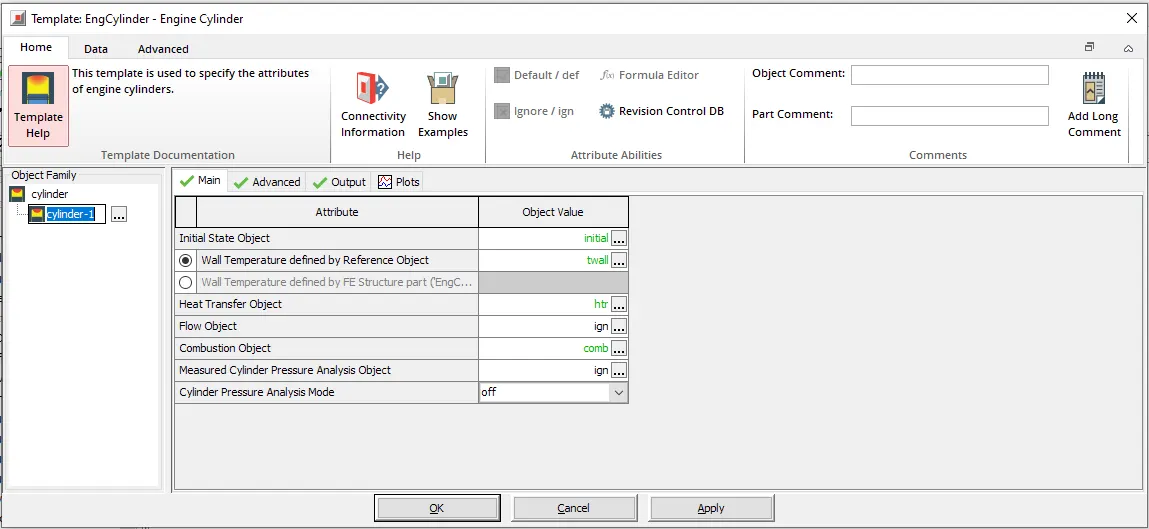
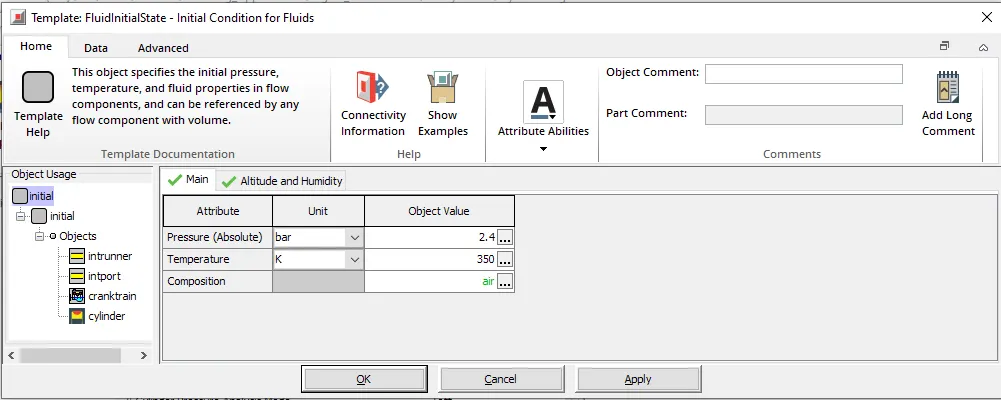
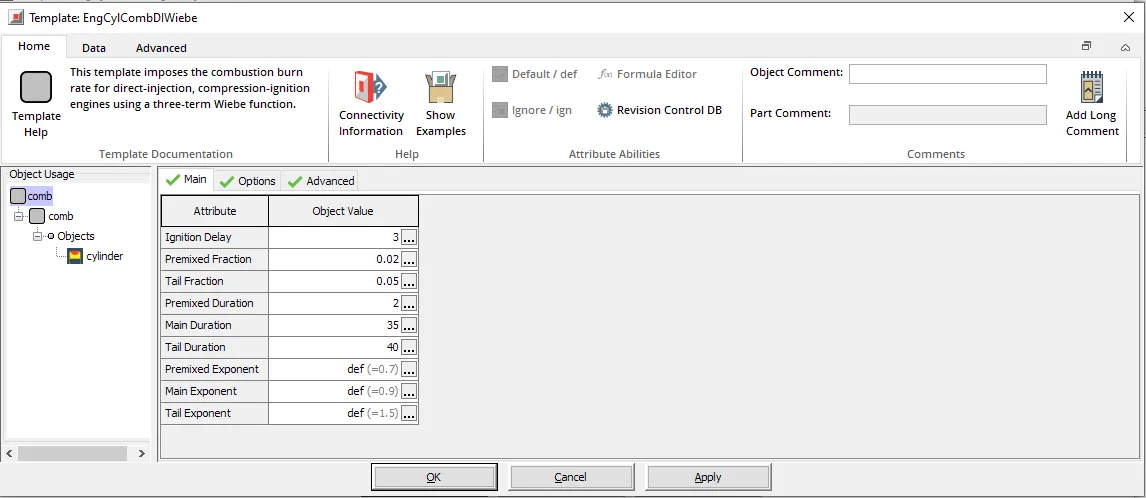
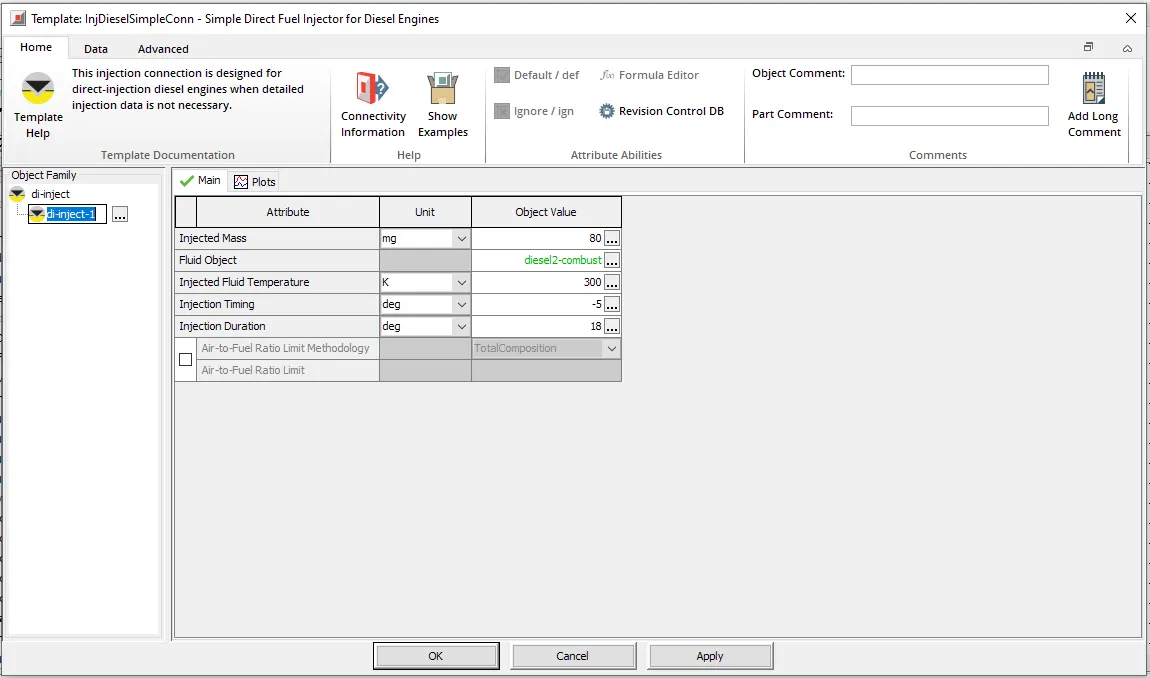
Injector Template
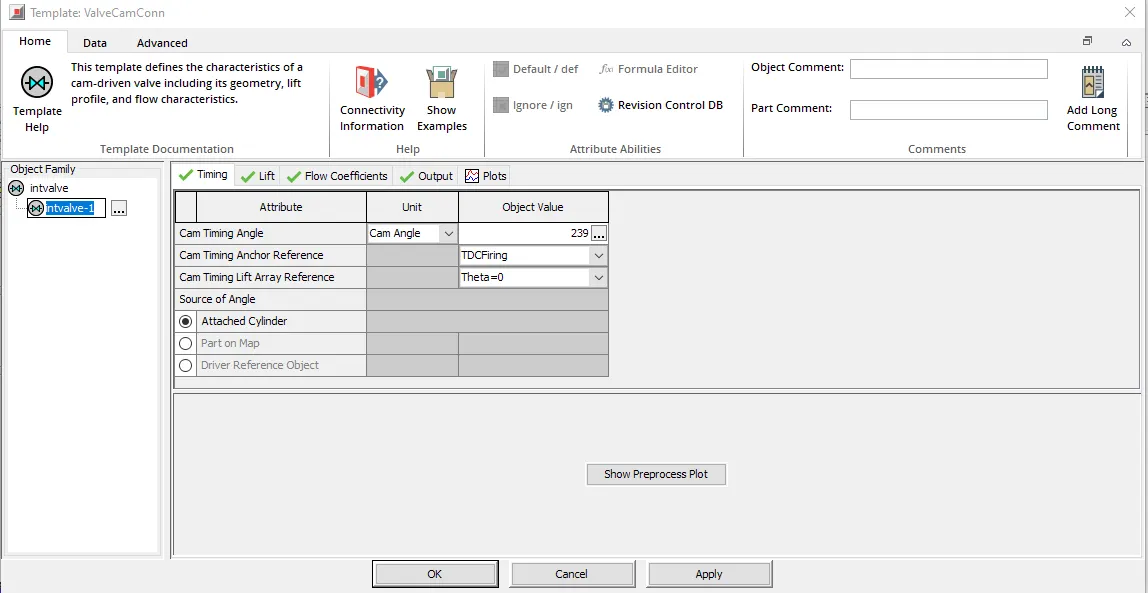
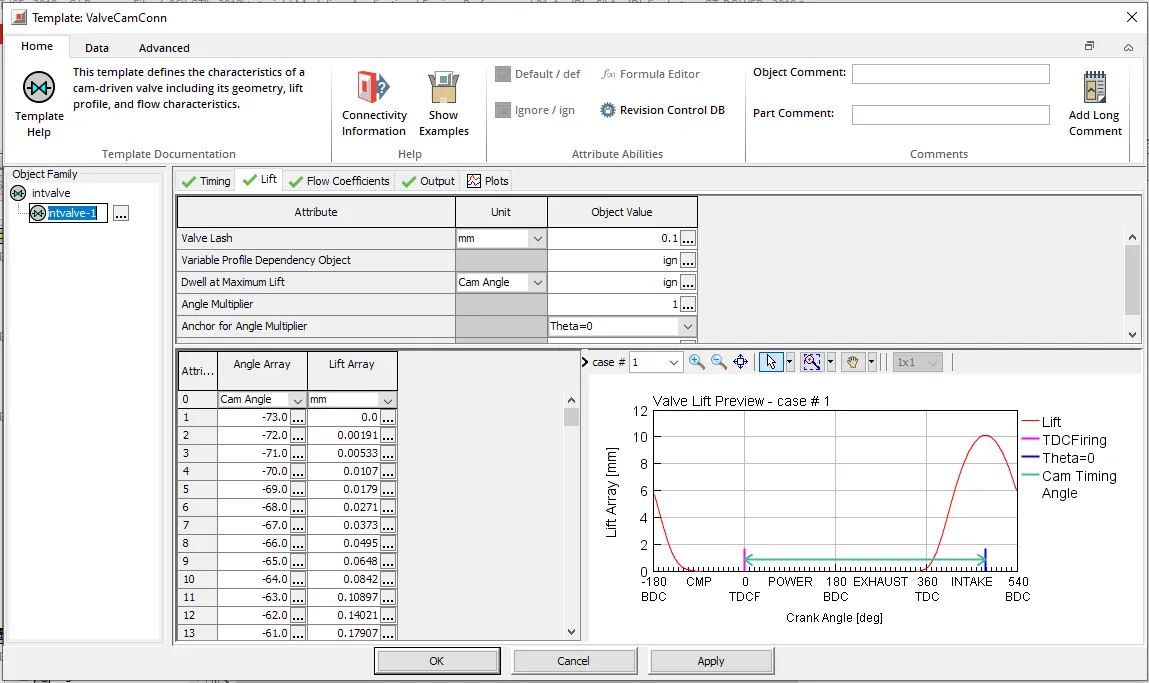
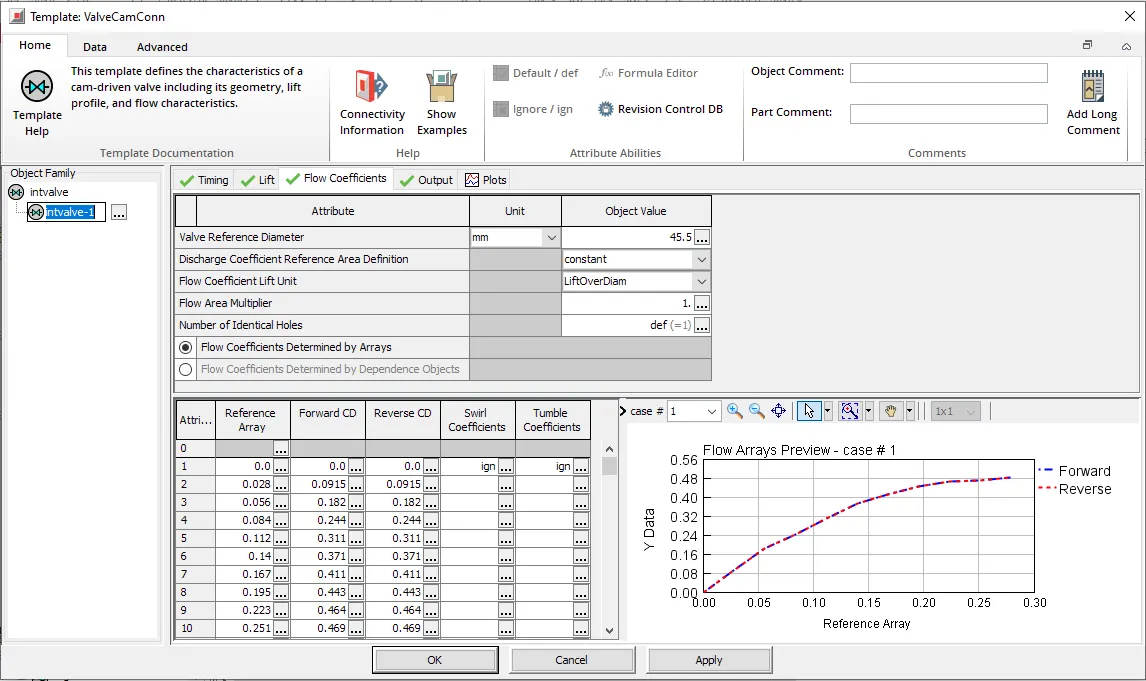
Intake and Exhaust valve template
1. Compare SI vs CI and list down differences (assignment no 2-SI)
SI Engine (Spark Ignition Engine)
- Spark Ignition (SI) Engine is a type of engine in which the combustion takes place by generation of spark using spark plug.
- It uses petrol, LPG (Liquified petroleum gas) and CNG (Compressed natural gas) as fuel and works on Otto cycle. In the spark ignition engine, the air fuel mixture is inserted into the cylinder with help of carburettor or this mixture directly injected using injector.
- It has low compression ratio (9.5-10) as fuel used here is of higher-octane number therefore the fuel is get ignited easily by small spark generated by spark plug. knocking occurs at the end of the combustion due to low compression ratio.
- SI engines can be of high engine speed ranging from 1000 to 8000 rpm and in bikes it can be upto 12000 rpm
- In SI engines NVH (noise vibration and harness) of components is low due to lower pressure conditions in the cylinder compared to CI engines which gives comfort in riding vehicle.
- The A/F mixture is used here is always in a ratio of 14.5 therefore this gives low fuel efficiency in case of petrol as a fuel.
- Emissions due to petrol is CO, HC, NOX whereas LPG and CNG produces low emissions. To control the emissions 3-way catalytic convertor is used.
- They are mostly used in light commercial vehicles such as scooters, motorcycles cars etc.
CI Engine (Compression Ignition Engine)
- Compression Ignition (CI) Engine is an engine in which the combustion of fuel takes place by the heat of the compressed air.
- It uses diesel and bio-diesel as fuel and works on Diesel cycle. In the compressed ignition engine, only air enters into the cylinder during suction stroke there is bowl created to mix air properly with the automize fuel
- It has high compression ratio because of the high ignition temperature of the diesel fuel. diesel has a high cetane number gives the high compression ratio. Due to high compression ratio, it produces more power.
- In CI engines engine low engine speed rang (1000 to 4000 rpm) as compare to SI engine because of high inertia
- In CI engines A/F mixture ratio is used here always greater than 18 therefore this gives high fuel efficiency in case of diesel as a fuel.
- Due to incomplete combustion of the fuel, it produces more CO, HC and Soot and high intake of air NOX produces which lead to air pollution.
- The NVH problem is there higher in the CI engines as compare to SI engines which gives less comfort while driving. The maintenance cost of the CI engine is more as compared with the SI engines.
- They are mostly used in heavy duty vehicles such as buses, trucks, railways, ships etc.
For comparison, lets use the SI engine from assignment 2.
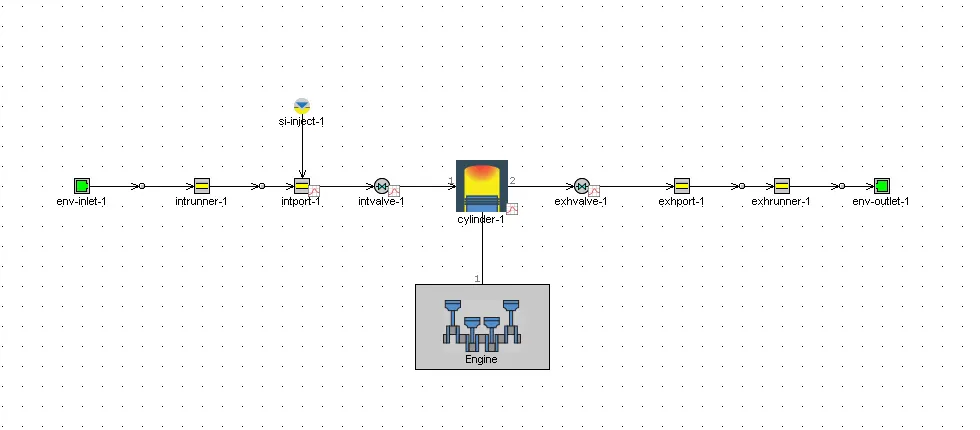
For CI engine, lets take an example file that follows the same non-predictive simulation mechanism as the SI engine.
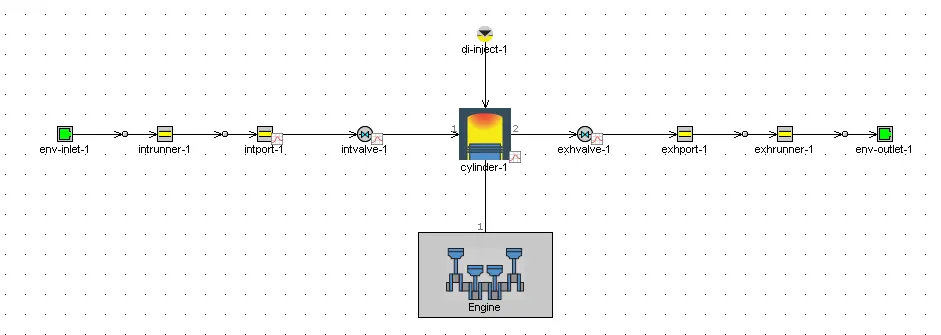
Comments on following parameters
- BSFC
- Exhaust Temperature
- A/F ratios
BSFC: Brake-specific fuel consumption
Generally speaking, when we compare the brake specific fuel consumption(BSFC) for SI and CI engines, the values would be marginally higher for SI engines. This is due to the fact that SI engines operate with a richer air-fuel ratio, compared to CI engines. Compression Ignition engines take a leaner mixture to burn, where the air is more than what the fuel requires..
Exhaust temperatures:
As discussed earlier, CI ignitions have higher compression ratios and hence have higher thermal efficiency and incidentally, higher power output for the same volume of fuel. This translates to higher temperatures in the cylinder and that is why emissions are a huge issue in CI engines. To control the temperatures, we utilize different kinds of mechanisms such as EGR and Liquid cooling. Hence, compared to SI engines, CI engines have higher exhaust temperatures generally.
Air-fuel ratios:
As explained earlier, CI engines operate in leaner mixtures and hence have higher air-fuel ratios compared to SI engines to reduce emissions. Generally, petrol engines strive to have the stoichiometric mixture ratio, at 14.5 and diesel engines operate above 18.
b). Change MFB 50 and observe impact on performance
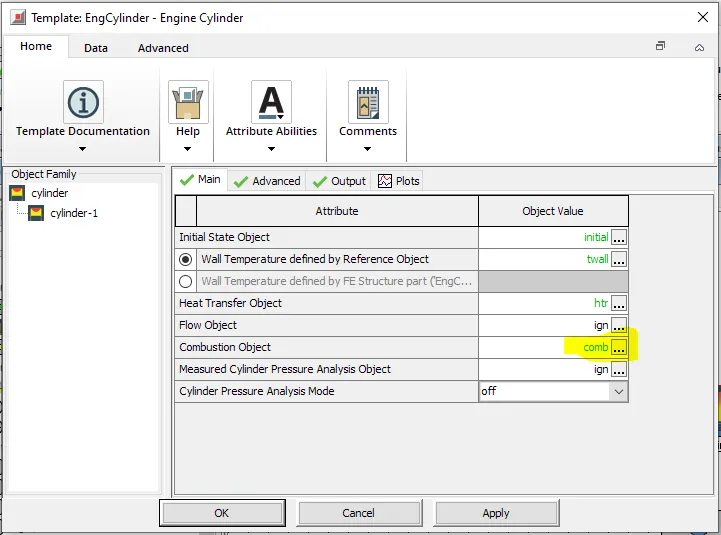
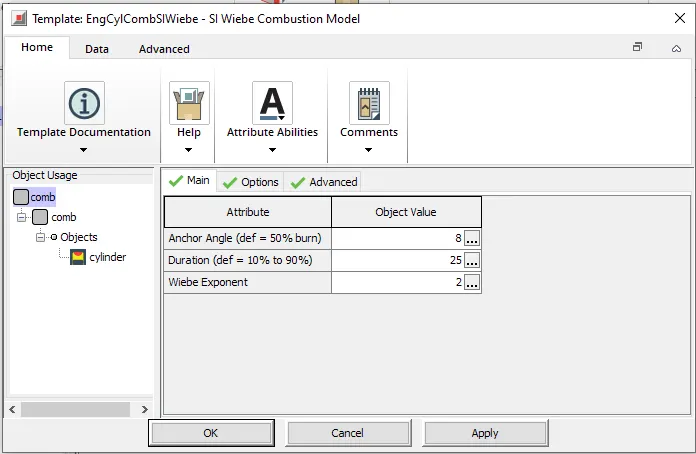
To find the effect of MFB50, we need to simulate both the models considered to get results. MFB50 or Mass Fraction Burnt 50% is the position where 50% of fuel mass burned over an engine cycle is reached. It provides very important information about the effectiveness of combustion, such as the kind of combustion that is taking place. In GT-SUITE, the MFB50 parameter for SI engine models are controlled using the anchor angle of the engine under the combustion object.
Anchor Angle (def = 50% Burn) - SI petrol engine
Angle "anchoring" the Wiebe curve to TDC or the name of a dependency reference object specifying the angle. The specified angle is the number of crank angle degrees between TDC and typically the 50% combustion point of the Wiebe curve. The attribute Burned Fuel % at Anchor Angle below may optionally be used to change the burn point in the Wiebe curve from 50%. (Typical values are 5 to 12 degrees after TDC.)
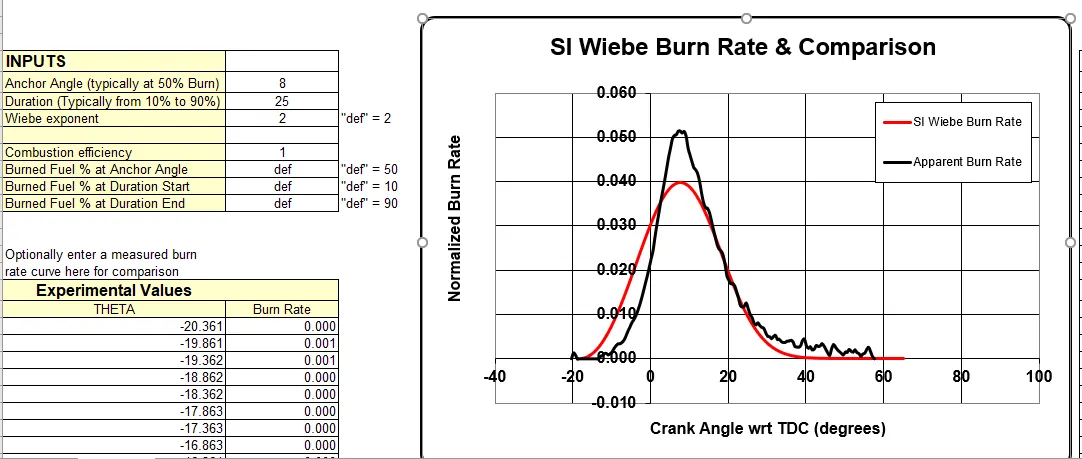
Default case of SI engine with Anchor angle 8 deg
Performance Parameter
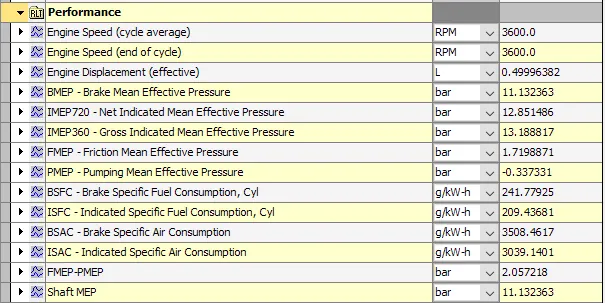
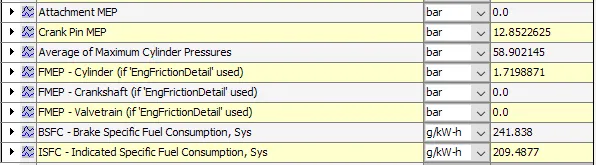
SI Wiebe Burn Rate & apparent Burn Rate Comparison
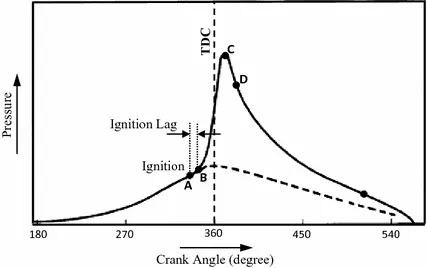
There are three stages of combustion in SI Engine as shown
Ignition lag stage
Flame propagation stage
After burning stage
Concidering non-predective combustion model thus we have two parameters to study
1. Anchor angle - changing from 5 to 12 deg
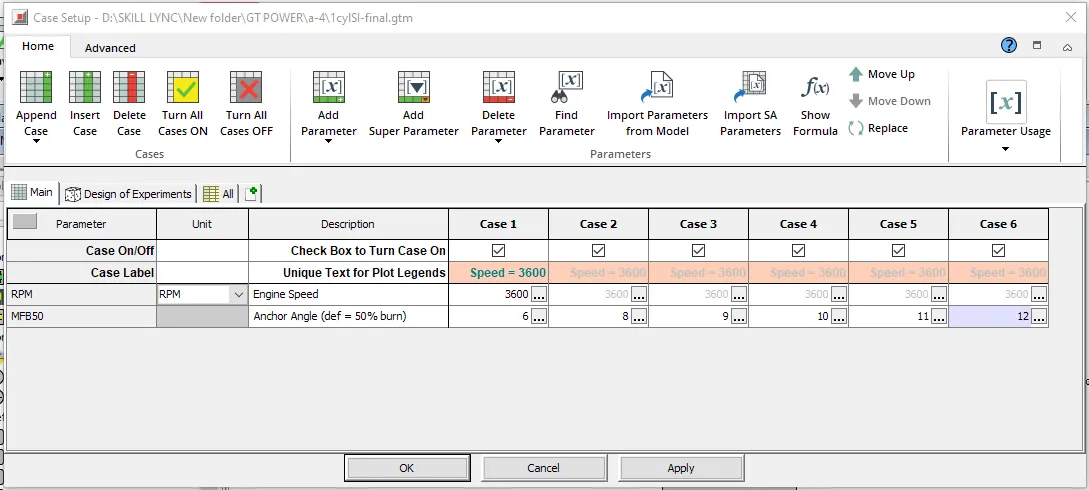
Above 6 cases are set covering the decided range of anchor angle and case no.2 is a default case. Runing all the 6 cases at once we can see the change in performance of SI engine. The combustion model we are using is non-predictive (SIWiebe) where burn rate is impose expelicitly by user. This model not affected by operating conditions (i.e. Speed, load, a/f) and gives fast computation
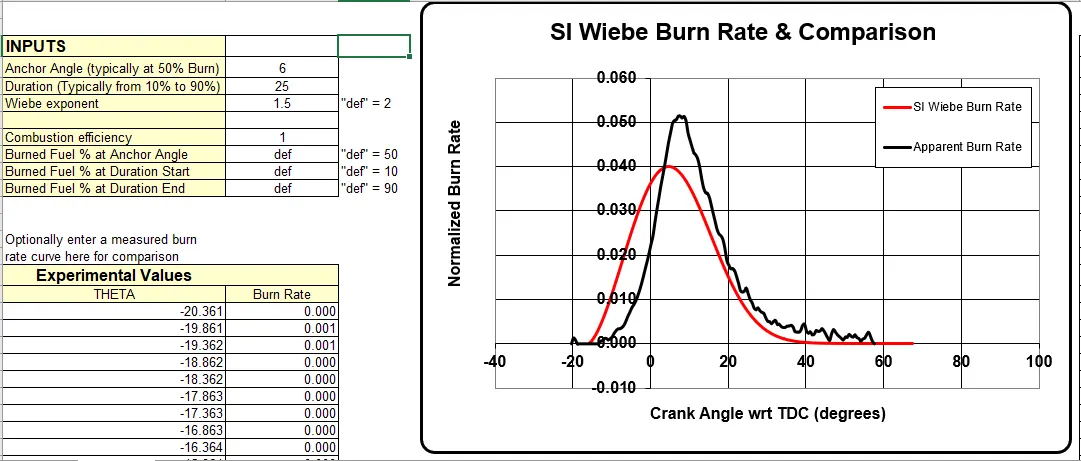
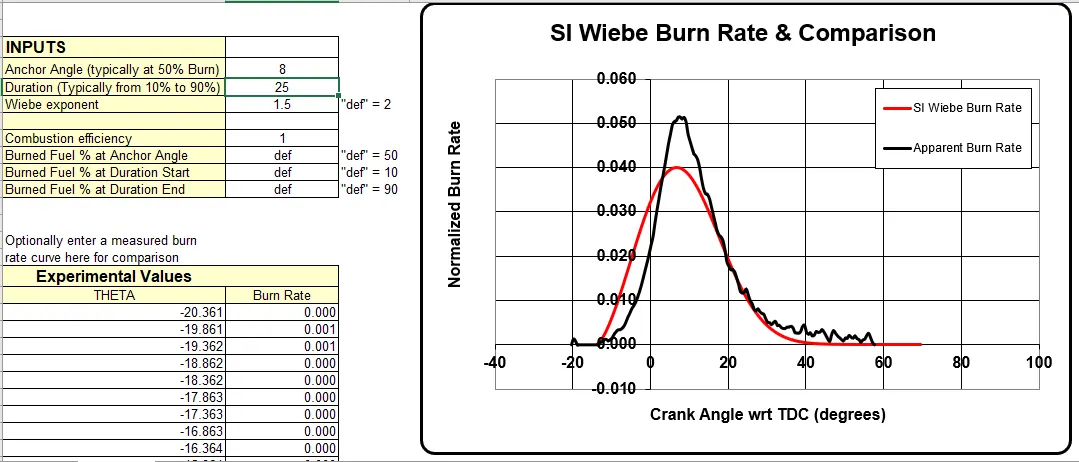
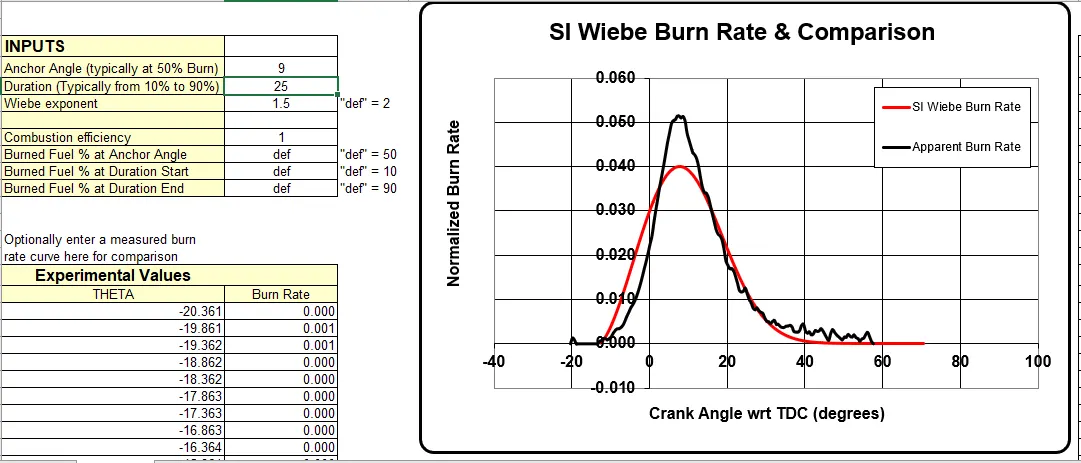
Comparision of SI Wiebe Burn Rate(Input data) & Apperent Burn Rate
Case 1 - Anchor angle 6 deg
Case 2 - Anchor angle 8 deg
Case 3 - Anchor angle 9 deg
Case 4 - Anchor angle 10 deg
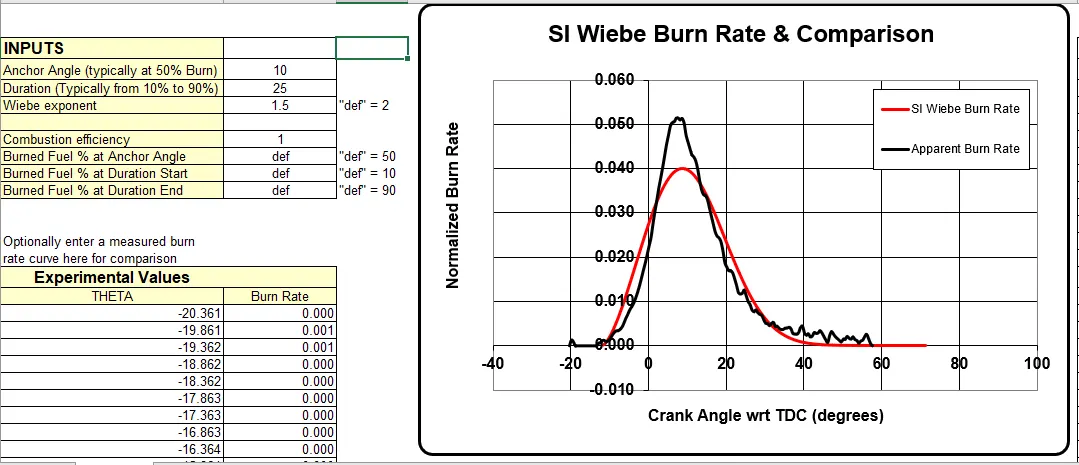
Case 5 - Anchor angle 11 deg
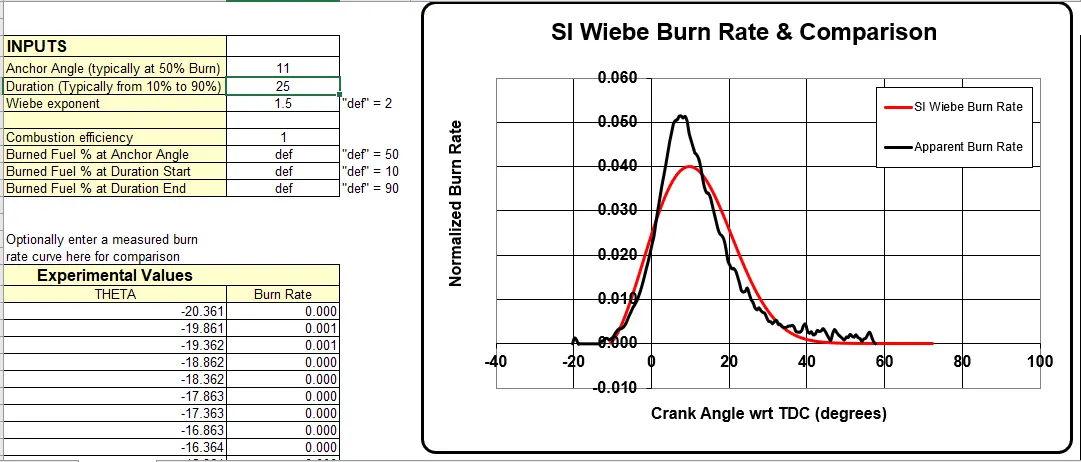
Case 6 - Anchor angle 12 deg
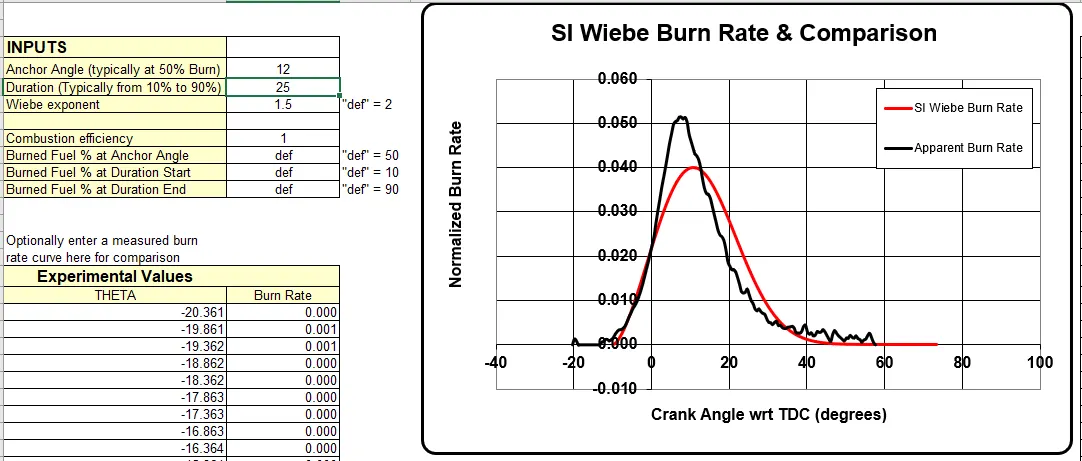
All of the above graphs shows that as we change anchor angle from 5 to 12 deg the whole curve has started shifting from left to right that means increase in anchor angle shifts the point of igniation on SI Wiebe burn rate curve from apparent curves's igniation point
Burn Rate Plot
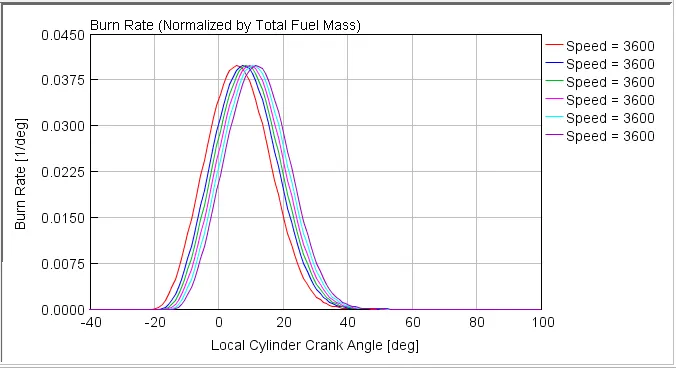
The curve shows that the ignition point shifts towards right as we increases the anchor angle. that means anchor angle delays combustion process but there is no change in expansion, it is constant for all the cases.
Effect on engine Performance
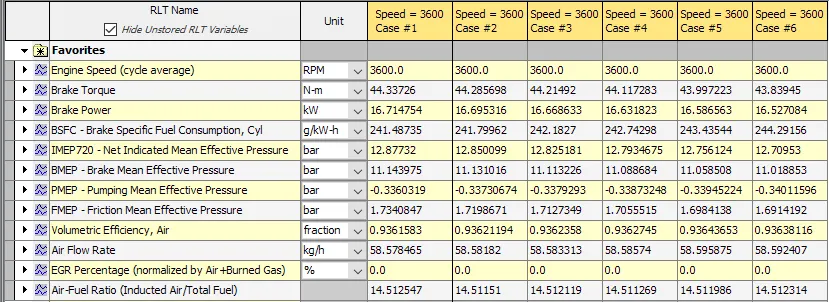
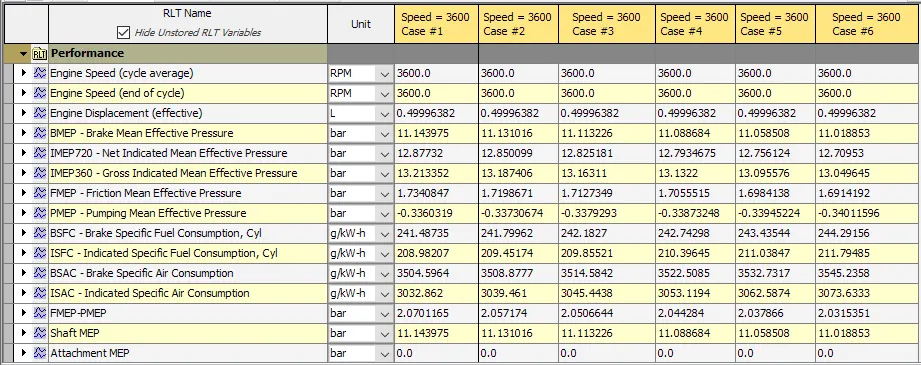
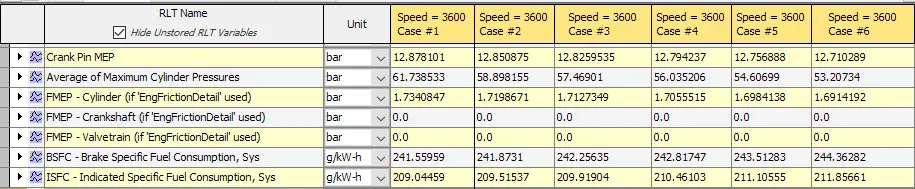
Brake torque, BSFC, ISFC and BSAC get increases with the increase in anchor angle

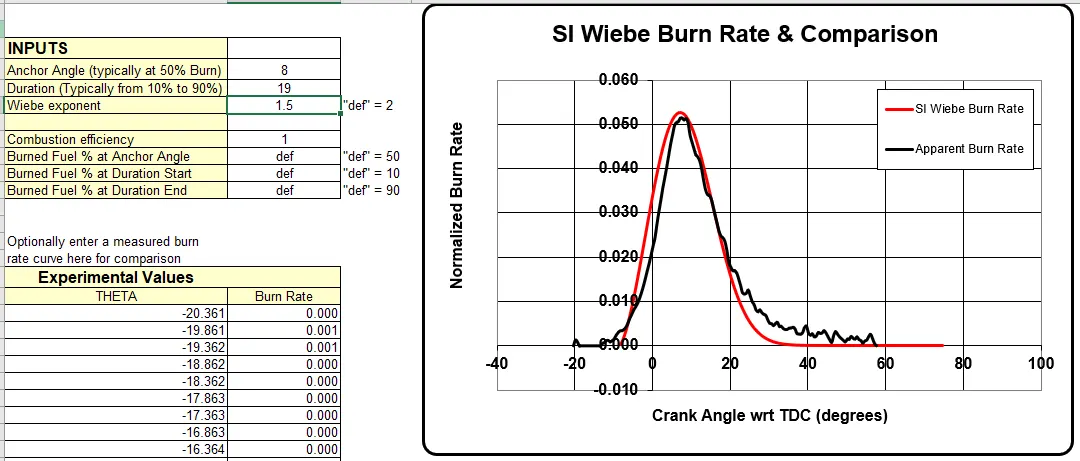
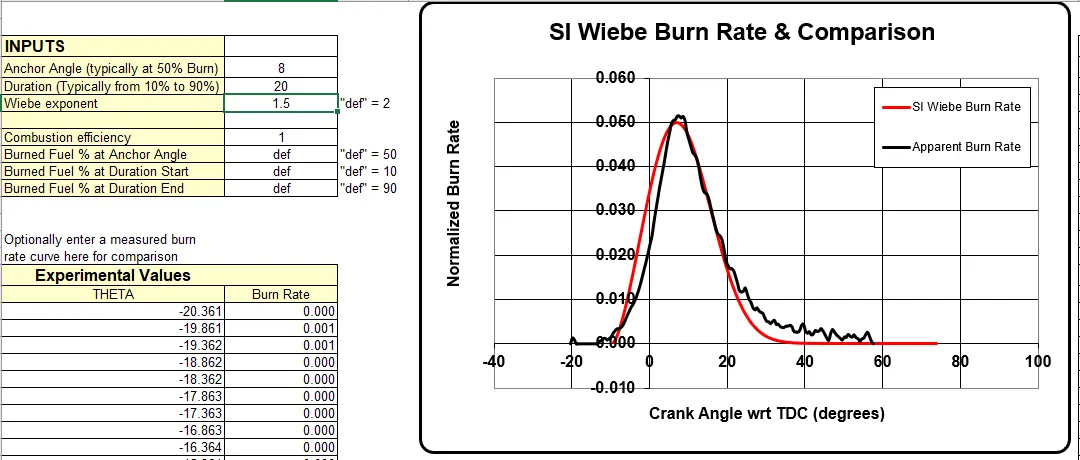
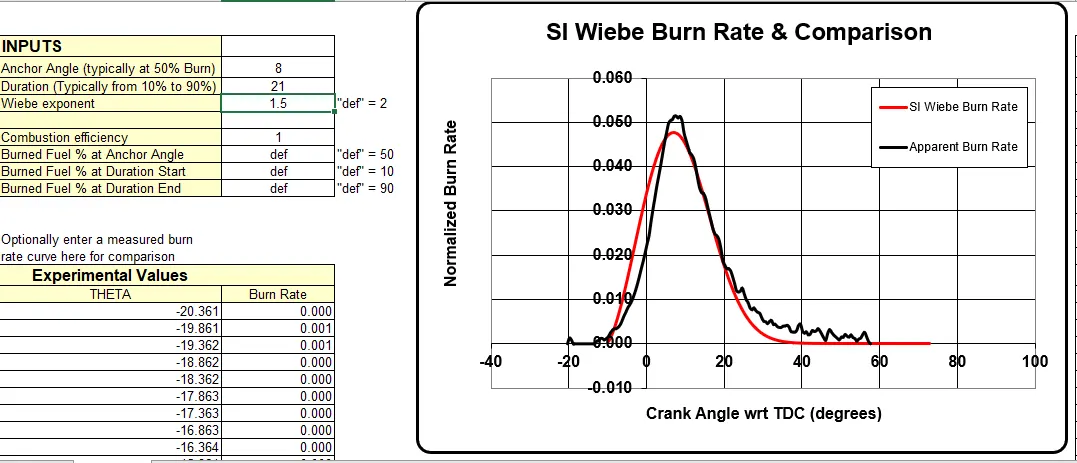
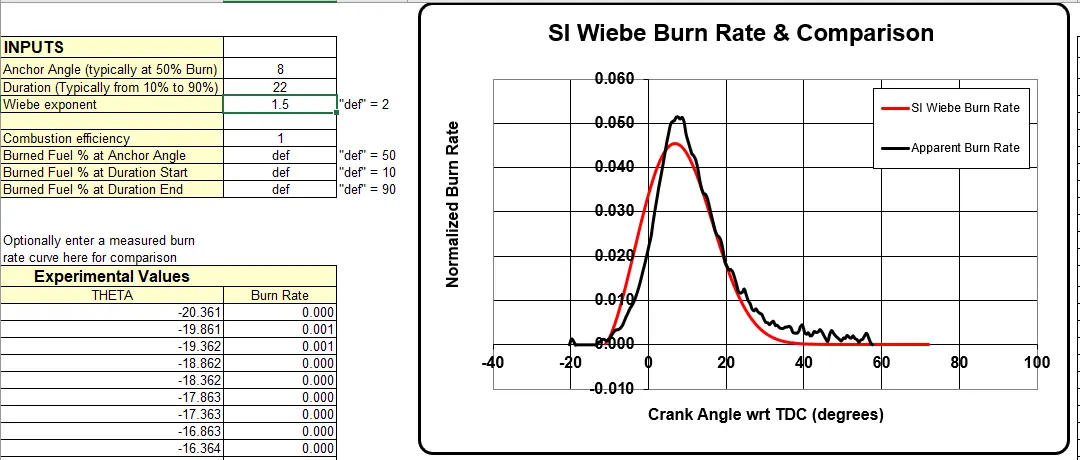
2. Changing Burn Duration - 19 to 25
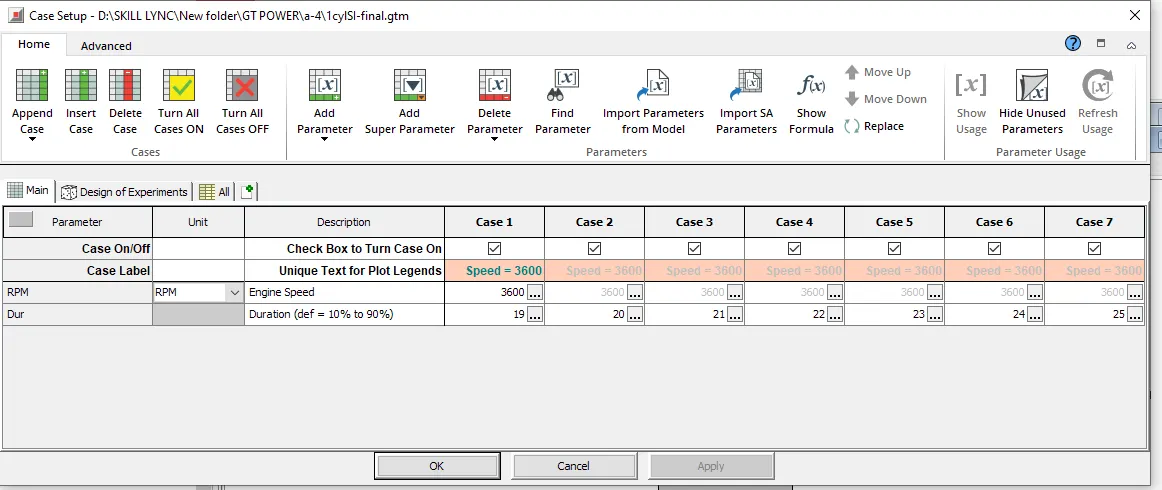
Comparision of SI Wiebe Burn Rate(Input data) & Apperent Burn Rate
Case 1 - Duration = 19%
Case 2- Duration = 20%
Case 3- Duration = 21%
Case 4- Duration = 22%
Case 5- Duration = 23%
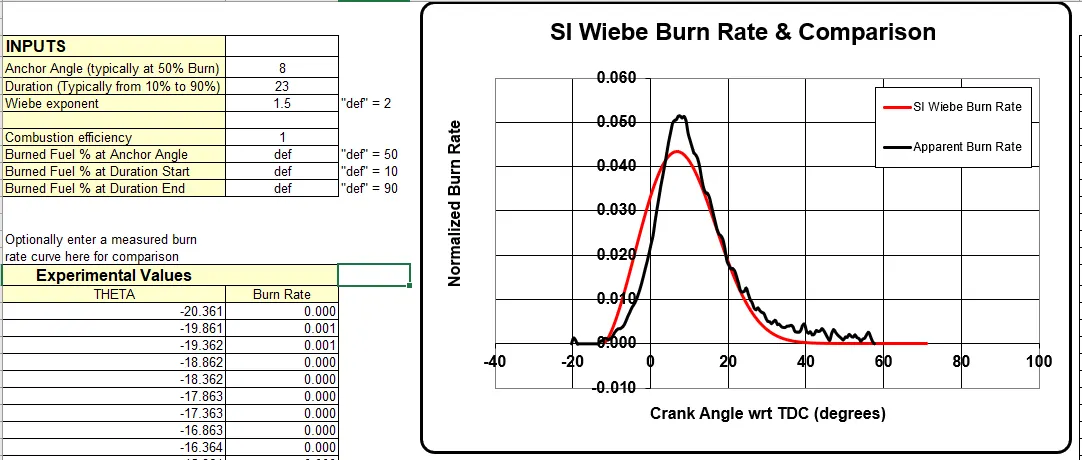
Case 6- Duration = 24%
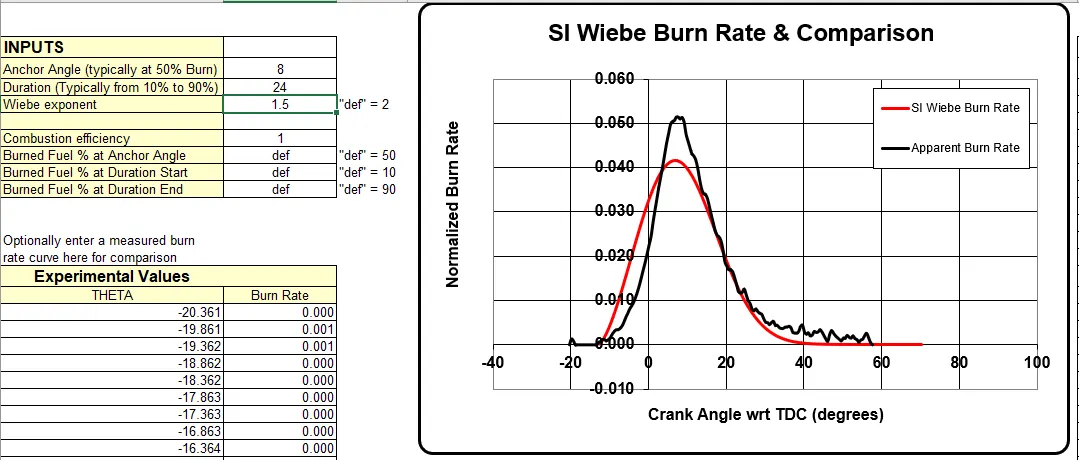
Case 7- Duration = 25%
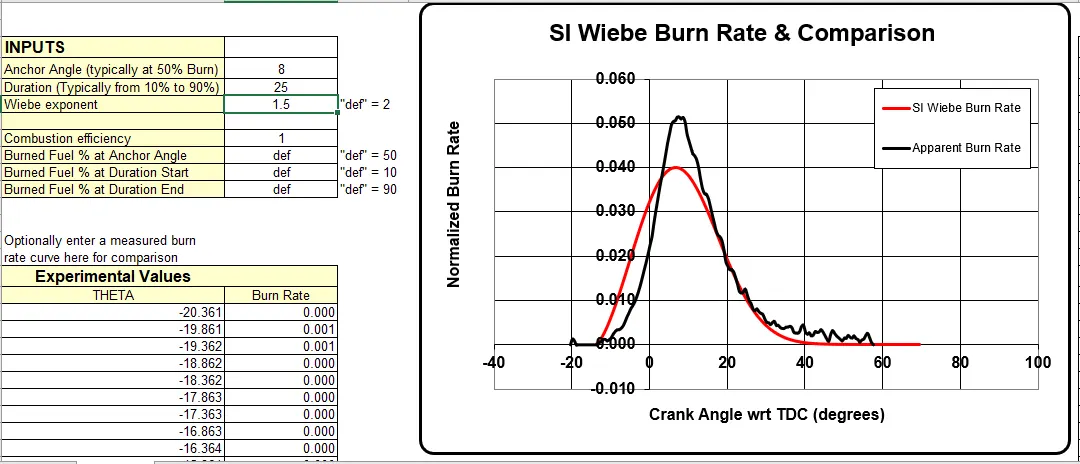
From all the above cases we can see that as the duration is increases the peak of combustion curve decreases.
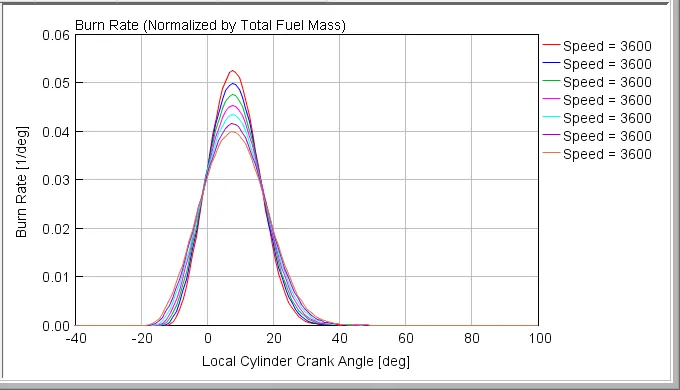
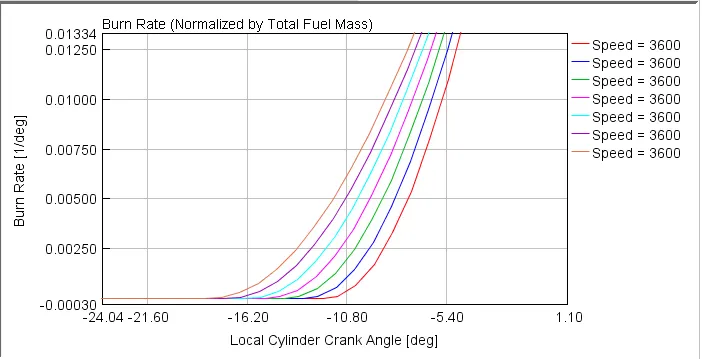
Above graph shows that with the increase in duration peak of combustion curve decreases and ignition delay also takes place. If we compare the all cases we can see that there is approx. 5 deg shift in start of combustion
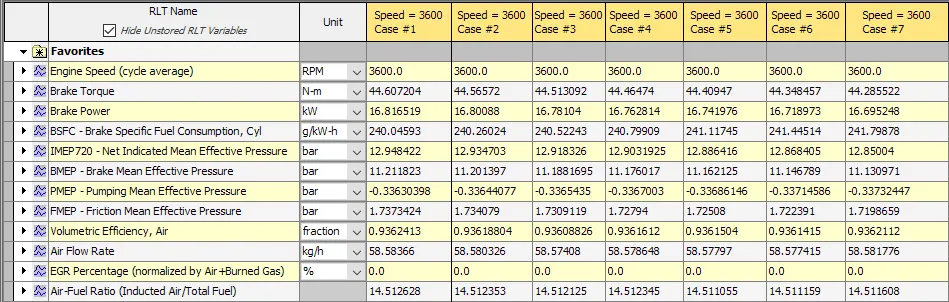
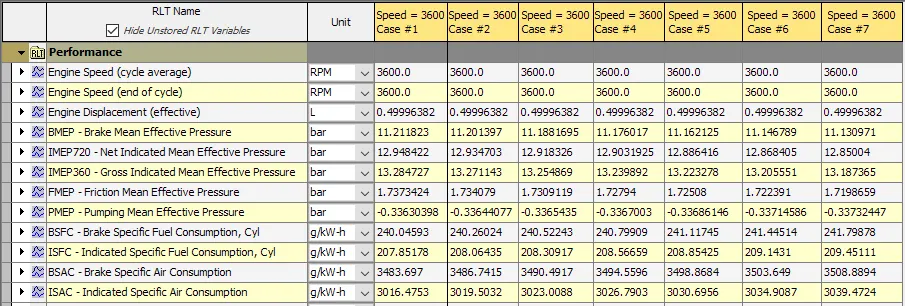
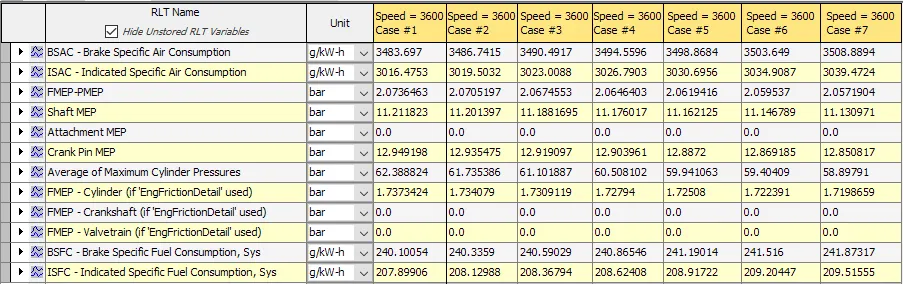
If we take look at performance parameter then torque and powe remains nearly same but BSFC, ISFC, BSAC are inncreases with increase in duration and avg. max. cylender pressure reduces with increase in duration.

To match a apperent burn curve the input to SI Wiebe model can be Anchor angle = 9 deg & Duration = 19.5%
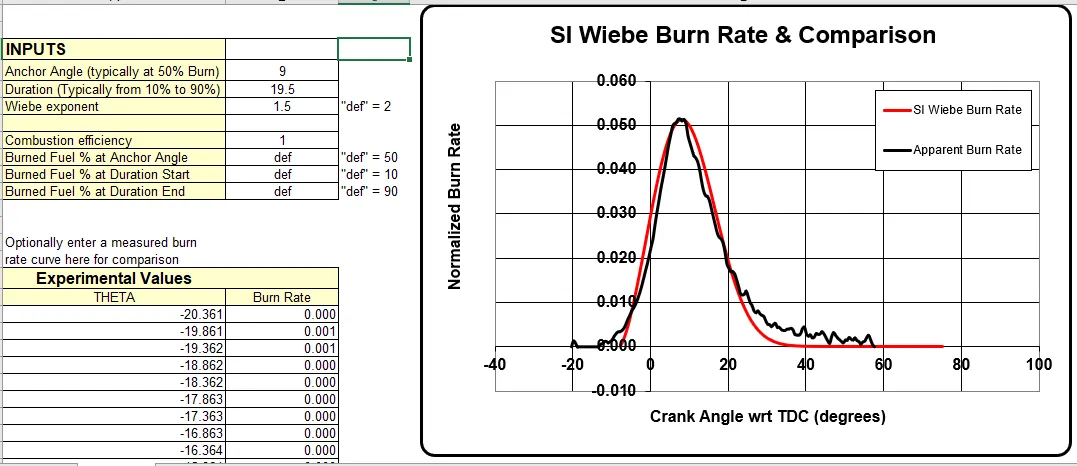
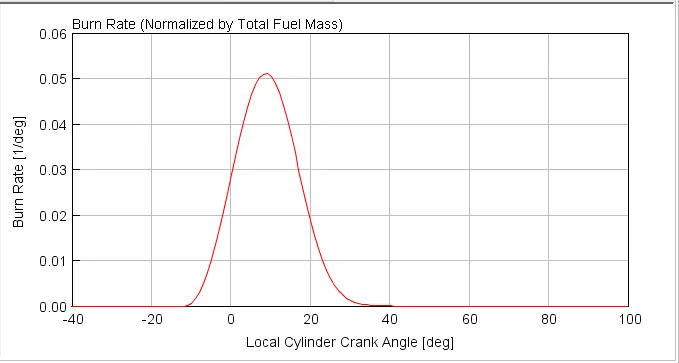
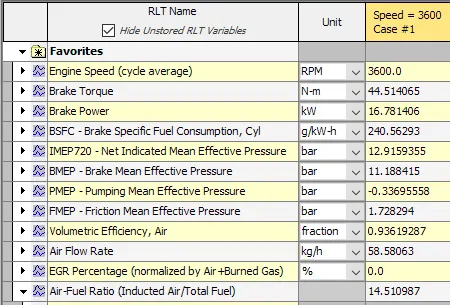
From the above simulation results and the curves we can see that even after changing anchor angle and burn duration we cant exactly match the input of wiebe model with apperent burn rate but non-predective combustion model is faster to simulate with a lesser inputs and gives the approximately nearer results to the apperent burn rate.
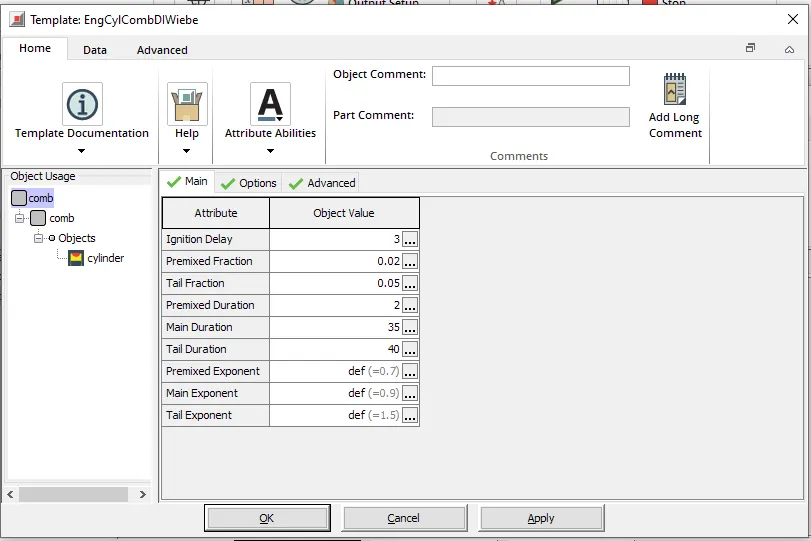
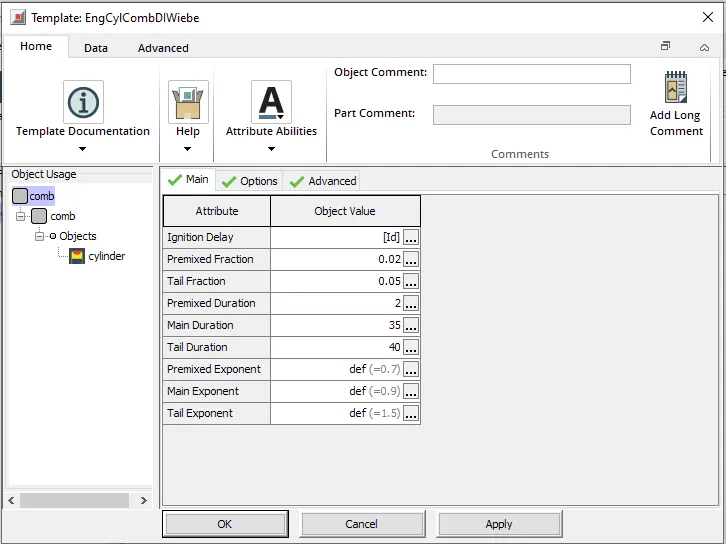
In the CI engine models, the MFB50 parameter is controlled using the main duration variable under the combustion object.
Main Duration - CI diesel engine
Duration in crank-angle degrees of the main diffusion burn or the name of a dependency reference object. The duration should exclude the first 10% and the last 10% of the area under the main burn curve, i.e. the tails.
Hence, to change values of MFB50 in each engine type, we gotta add them as parameters and develop case setups to analyse the results. To add a parameter, we have to enter the parameter name definition in square brackets in the object value table of the respective attribute.
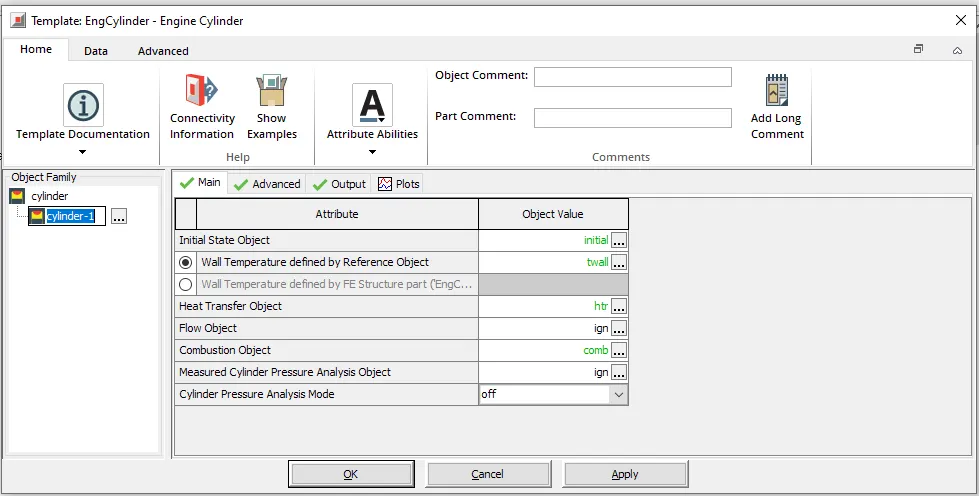
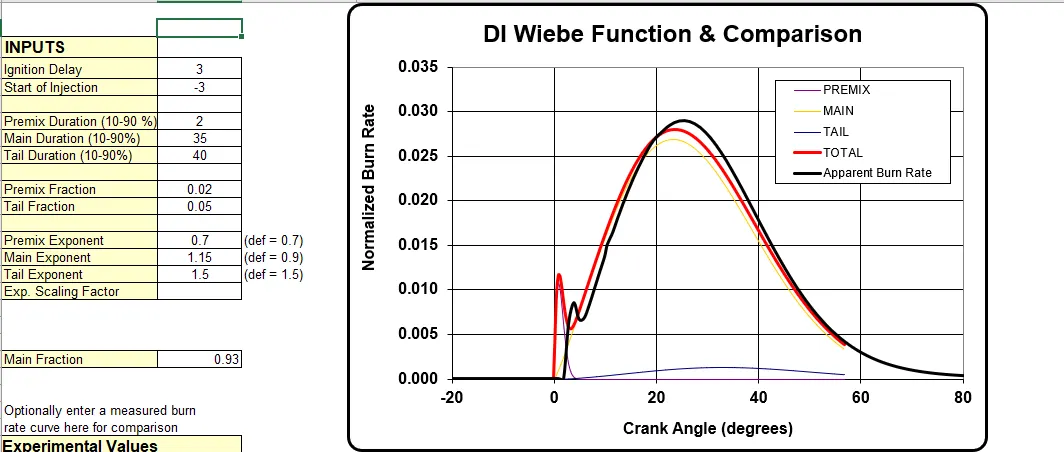
Unlike SI engine combustion process in CI engines is complicated. It involves different stages
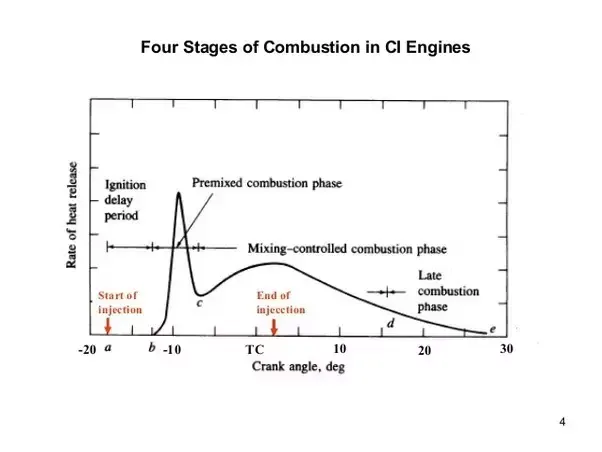
There are four different stages of combustion in CI engine where proper combustion of air and fuel takes place as follows:
- Ignition Delay Period
- Period of Uncontrolled Combustion
- Period of Controlled Combustion
- After Burning
Concidering non- predictive combustion model (CI Wiebe) in CI engine combustion we have six different parameters to study (range of parameters are taken in a intention to match apperent burn rate curve)
1. Ignition Delay
The time interval between the starting of the fuel injection and the beginning of the combustion is called the Ignition delay period and this is achived by delay in crank-angle degrees
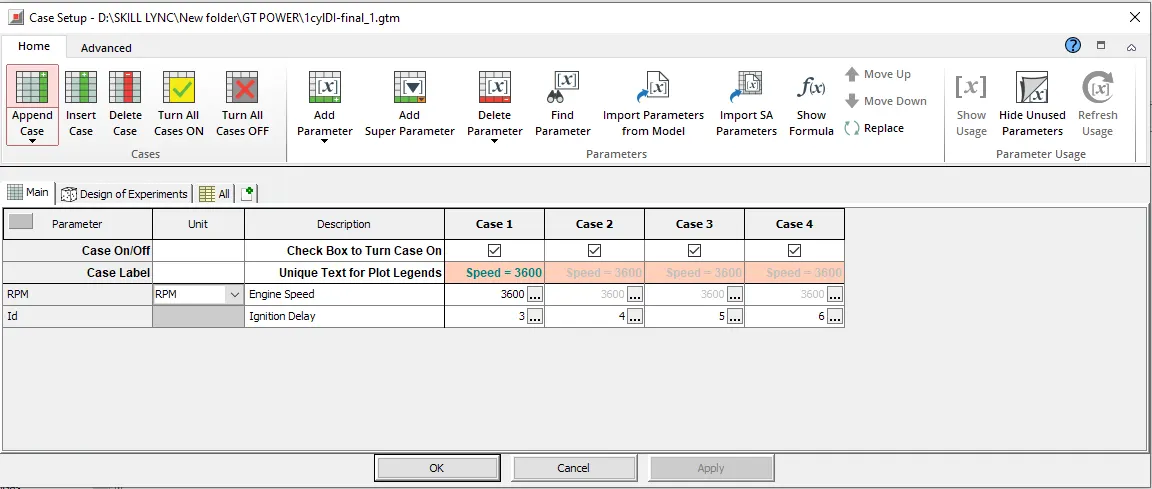
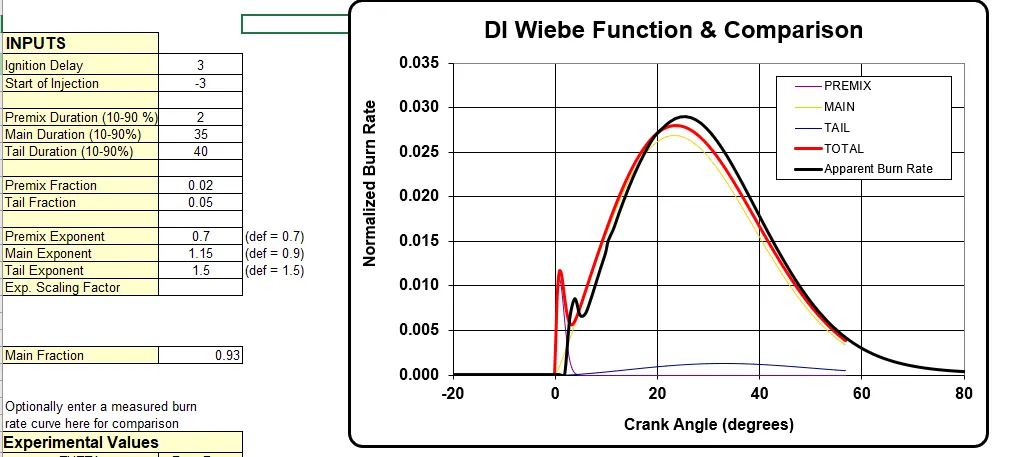
Comparision of SI Wiebe Burn Rate(Input data) & Apperent Burn Rate
Case 1 - Ignition delay = 3
Case 2 - Ignition delay = 4
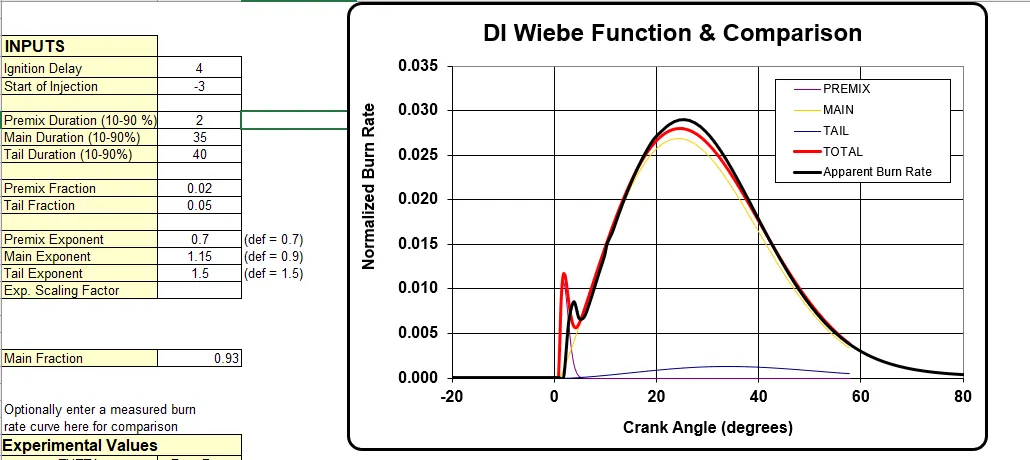
Case 3 - Ignition delay = 5
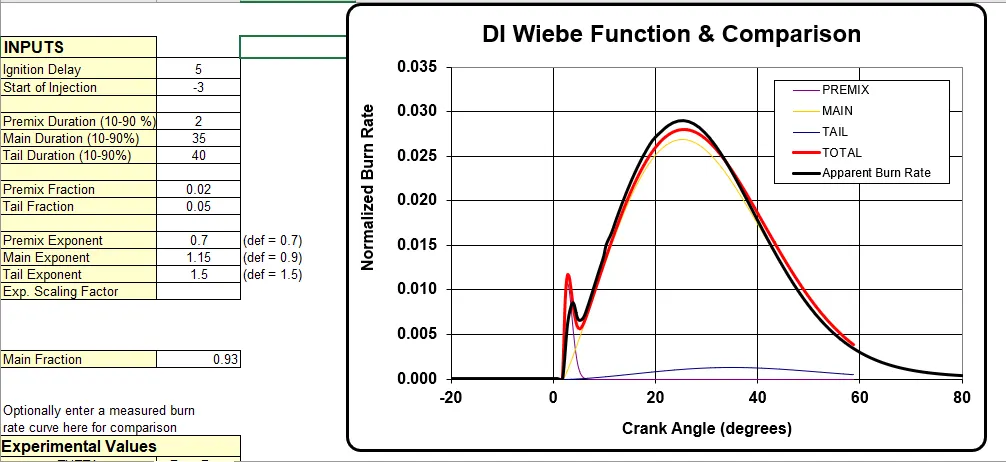
Case 4 - Ignition delay = 6
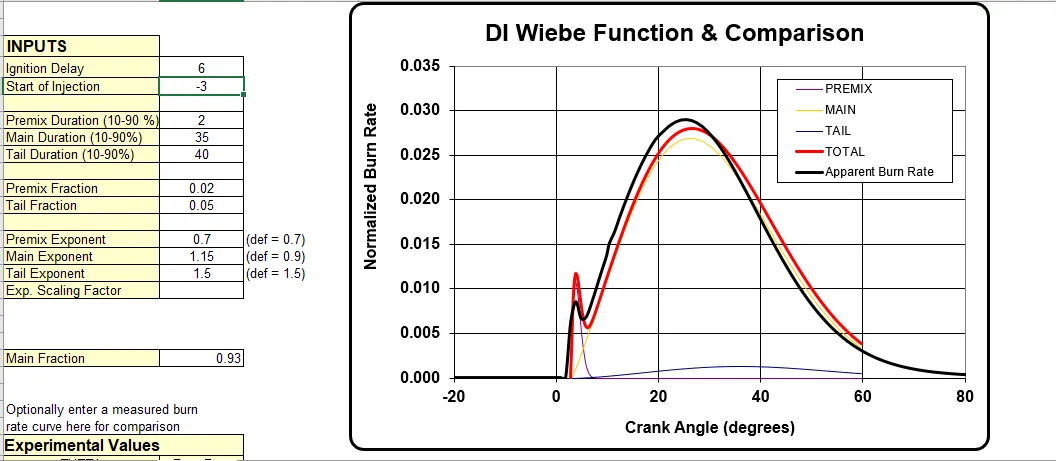
from all of the above cases we can see that at crank angle delay of 5 deg we can achive fuel burning time equal to apperent model. As we increase the crank angle we get the delay in fuel burning. This helps the better mixing of air and fuel. If this delay period performs longer than usual, then we can here Knocking in CI engine.
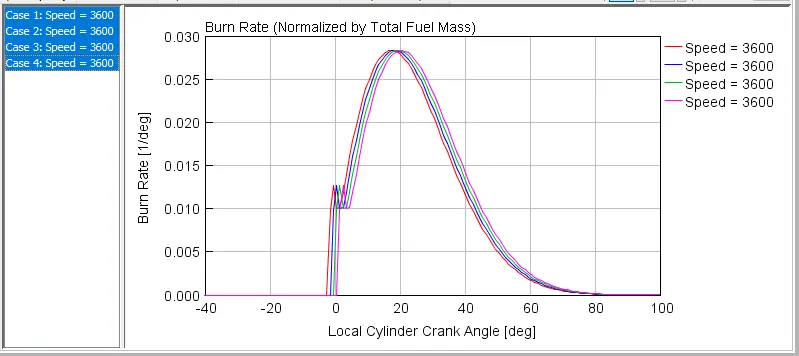
The curve shows the simulation result of ignition delay from 3 to 6 deg crank angle.
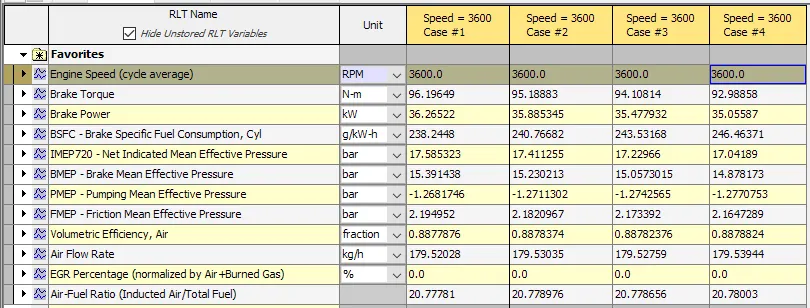
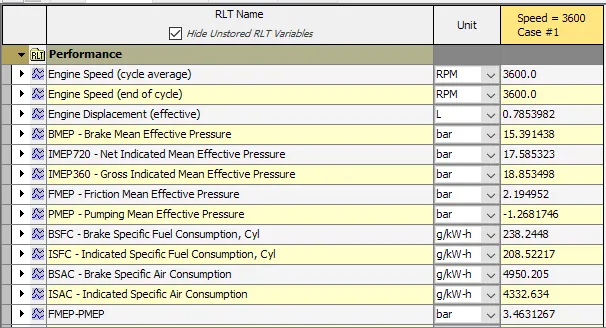
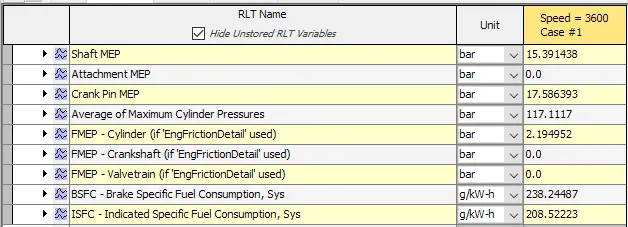
Due to igniation delay slight reduction in brake torque and brake power is seen. Case 1 is a default case for which torque and power is heigest among all the cases. Due to increase in ignition delay timing there is significant increase in BSFC is seen.
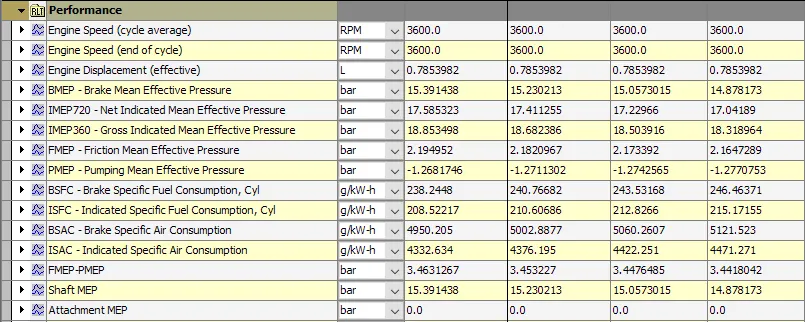
Due to ignition delay more fuel and air is allowed to mixed or more A/F mixture is allowed to go into combustion chember thus fuel and air consupmption increases(BSFC,ISFC,BSAC and ISAC)
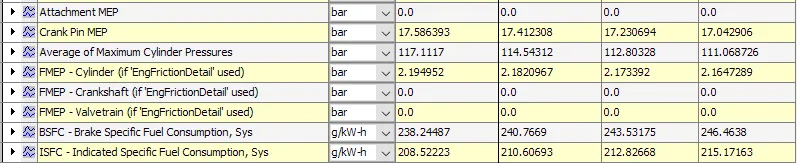
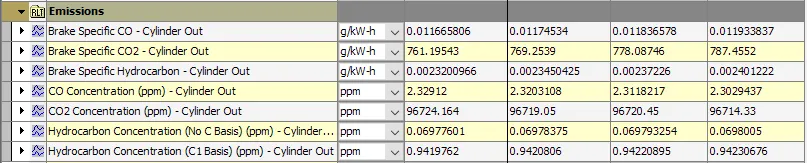
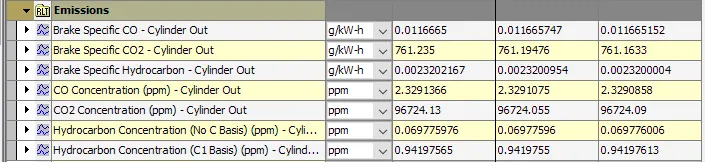
Looking at the emissions we can see that at cylender outlet CO,CO2, CO2 concentration,HC concentration & HC emission rises that means increase in ignitation delay increases engine emissions.
2. Premixed fraction
Fraction of fuel that mixes before the start of combustion and burns in the "premix" portion of the Wiebe function or the name of a dependency reference object.
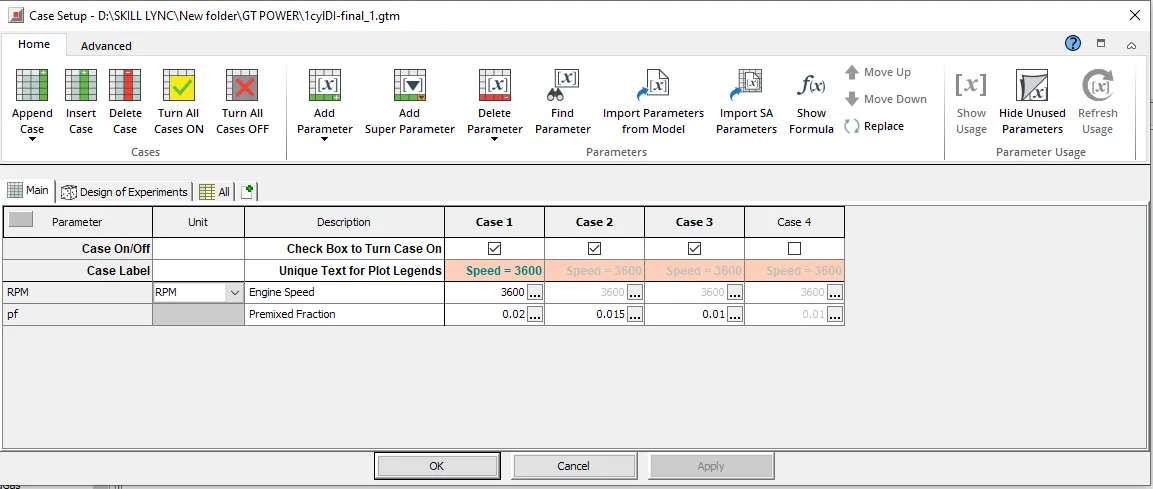
Comparision of SI Wiebe Burn Rate(Input data- changing single parameter) & Apperent Burn Rate
Case 1 - Premixed fraction = 0.02
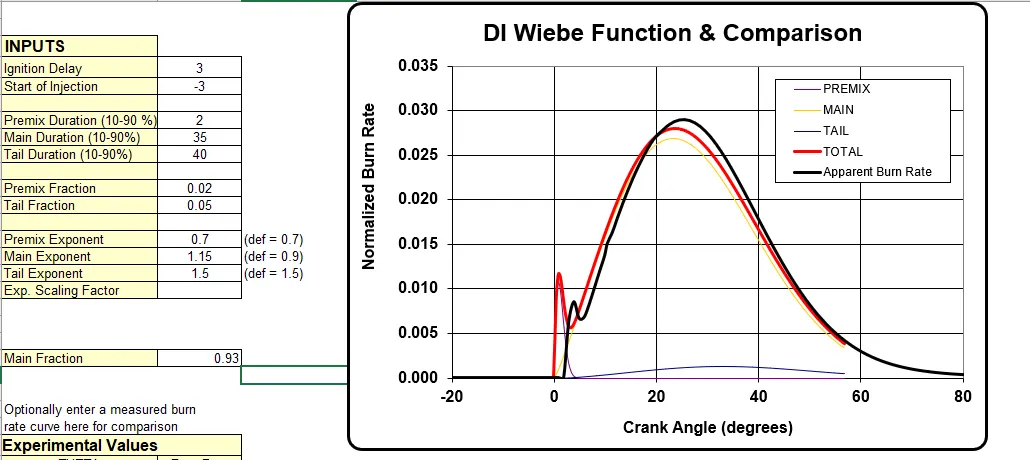
Case 2 - Premixed fraction = 0.015
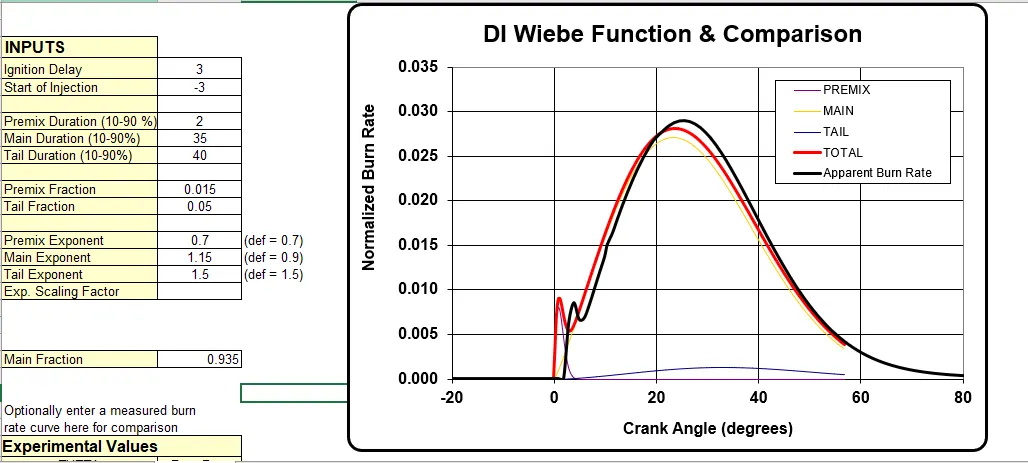
Case 3 - Premixed fraction = 0.01
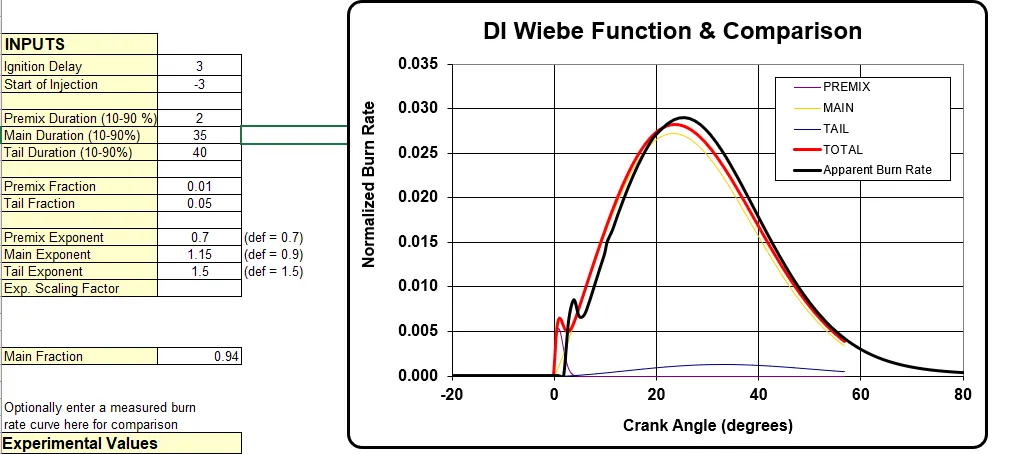
Above change in premixed fraction shows that decrease in premixed fraction less charge given to combustion chember.
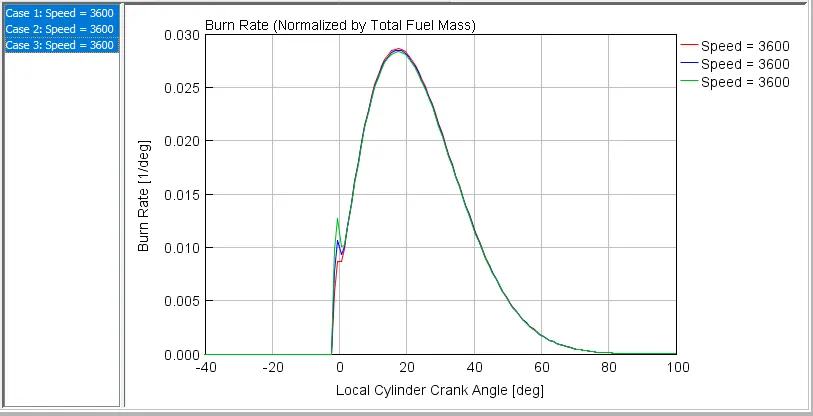
The above grapg shows that as premix fraction decreases there is decrease in premix expansion curve.
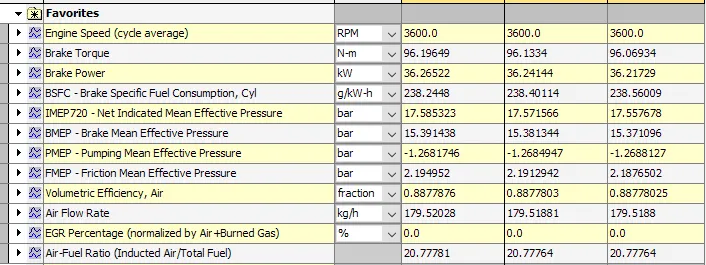
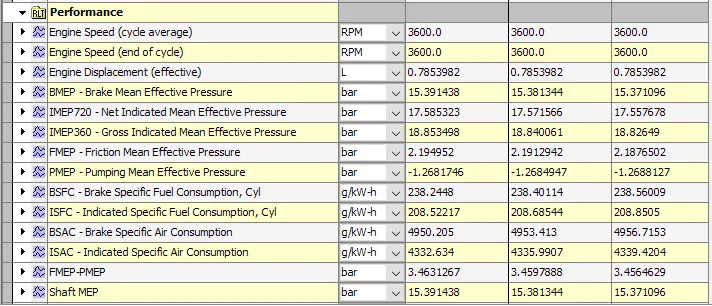
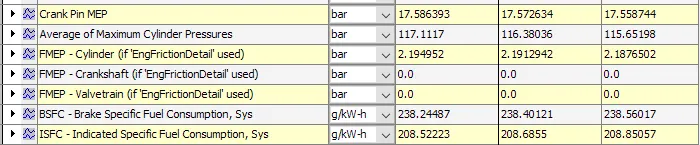
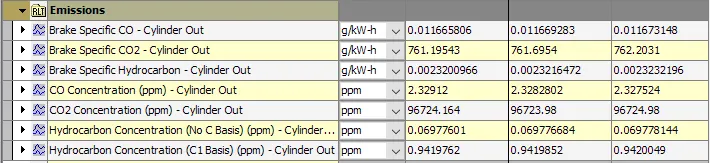
All of the performance parameters are nearly constant for all the cases.
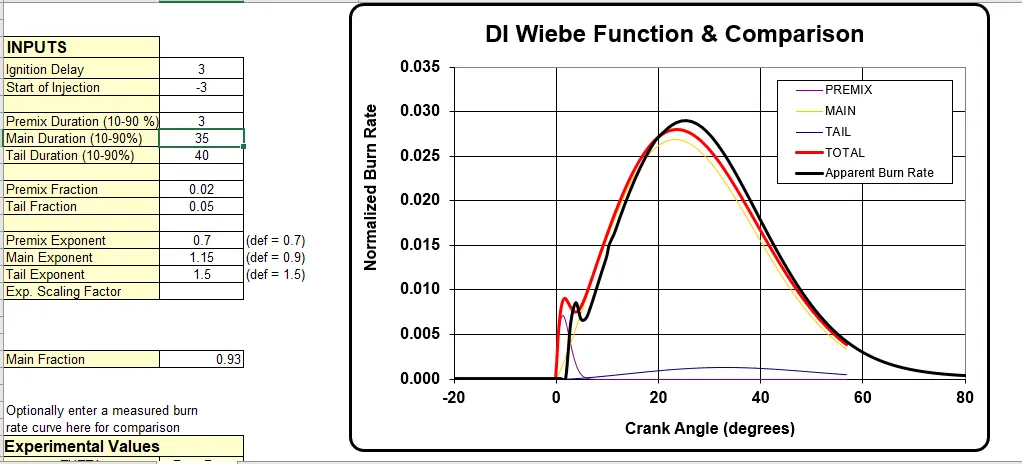
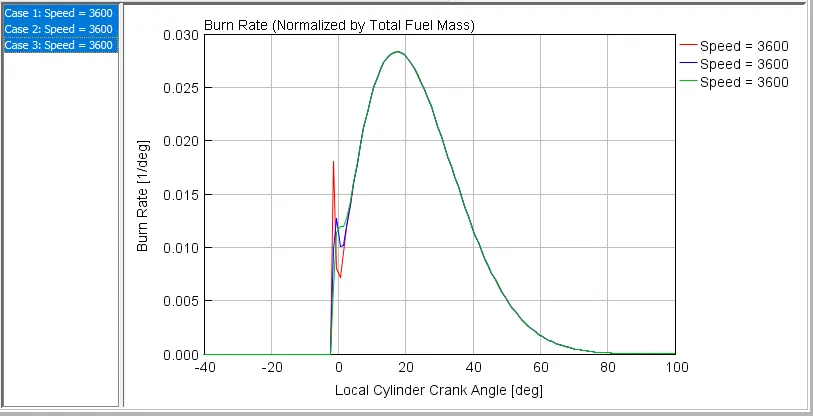
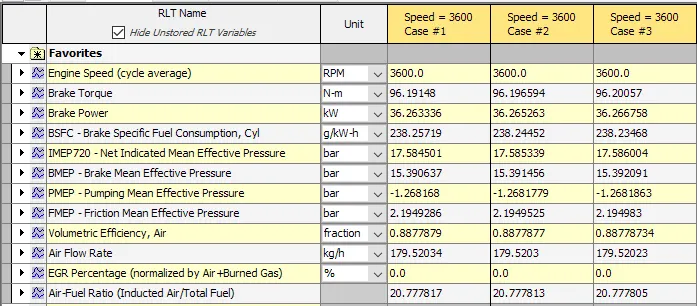
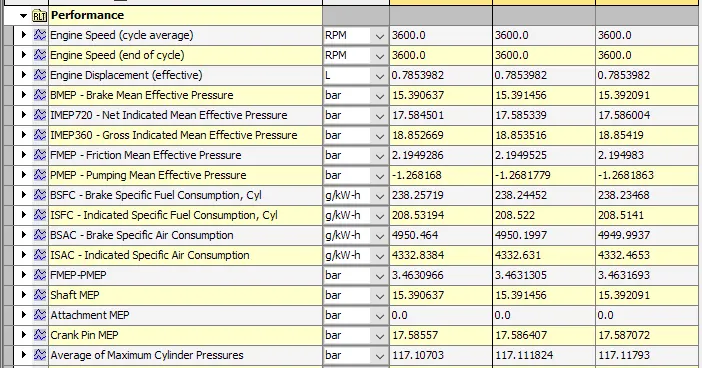
3. Premixed Duration
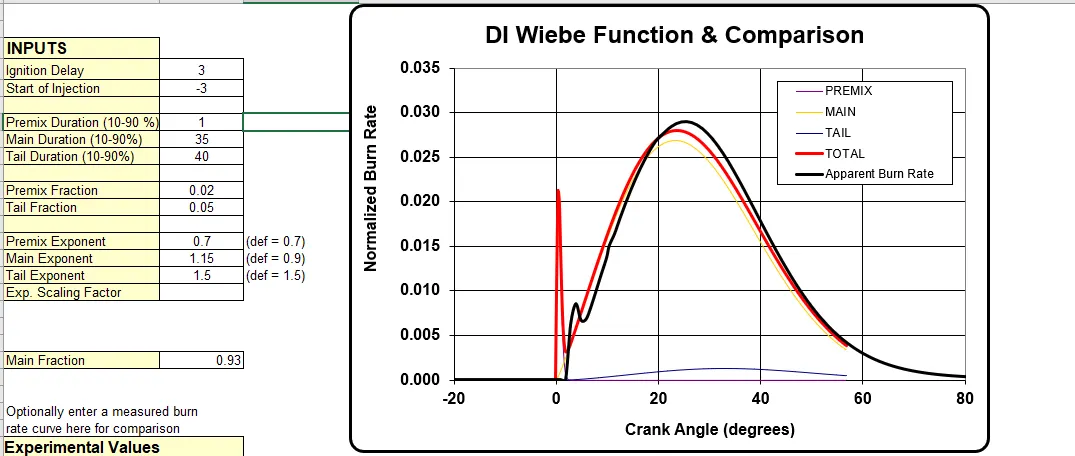
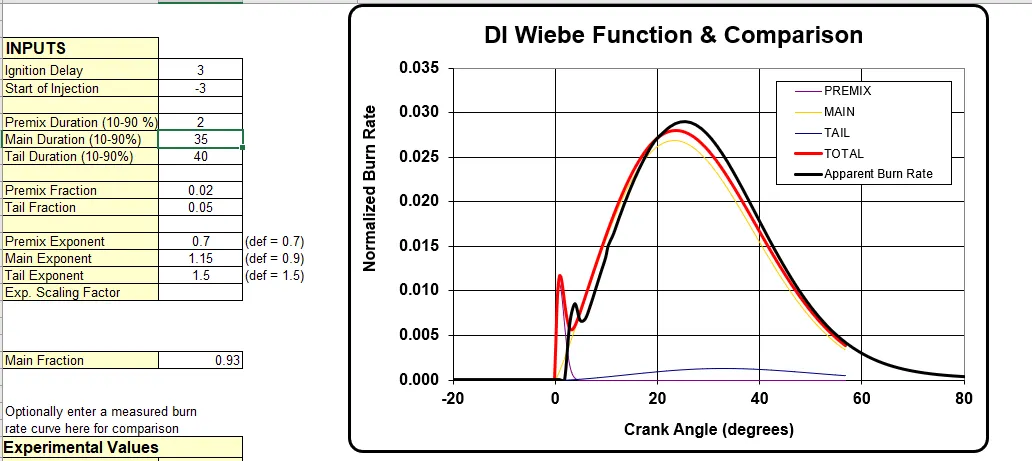
Duration in crank-angle degrees of the premix burn or the name of a dependency reference object. The duration should exclude the first 10% and the last 10% of the area under the premix curve, i.e. the tails.
Comparision of SI Wiebe Burn Rate(Input data- changing single parameter) & Apperent Burn Rate
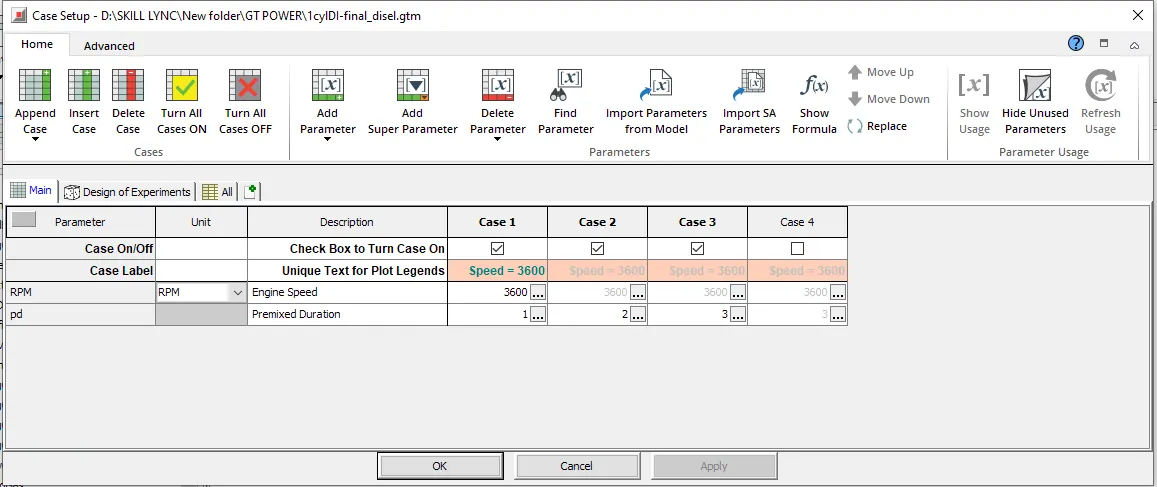
Case 1 - Premixed Duration = 1
Case 2 - Premixed Duration = 2
Case 3 - Premixed Duration = 3

4. Tail Fraction
Fraction of fuel that burns beyond the main diffusion burn or the name of a dependency reference object.
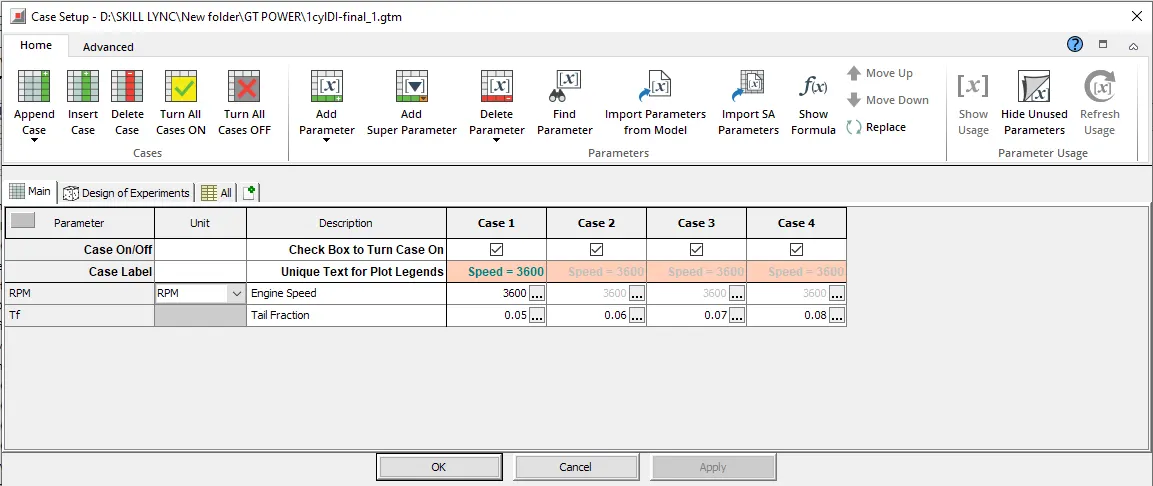
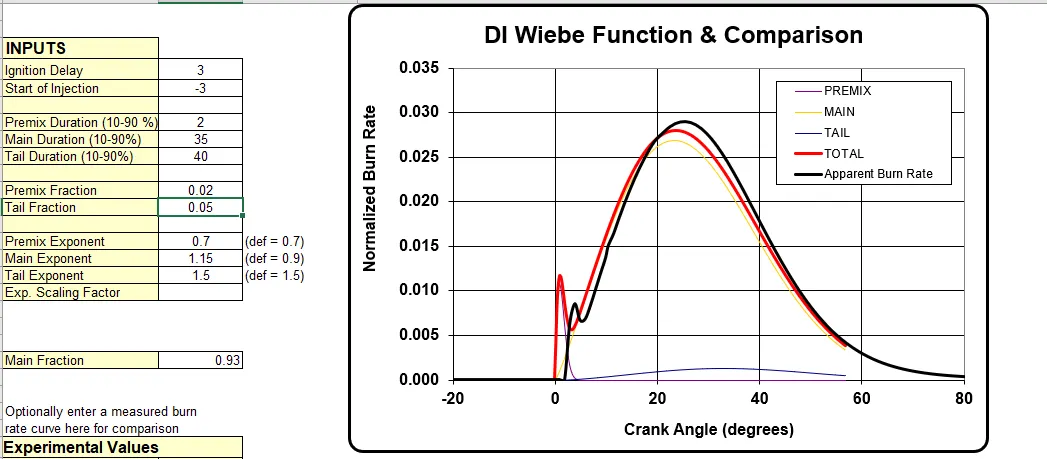
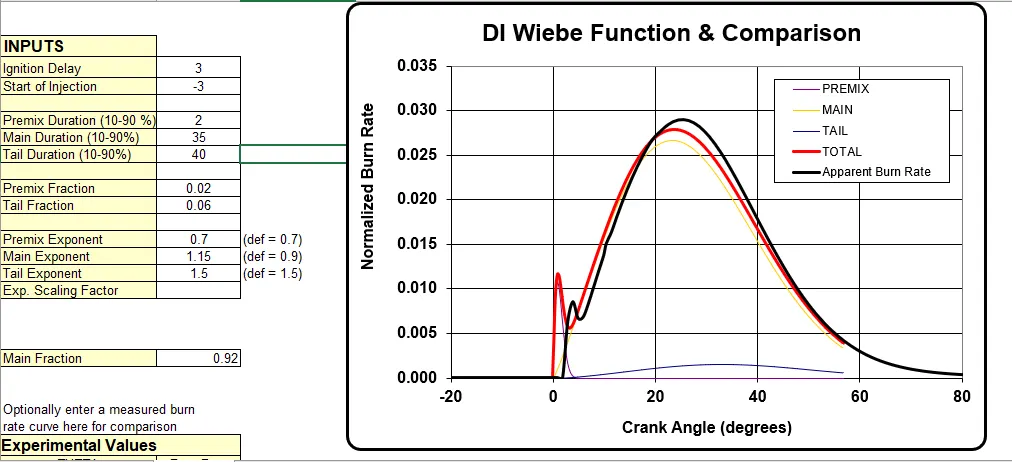
Comparision of SI Wiebe Burn Rate(Input data- changing single parameter) & Apperent Burn Rate
Case 1 - Tail Fraction = 0.05
Case 2 - Tail Fraction = 0.06
Case 3 - Tail Fraction = 0.07
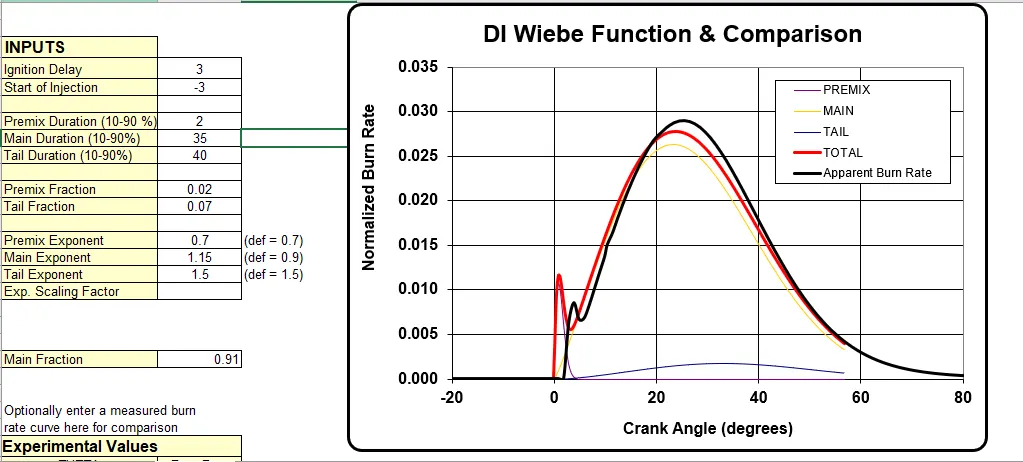
Case 4 - Tail Fraction = 0.08
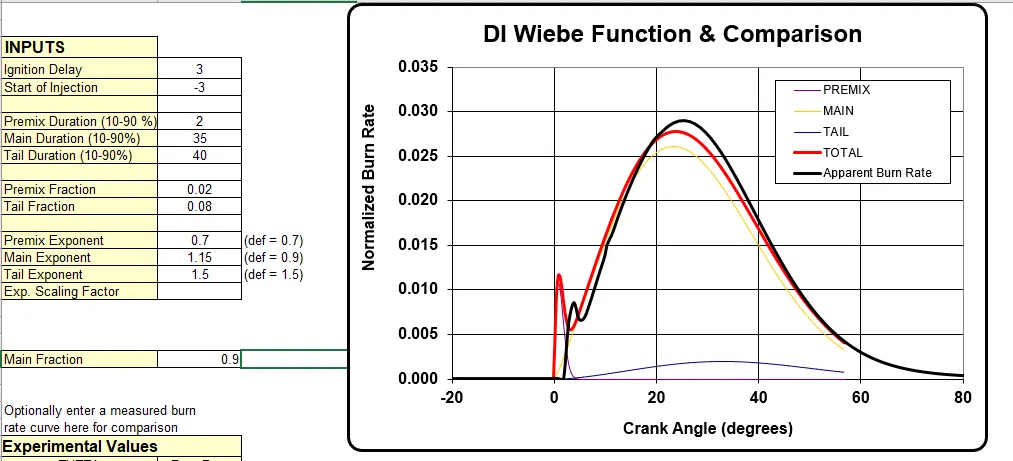
already the default tailfraction value is 0.05 is low and changing tail fraction value by keeping constant other parameters will not make much difference in tail curve. To see the difference the value of tail duration and other parameters need to be varried.
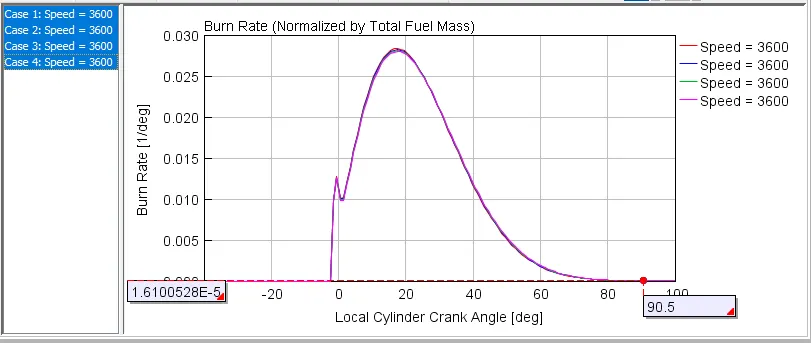
Above graph shows the effect of variation in tail fraction.
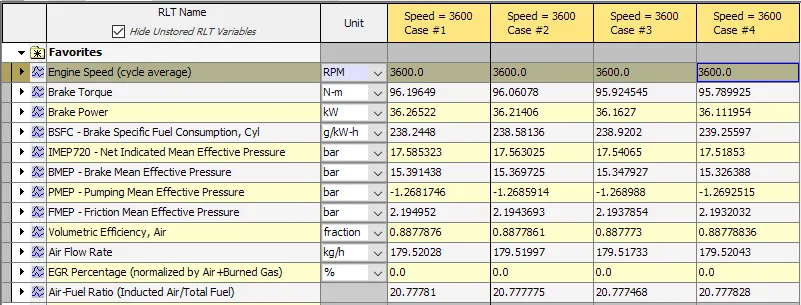
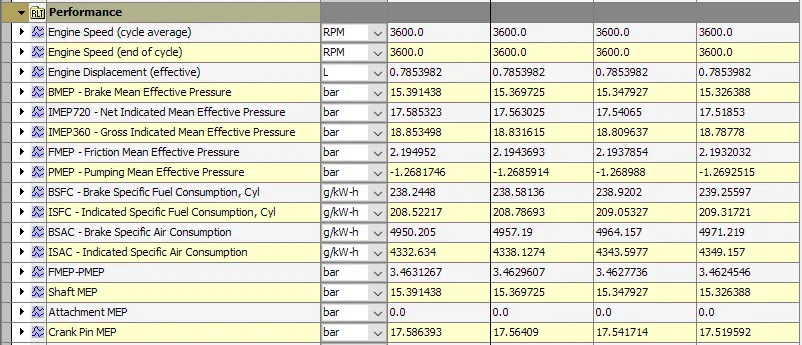
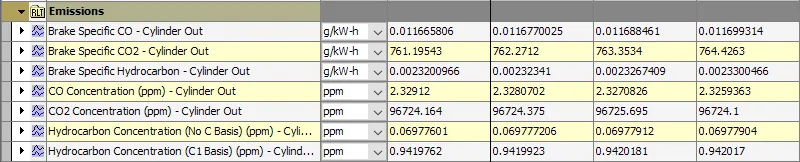
looking at the performance parameters we can see that BSAC & ISAC i.e air consumption increase with the increase in tail fraction. There is changes in emissions of BS-CO2 is seen.
6. Tail Duration
Comparision of SI Wiebe Burn Rate(Input data- changing single parameter) & Apperent Burn Rate
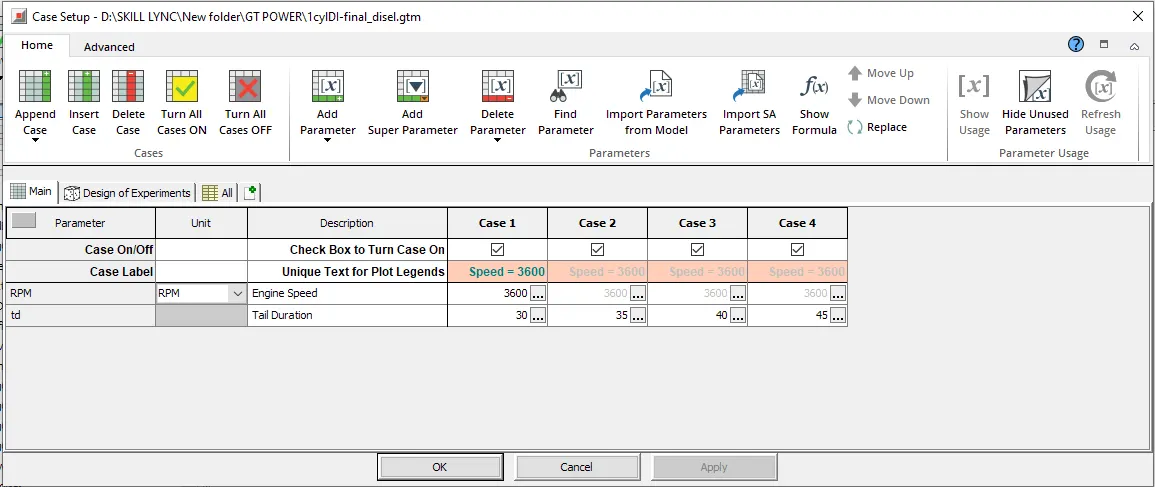
Case 1 - Tail Duration = 30
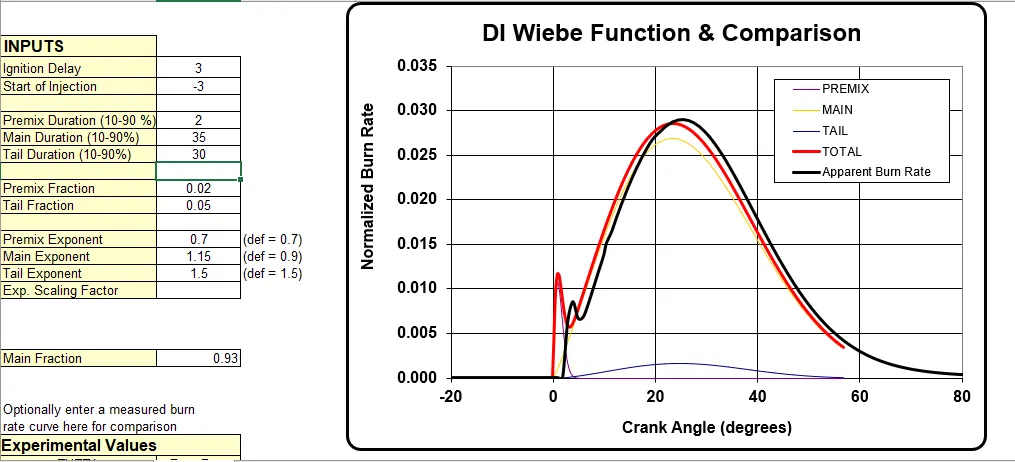
Case 2 - Tail Duration = 35
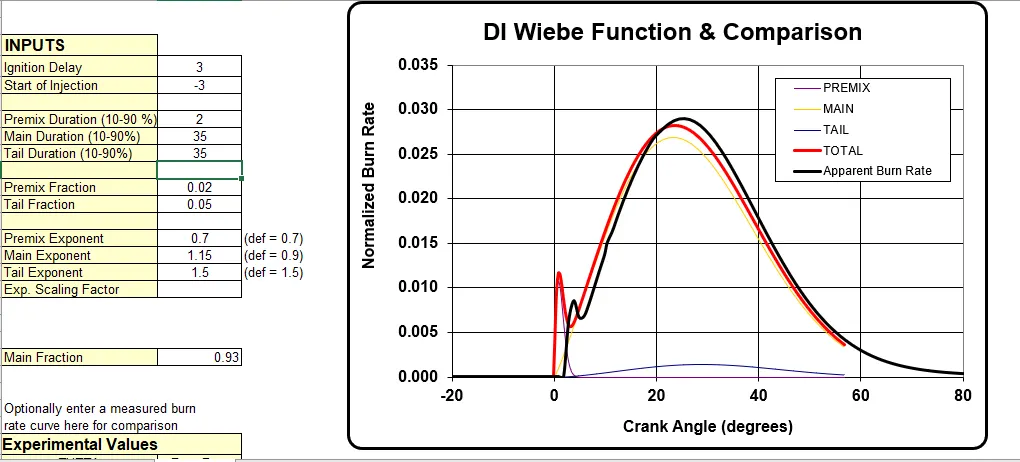
Case 2 - Tail Duration = 40
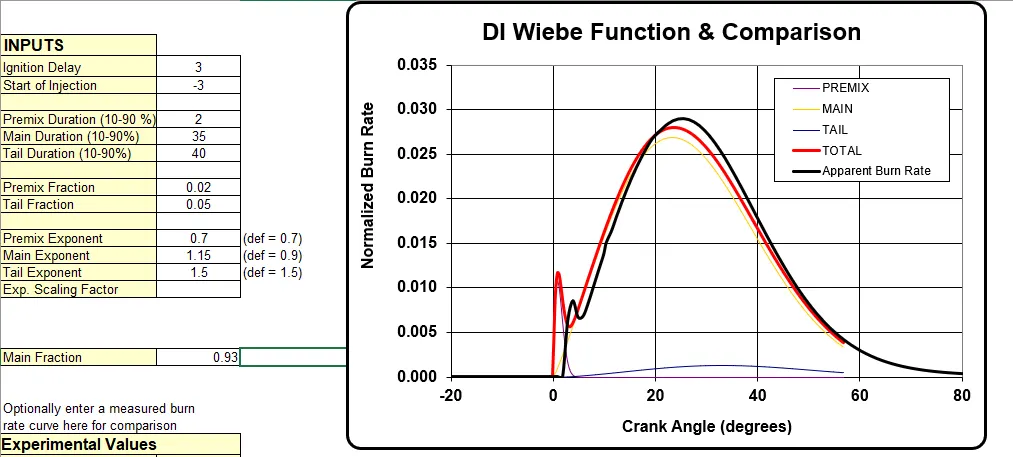
Case 2 - Tail Duration = 45
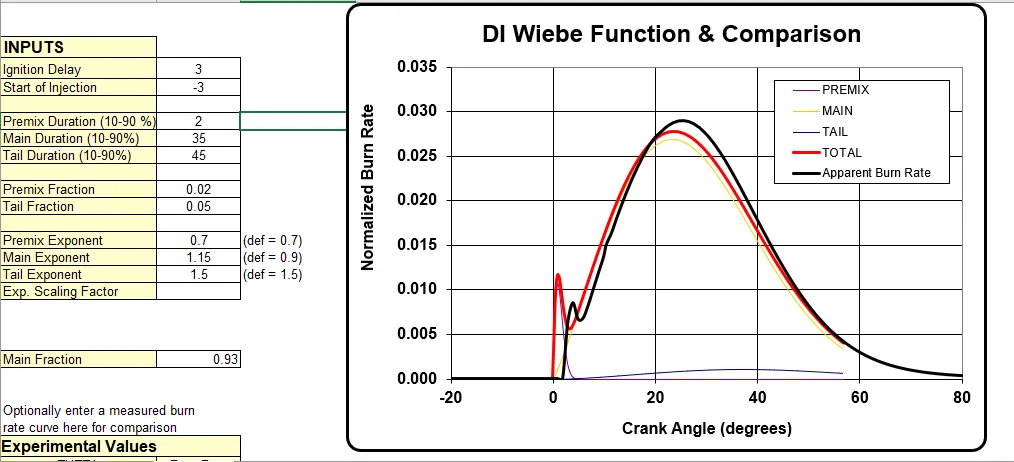
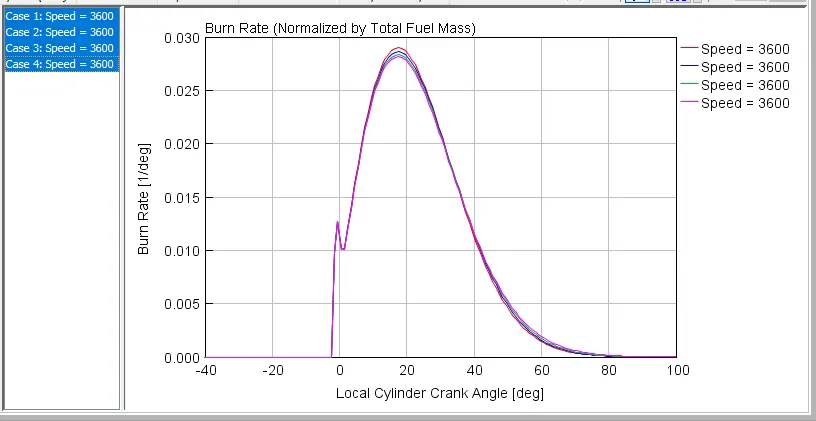
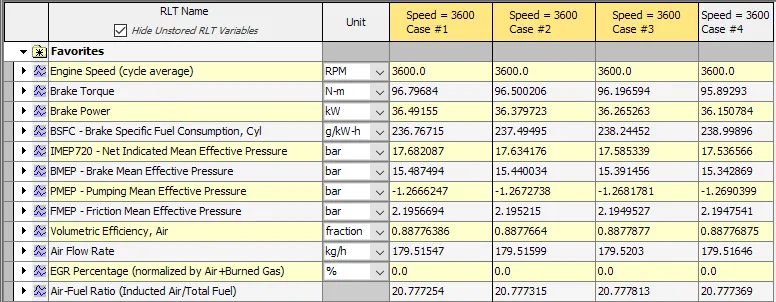
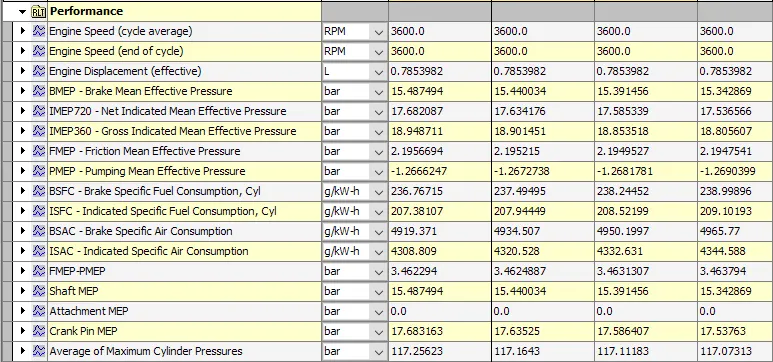

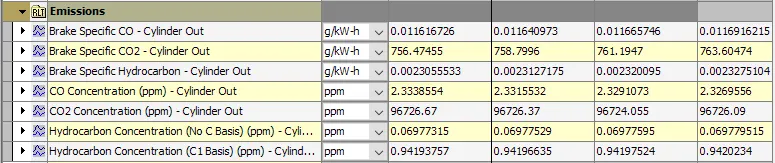
The whole combustion curve is divided into 4 parts i.e. ignition, premixed curve, main curve and tail curve. All of this part has its fraction and duration required to complet the curve therefore changing single parameter and keeping other paramters will show the change in performance parameters and combustion curve but this way does not lead us towards proper judgements. As the curve is made up of different phases, the duration required for completion of those phases is also important to study with the phase intake thus tail fraction should be studied with tail duration, premix fraction with premix duration.
5. Main Duration
Duration in crank-angle degrees of the main diffusion burn or the name of a dependency reference object. The duration should exclude the first 10% and the last 10% of the area under the main burn curve, i.e. the tails.
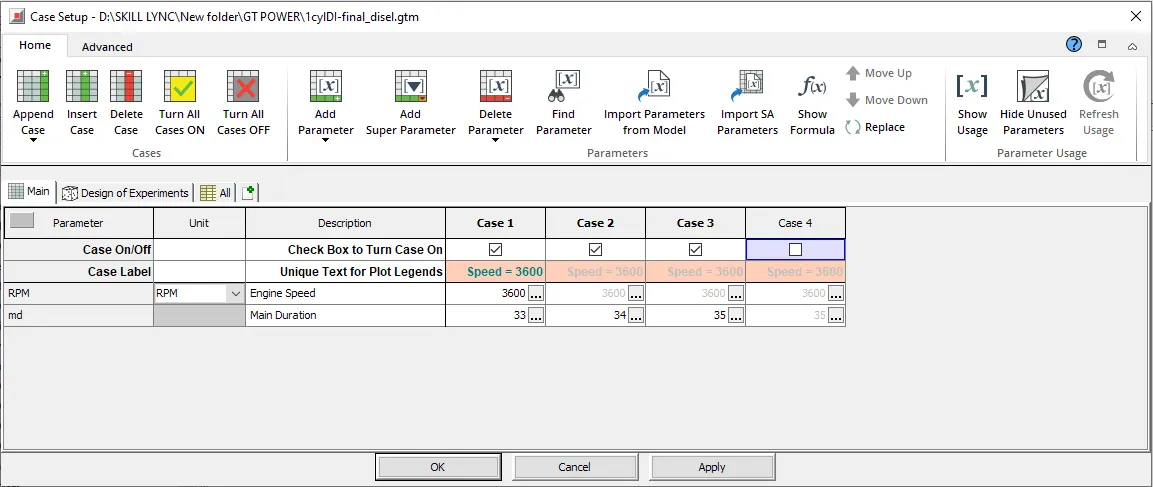
Comparision of SI Wiebe Burn Rate(Input data- changing single parameter) & Apperent Burn Rate
Case 1 - Main Duration =33
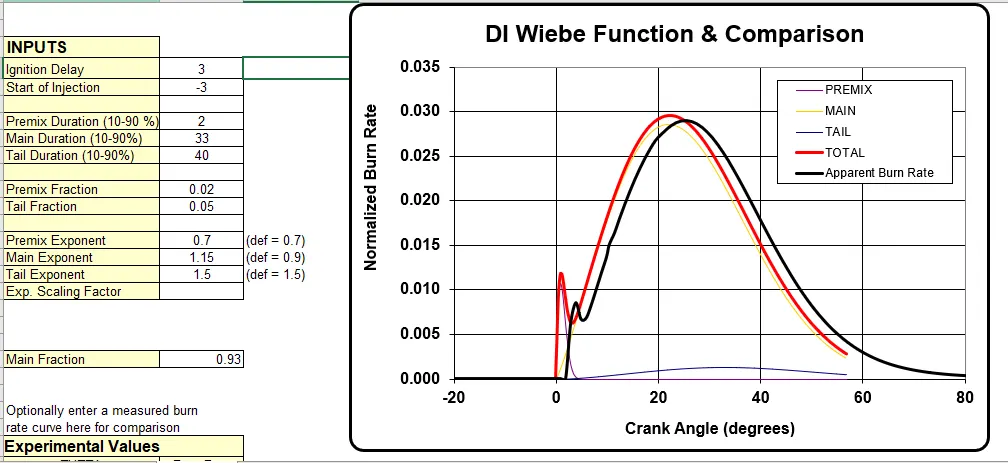
Case 2 - Main Duration =34
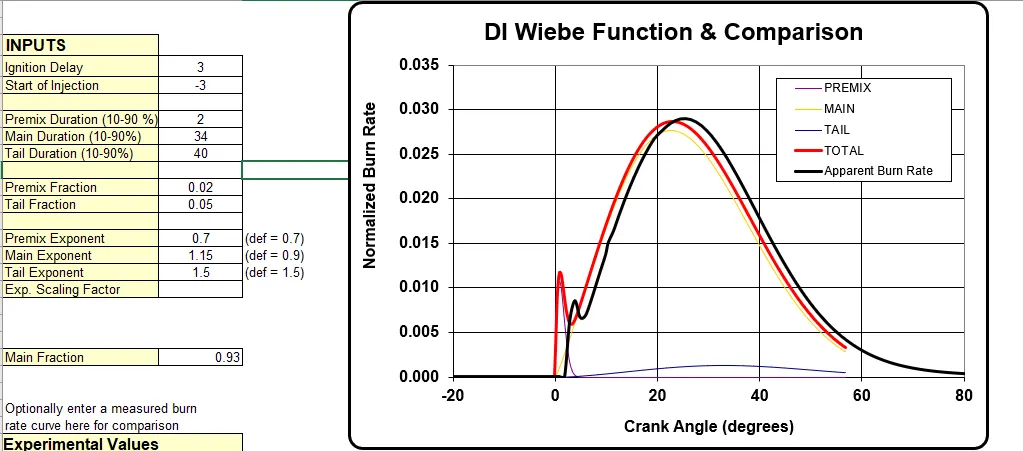
Case 3 - Main Duration =35
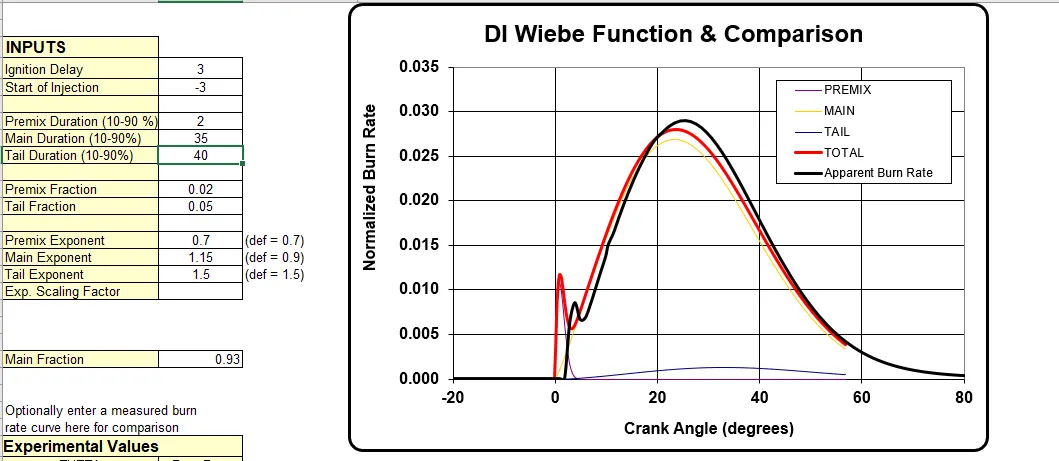
The main duration represents the duration required to complete combustion(excluding initial and final 10% of combustion process). Thus increase in main duration affects the combustion curve.
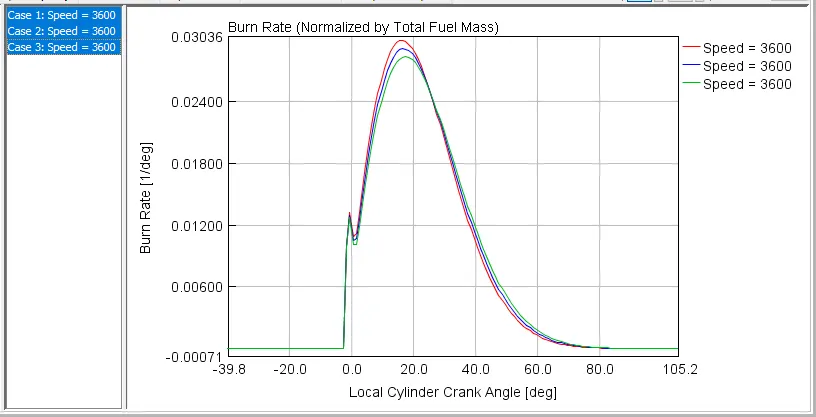
The above graph is a result obtained out of simulating CI engine by varying main duration value. It shows that at main duration increases expansion curve decreases and tail duration also displaces but endens at same point. For a higher expansion tail curve displacement is lesser.
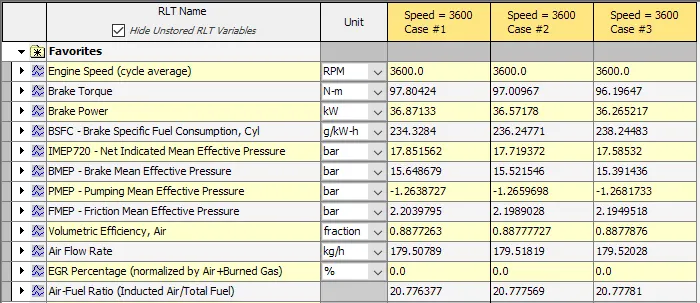
Increase in main duration affects the brake torque, it decreases with increase in main duration.
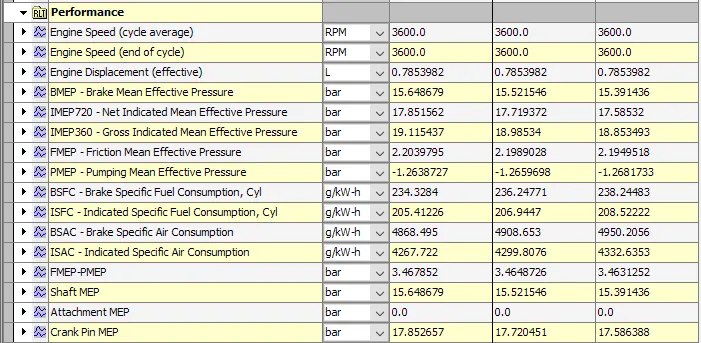

There is a increase in air and fule consumption (BSFC, BAFC and ISAC), avg. cyln. pressure decreases due to increase in main duration.
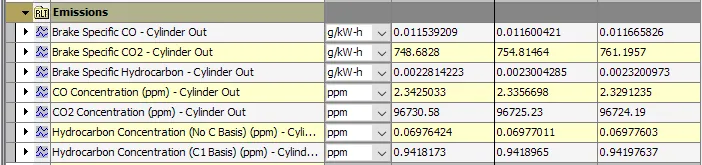
Looking at the emissions it can be seen that BS CO & CO2 increases and CO & CO2 concentration decreases.
From the above study we can say that MFB 50% in CI engine is a function of all the 6 parameters therefore trying to match a apperent burn curve by giving sutiable the input using these 6 parameters to CI Wiebe model can be
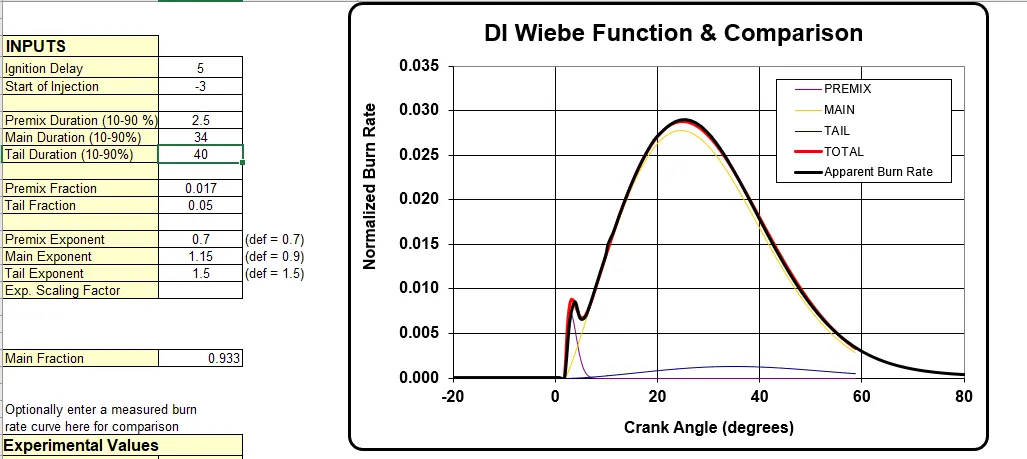
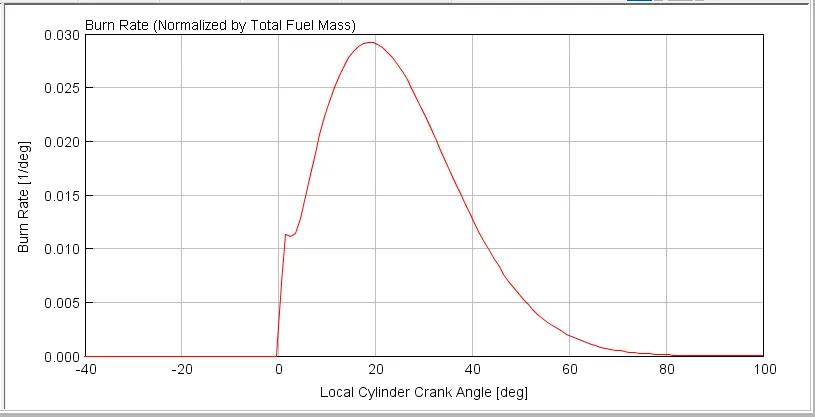
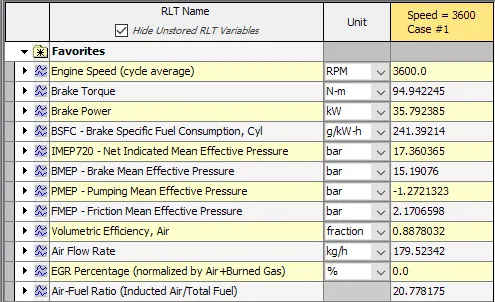
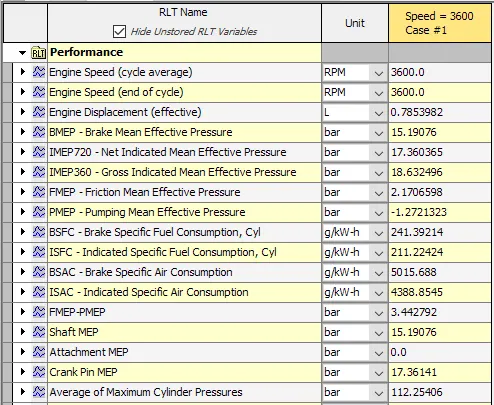
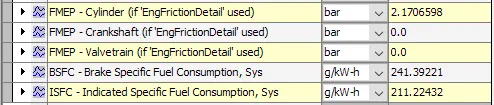
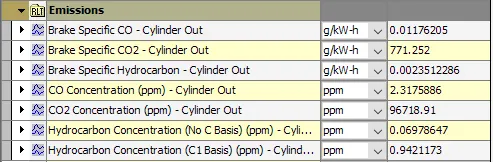
With compare to all the above six cases there is decrease in brake torque and power but BSFC and other emissions are reduces thus to produce higher power and higher torque and lesss emissions we can give varible input on the basis of above study.
And finally it can be said that combustion in a CI engines is much complicated than SI engine as CI engine combustion consist of different sages.