Assignment 4
Objective :
To analyse different material properties and to copmpare their results.
Procedure :
• Import the given file into hyperworks.
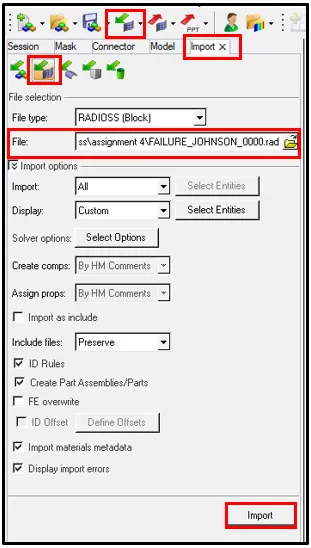
•The model will be imported.
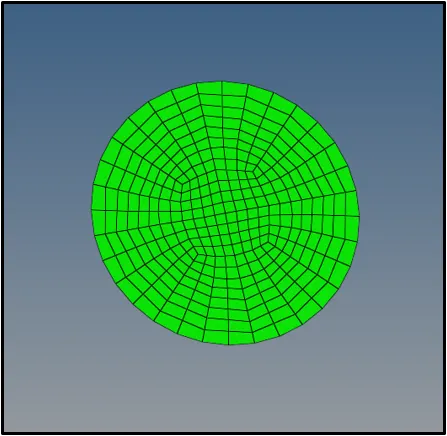
Case1 : Johnson -Cook material (PLAS_JOHNS)
This law defines an isotropic, linear elastic material using Hooke's law. This law represents a linear relationship between stress and strain. It is available for truss, beam (type 3 only), shell and solid elements.
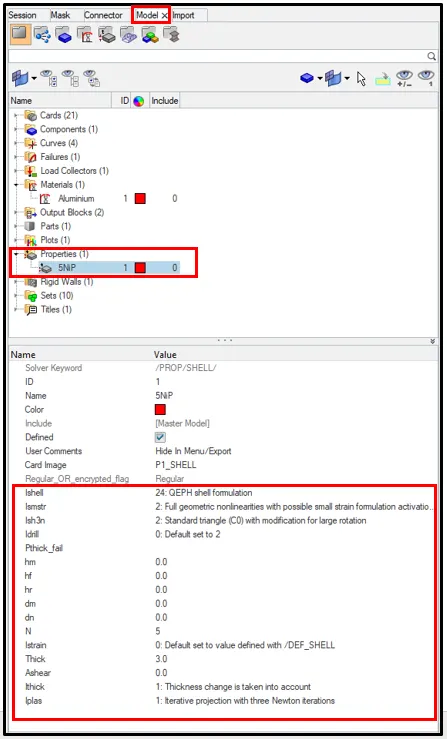
- Run the base simulation without changing any values.
- From the subpanel below, click on Analysis > Select the save location > click Radioss.
- Simulation will start.
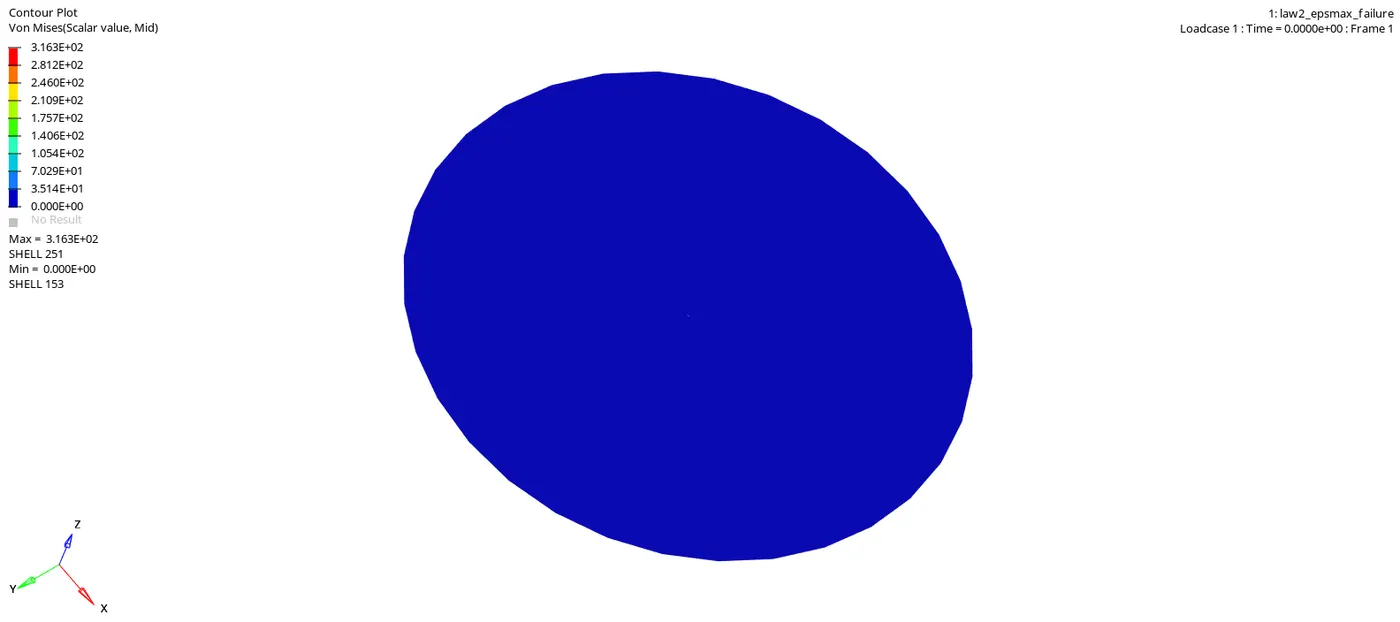
From the above simulation, the maximum stress acting was found to be 3.163E-02 and minimum was found to be 0.
- At the end of the simulation, do the energy error and mass error checks and determine whether results would be acceptable
- Open the save location file and click on the output file of the simulation to check for the Energy error and Mass error.
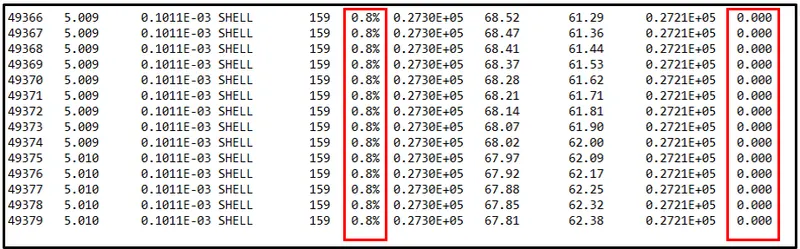
Maximum Energy error was found to be 0.8% and Maximum Mass error was found to be 0.
Plot the graph of rigid wall forces, internal energy, hourglass energy, contact energy, total energy of the simulations.
Graph for Internal Energy,Contact Energy,Total Energy and Hourglass Energy :
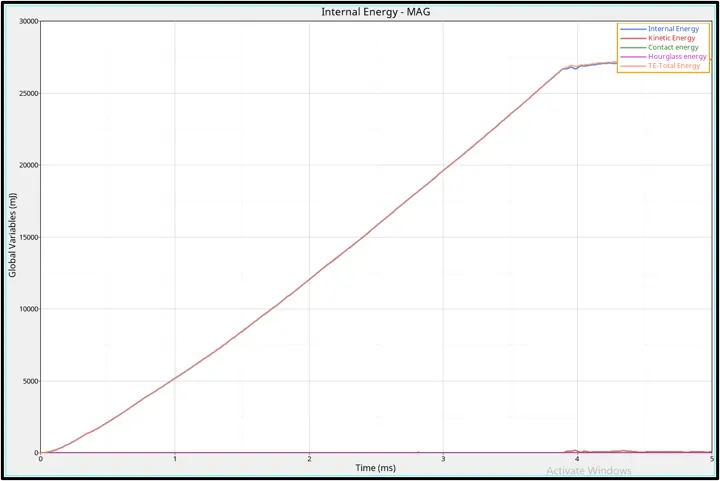
Contact energy and hourglass energy is costant because both are controlled by elements formulation.
Total and internal energy are increrasing w,r,t to time untill the component reaches complete failure, after that its constant wrt to time because when the rigid ball hits the plate the elements start to deform increases the internal energy and also the total energy. Once the elements break the internal energy and the total energy remains constant later with increase in time.
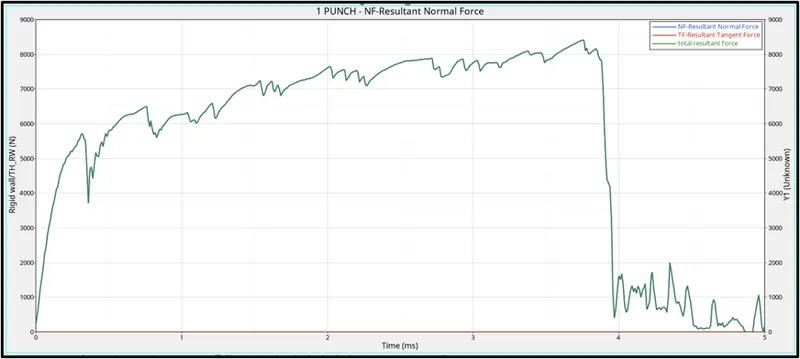
Rigid wall Forces graph :
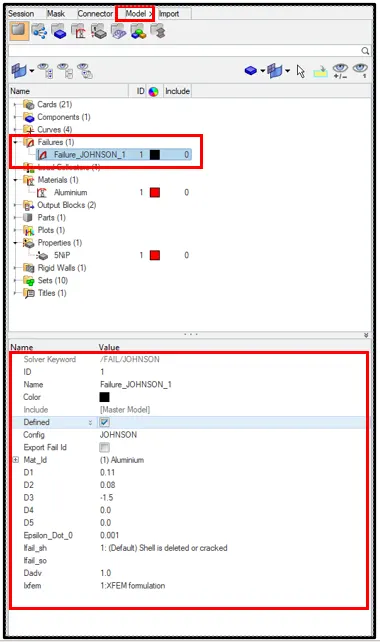
Case 2: In /fail/Johnson, change Ifail=1, Dadv=1 and Ixfem=1
This law represents an isotropic elasto-plastic material using the Johnson-Cook material model.
Change the value of Ifail, Dadv anf Ixfem as ,mentioned above.
- Run the base simulation without changing any values.
- From the subpanel below, click on Analysis > Select the save location > click Radioss.
- Simulation will start.
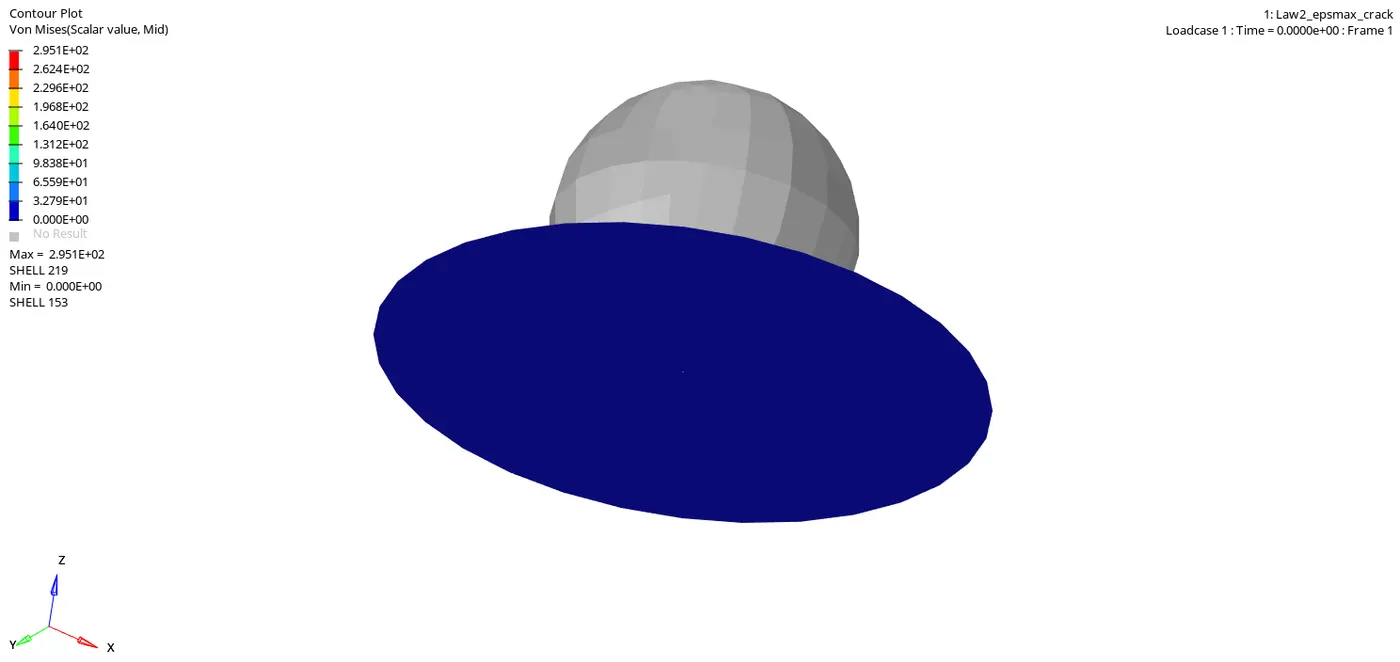
From the above simulation, the maximum stress acting was found to be 2.951E+02 and minimum was found to be 0.
- At the end of the simulation, do the energy error and mass error checks and determine whether results would be acceptable
- Open the save location file and click on the output file of the simulation to check for the Energy error and Mass error.
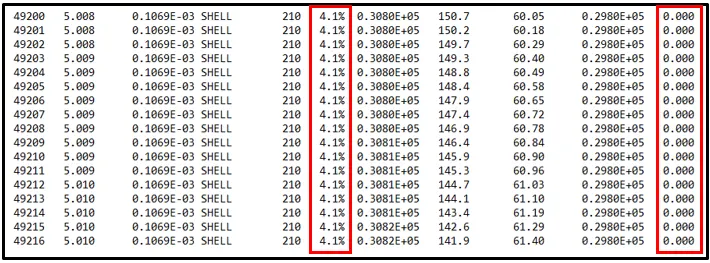
Maximum Energy error was found to be 4.1% and Maximum Mass error was found to be 0.
Plot the graph of rigid wall forces, internal energy, hourglass energy, contact energy, total energy of the simulations.
Graph for Internal Energy,Contact Energy,Total Energy and Hourglass Energy :
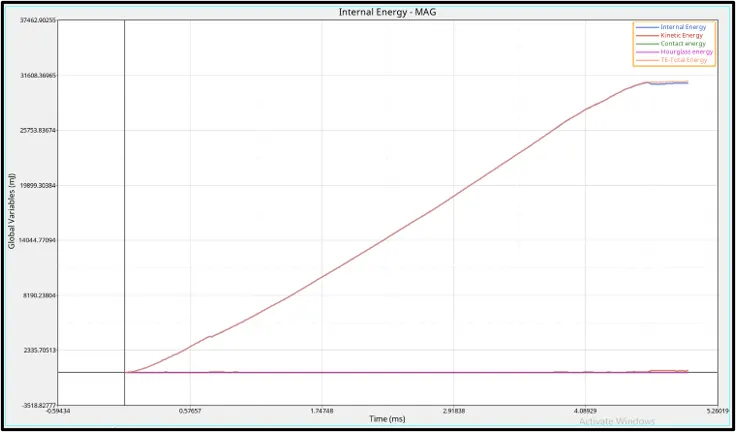
Contact energy and hourglass energy is costant because both are controlled by elements formulation.
Total and internal energy are increrasing w,r,t to time untill the component reaches complete failure, after that its constant wrt to time because when the rigid ball hits the plate the elements start to deform increases the internal energy and also the total energy. Once the elements break the internal energy and the total energy remains constant later with increase in time. In this case the elements take bit more time to break when compared to case 1.
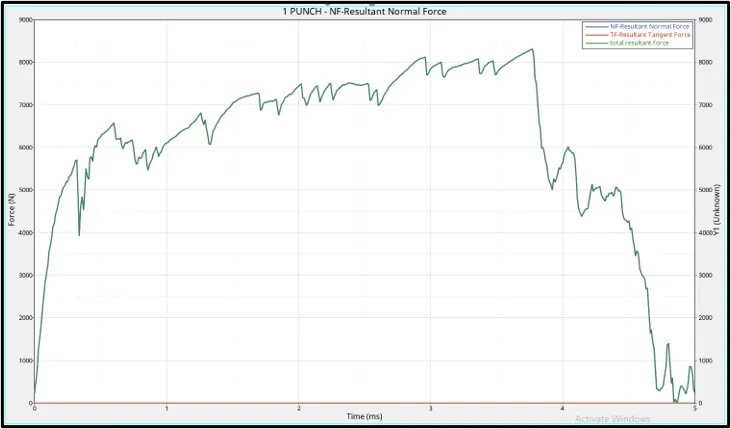
Rigid wall Forces graph :
Case 3: Delete/Fail/Johnson Card
The material card is same as the previous case. Delete the failure card in order to run the simulation.
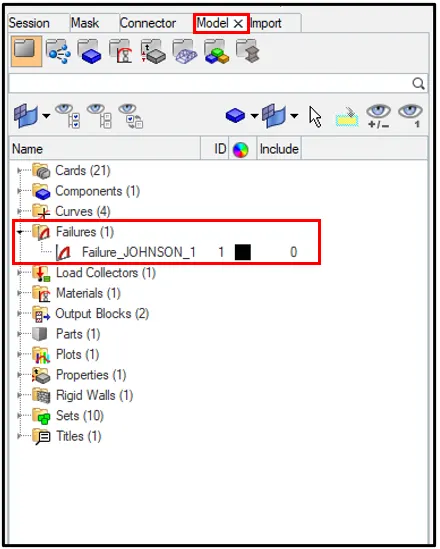
- Run the base simulation without changing any values.
- From the subpanel below, click on Analysis > Select the save location > click Radioss.
- Simulation will start.
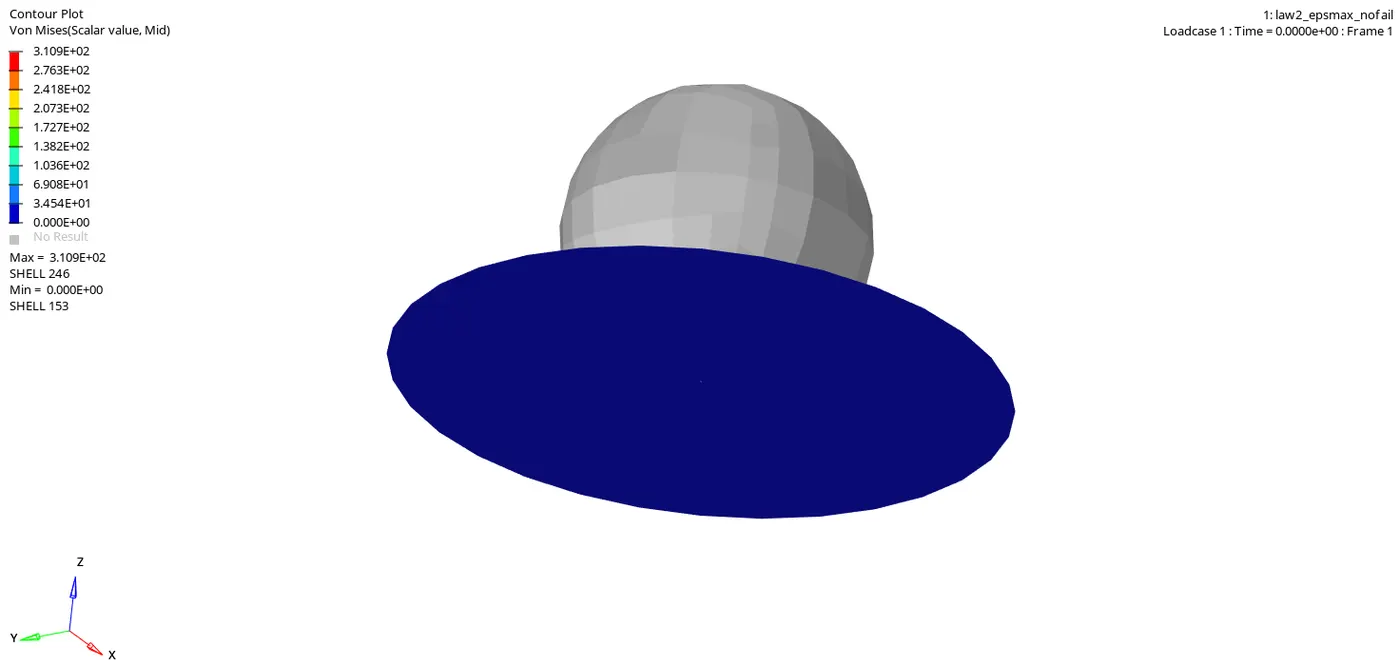
From the above simulation, the maximum stress acting was found to be 3.109E+02 and minimum was found to be 0.
- At the end of the simulation, do the energy error and mass error checks and determine whether results would be acceptable
- Open the save location file and click on the output file of the simulation to check for the Energy error and Mass error.
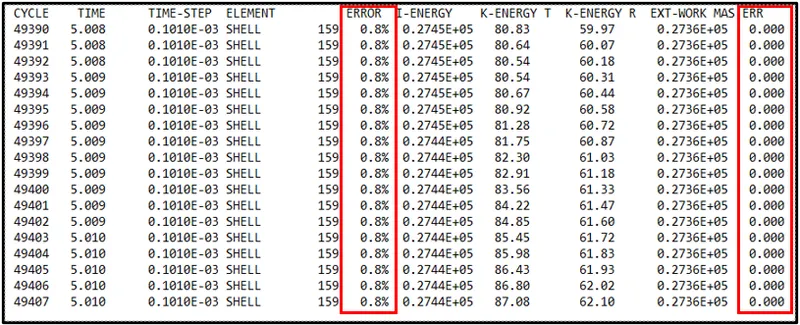
Maximum Energy error was found to be 0.8% and Maximum Mass error was found to be 0.
Plot the graph of rigid wall forces, internal energy, hourglass energy, contact energy, total energy of the simulations.
Graph for Internal Energy,Contact Energy,Total Energy and Hourglass Energy :
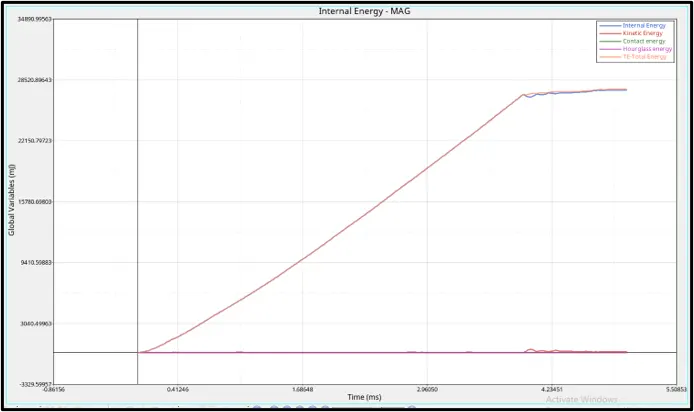
Contact energy and hourglass energy is costant because both are controlled by elements formulation.
Total and internal energy are increrasing w,r,t to time untill the component reaches complete failure, after that its constant wrt to time because when the rigid ball hits the plate the elements start to deform increases the internal energy and also the total energy. Once the elements break the internal energy and the total energy remains constant later with increase in time. In this case, the elements breaks with less energy and less time when compared to case 1 and case 2.
Rigid wall Forces graph :
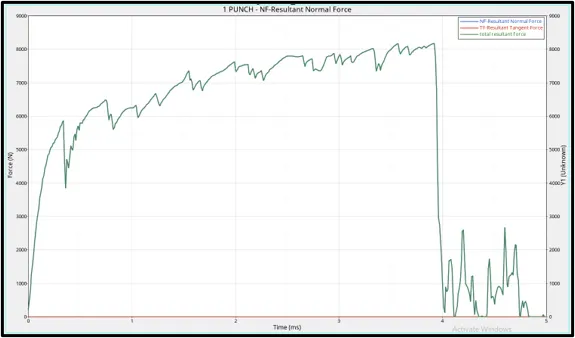
Case 4 :
Delete the value of EPS_p_max
If a higher stress is applied to the material, there will be elastic strain, but there will also be some amount of inelastic or plastic strain. This type of strain is caused by rearrangement of the atoms in the material and is not reversible. When the stress is removed the plastic deformation remains in the material.
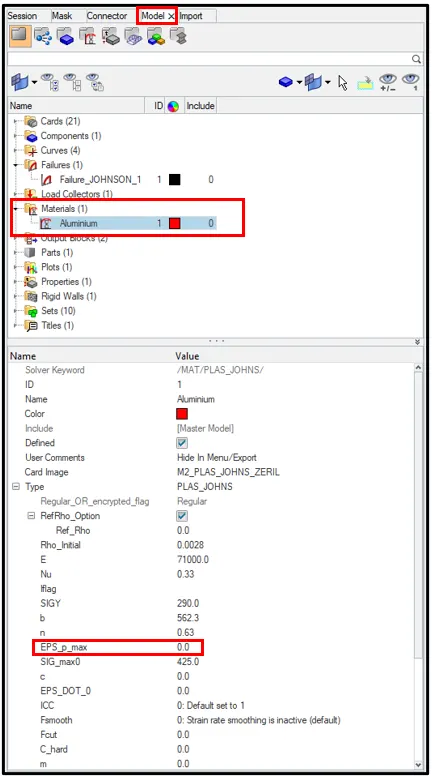
- Run the base simulation without changing any values.
- From the subpanel below, click on Analysis > Select the save location > click Radioss.
- Simulation will start.
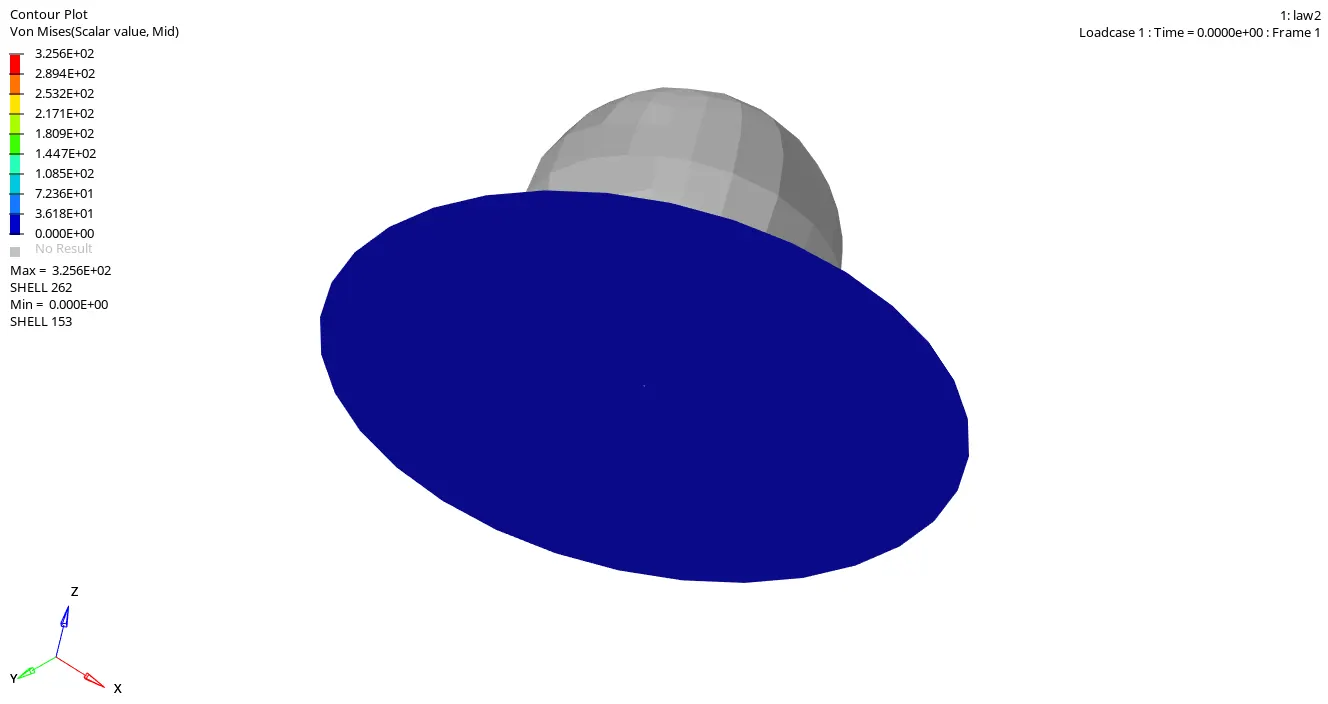
From the above simulation, the maximum stress acting was found to be 3.256E+02 and minimum was found to be 0.
- At the end of the simulation, do the energy error and mass error checks and determine whether results would be acceptable
- Open the save location file and click on the output file of the simulation to check for the Energy error and Mass error.
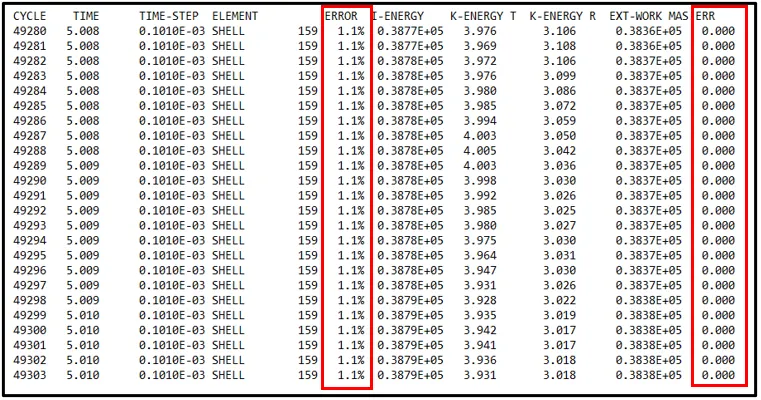
Maximum Energy error was found to be 1.1% and Maximum Mass error was found to be 0.
Plot the graph of rigid wall forces, internal energy, hourglass energy, contact energy, total energy of the simulations.
Graph for Internal Energy,Contact Energy,Total Energy and Hourglass Energy :
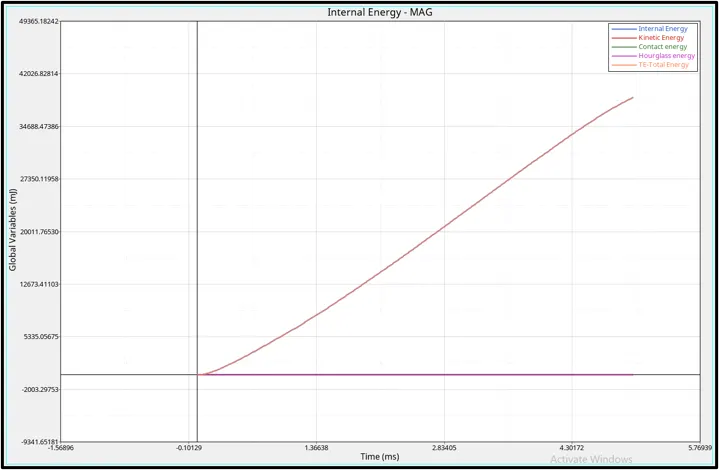
In this case, the Total energy and the Internal energy are increasing with increase in time, while the contact energy and hourglass energies are kept constant.
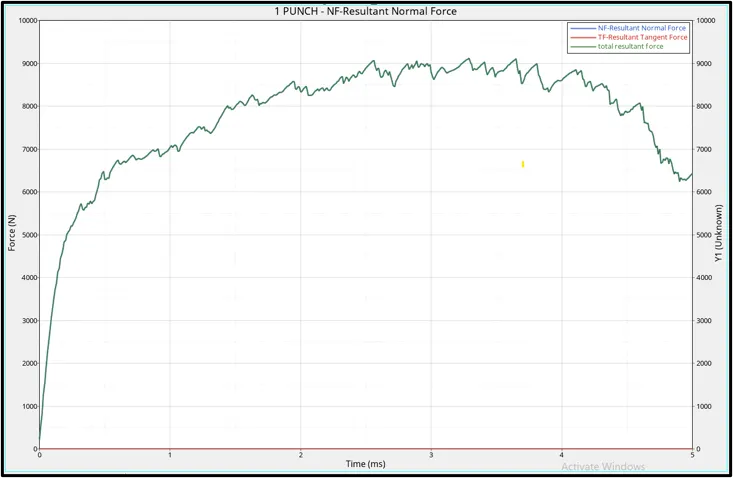
Rigid wall Forces graph :
Case 5:
Convert the material Model to Law1 Elastic with same density,E,Nu and Run.
This law defines an isotopic, linear elastic material using Hooke's law. This law represents a linear relationship between stress and strain. It is available for truss, beam , shell and solid elements.
Change the card image to M1_ELAST.
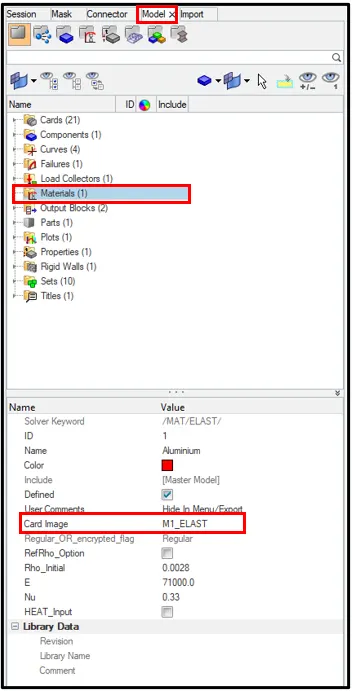
- Run the base simulation without changing any values.
- From the subpanel below, click on Analysis > Select the save location > click Radioss.
- Simulation will start.
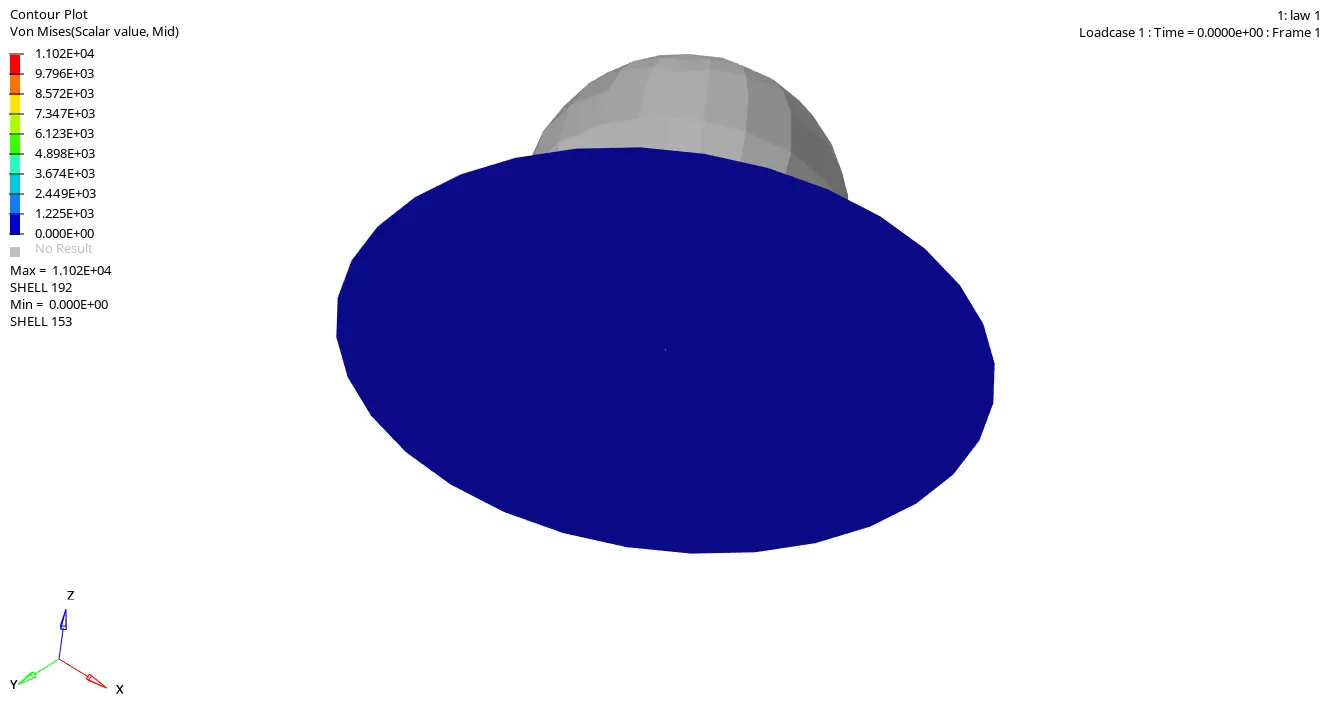
From the above simulation, the maximum stress acting was found to be 1.102E+04 and minimum was found to be 0.
- At the end of the simulation, do the energy error and mass error checks and determine whether results would be acceptable
- Open the save location file and click on the output file of the simulation to check for the Energy error and Mass error.
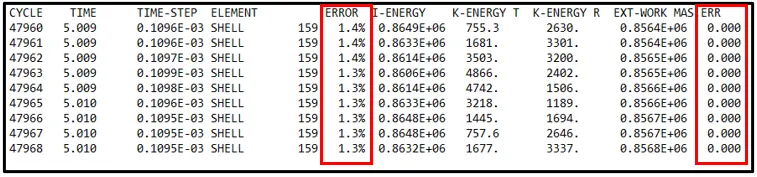
Maximum Energy error was found to be 1.3% and Maximum Mass error was found to be 0.
Plot the graph of rigid wall forces, internal energy, hourglass energy, contact energy, total energy of the simulations.
Graph for Internal Energy,Contact Energy,Total Energy and Hourglass Energy :
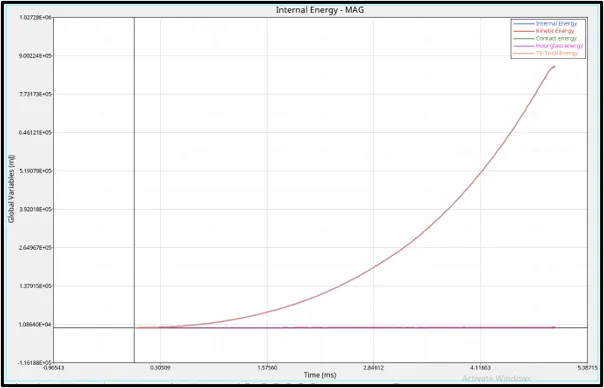
In this case, the Total energy and the Internal energy are increasing with increase in time because the while the contact energy and hourglass energies are kept constant.
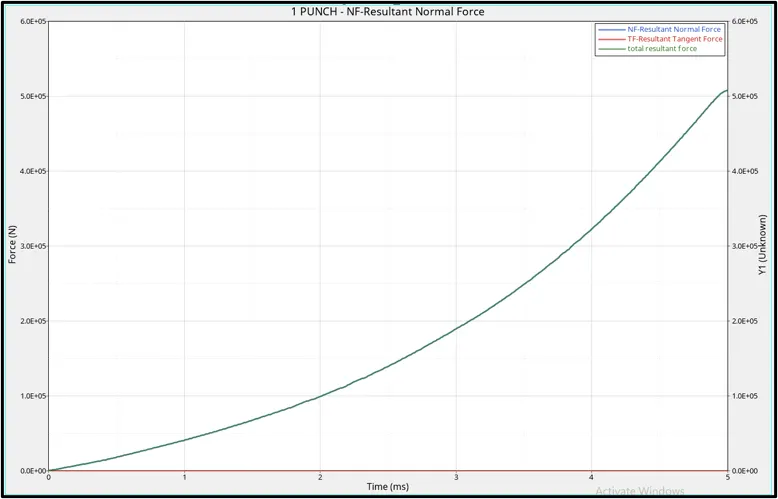
Rigid wall Forces graph :
Case 6 :
Law_27 PLAST_BRIT_Material Application
This law combines an isotropic elasto-plastic Johnson-Cook material model with an orthotropic brittle failure model. Material damage is accounted for prior to failure. Failure and damage occur only in tension. This law is applicable only for shells.
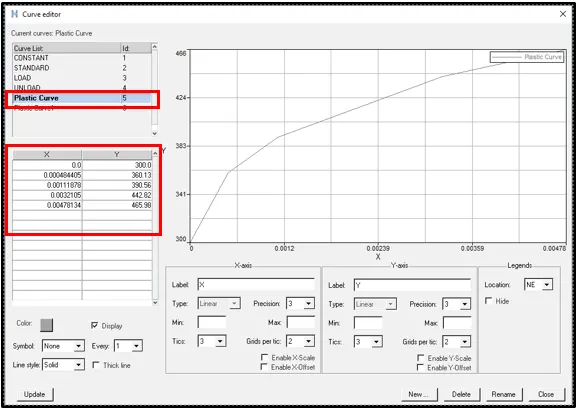
This is a tabulated law, therefore the true stress versus plastic strain function can be directly used. The rupture phase can be simulated by adding points to this hardening function.
- Run the base simulation without changing any values.
- From the subpanel below, click on Analysis > Select the save location > click Radioss.
- Simulation will start.
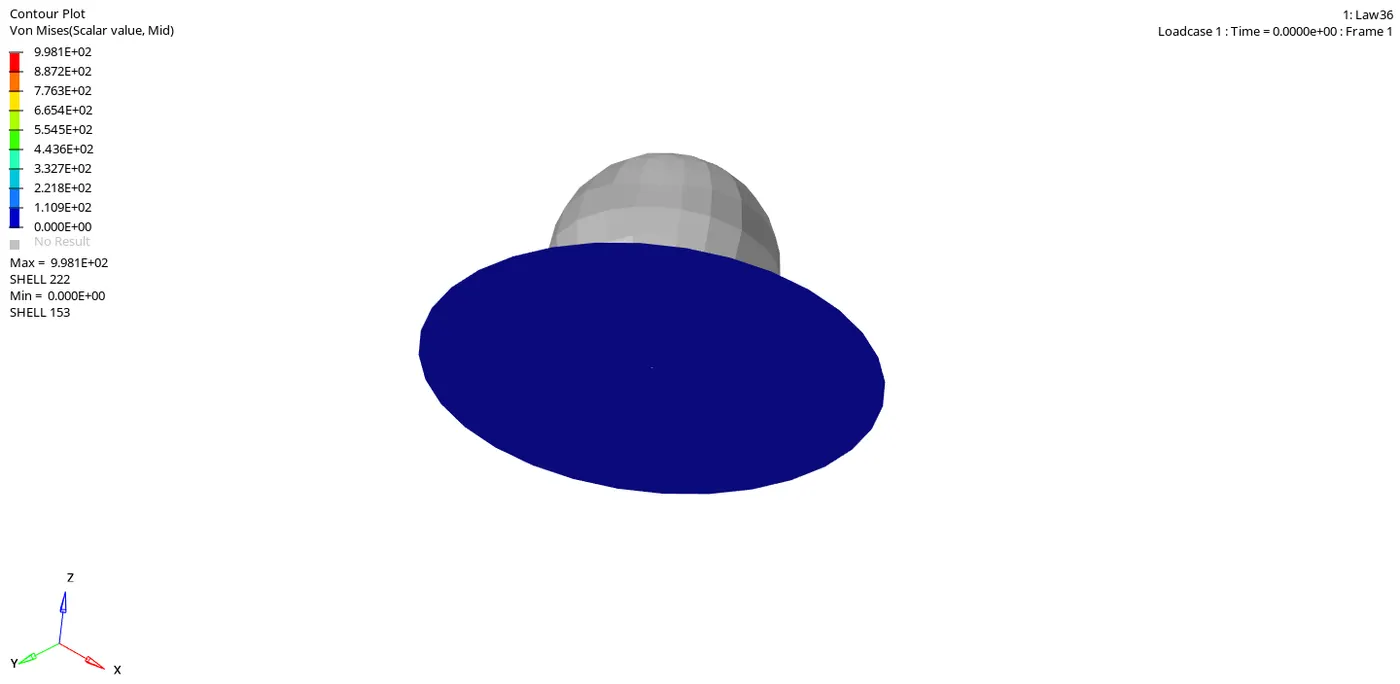
From the above simulation, the maximum stress acting was found to be 9.981E+02 and minimum was found to be 0.
- At the end of the simulation, do the energy error and mass error checks and determine whether results would be acceptable
- Open the save location file and click on the output file of the simulation to check for the Energy error and Mass error.
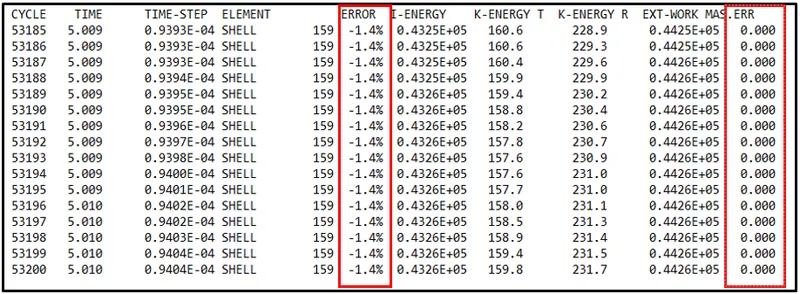
Maximum Energy error was found to be 1.4% and Maximum Mass error was found to be 0.
Plot the graph of rigid wall forces, internal energy, hourglass energy, contact energy, total energy of the simulations.
Graph for Internal Energy,Contact Energy,Total Energy and Hourglass Energy :
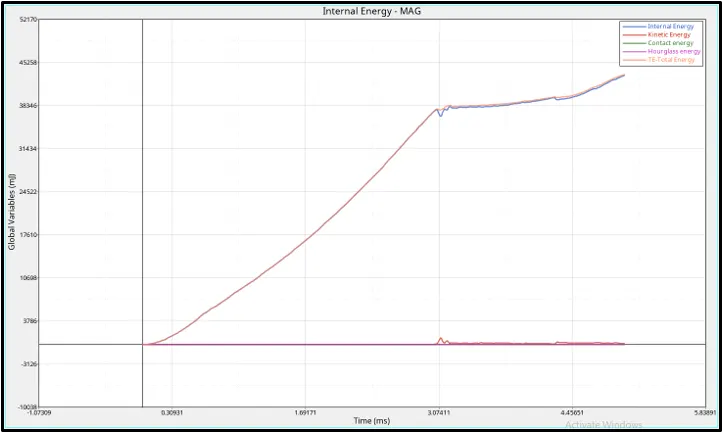
Total and internal engergys are increrasing w,r,t to time untill the component reaches complete failure, after that its slightly increasing wrt to time.
Similiarly, the hourglass energy in this case is has a minimal increase in between w.r.t time, while the contact energy is constant.
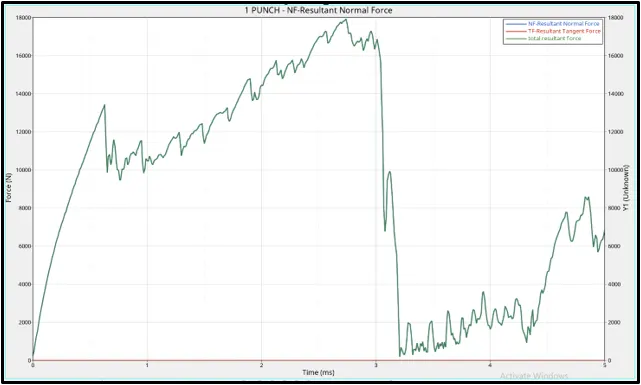
Rigid wall Forces graph :
Case 7 :
/MAT/LAW36 (PLAS_TAB):
This law models an isotropic elasto-plastic material using user-defined functions for the work-hardening portion of the stress-strain curve (for example, stress vs. plastic strain) for different strain rates.
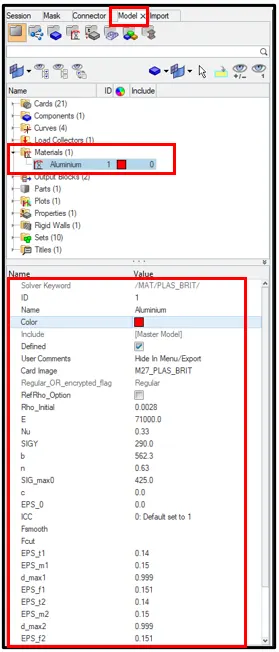
- Run the base simulation without changing any values.
- From the subpanel below, click on Analysis > Select the save location > click Radioss.
- Simulation will start.
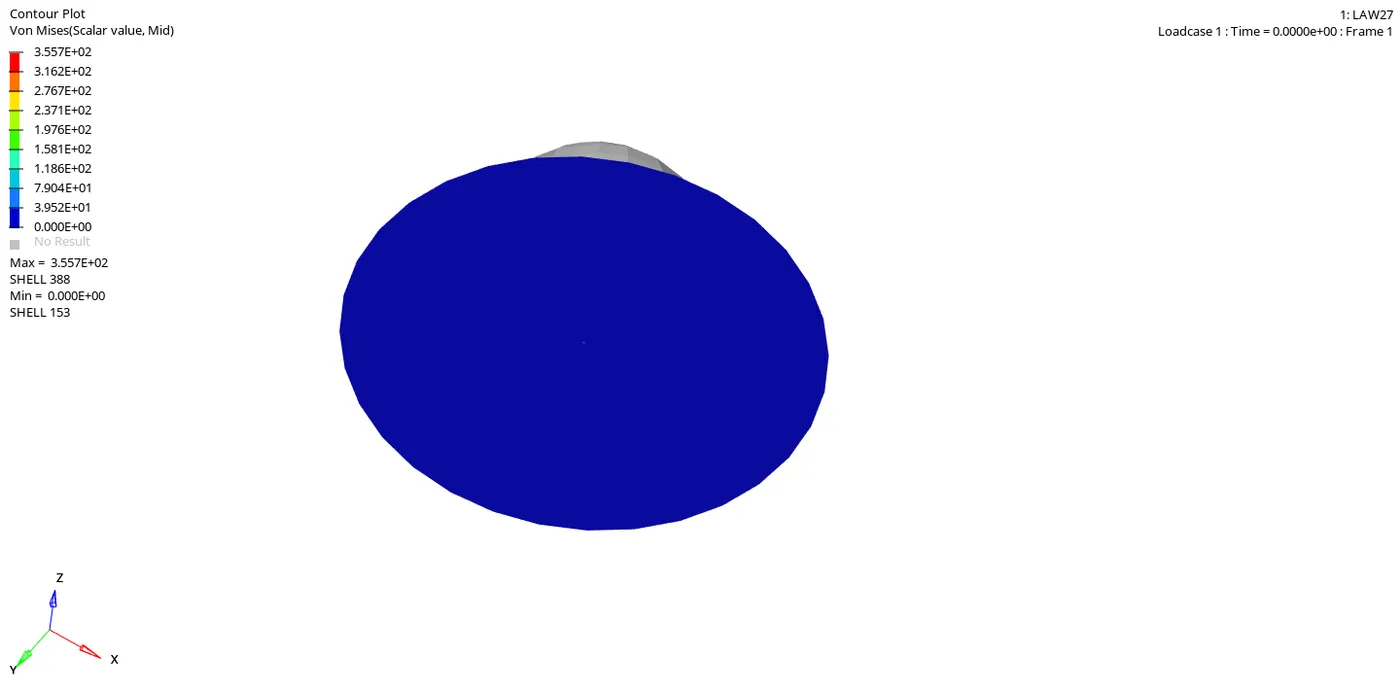
From the above simulation, the maximum stress acting was found to be 3.557E+02 and minimum was found to be 0.
- At the end of the simulation, do the energy error and mass error checks and determine whether results would be acceptable
- Open the save location file and click on the output file of the simulation to check for the Energy error and Mass error.
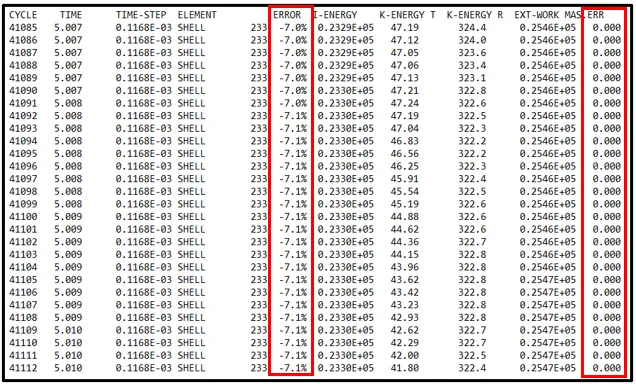
Maximum Energy error was found to be 7.1% and Maximum Mass error was found to be 0.
Plot the graph of rigid wall forces, internal energy, hourglass energy, contact energy, total energy of the simulations.
Graph for Internal Energy,Contact Energy,Total Energy and Hourglass Energy :
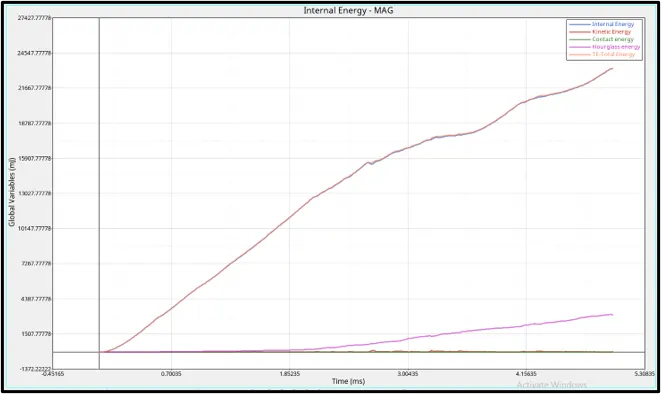
Total and internal engergys are increrasing w,r,t to time untill the component reaches complete failure, after that its slightly increasing wrt to time.
Similiarly, the hourglass energy in this case is increasing w.r.t time, while the contact energy is constant.
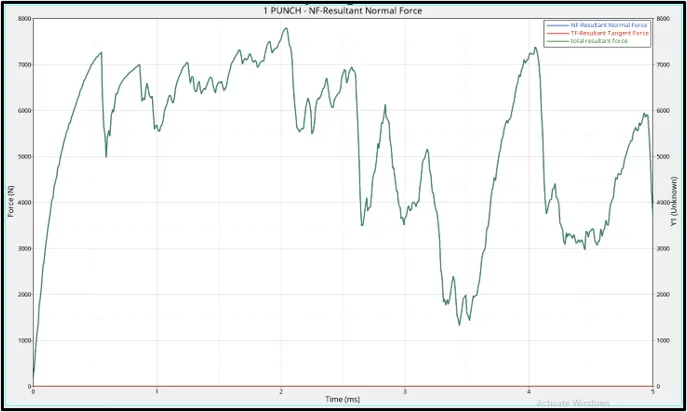
Rigid wall Forces graph :
Conclusion :
For every change in parameter, the result will vary as per the given values. Different materials have different material properties which need to be studied well in order to produce better simulation results.