Assignment 3
Aim:
To Comparing the results with base simulation and improved shell element properties.
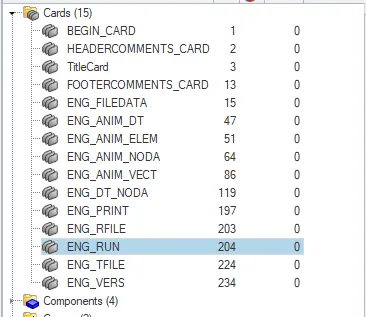
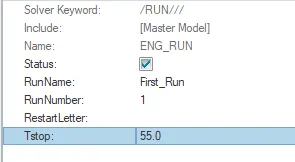
1. Changing the run time to 55s
Cards -> ENG_RUN -> Tstop(55s)
2. Changing the number of animation steps
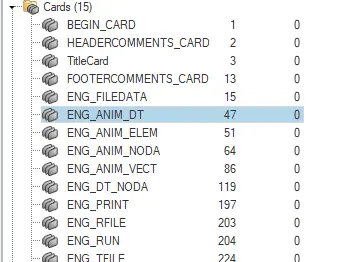
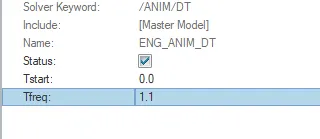
Cards -> ENG_ANIM_DT ->Tfreq
To have the animation steps with minimum 25 and maximum 60. So Tfreq should be between the minimum and maximum,therefore 55/50=1.1.
This value is taken as Tfreq(1.1).
There appers a block
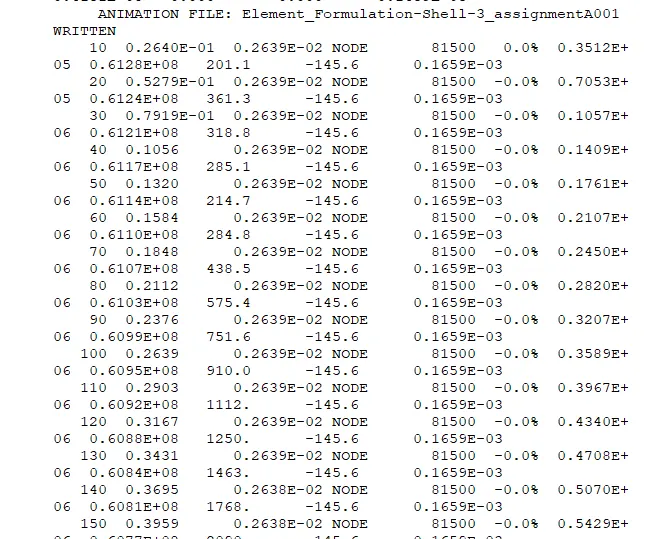
Plotting of graph and the beam:
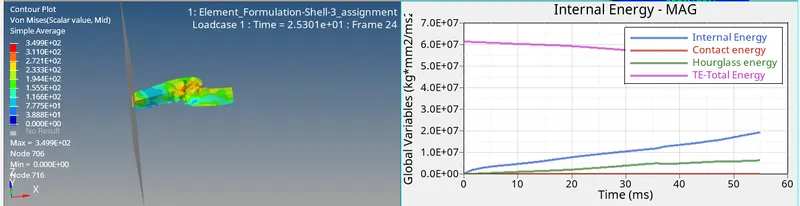
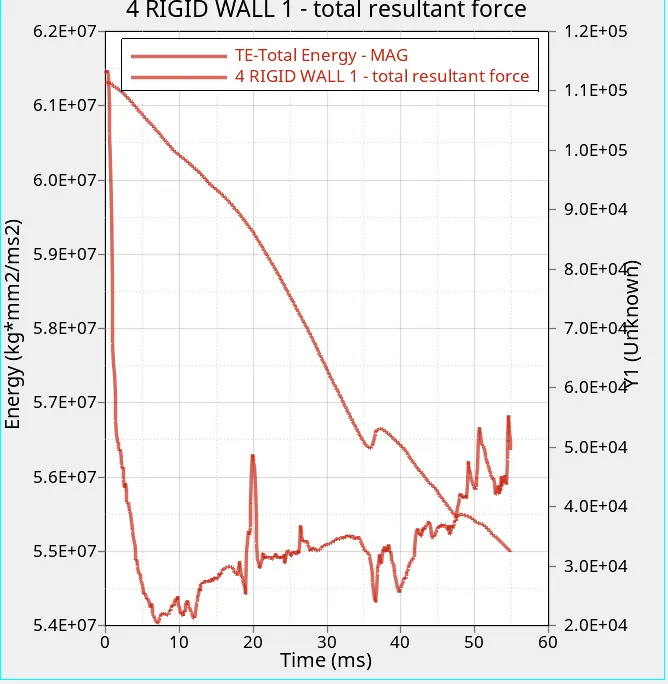
The separate plot for the individual
Rigid wall Force
Internal Energy
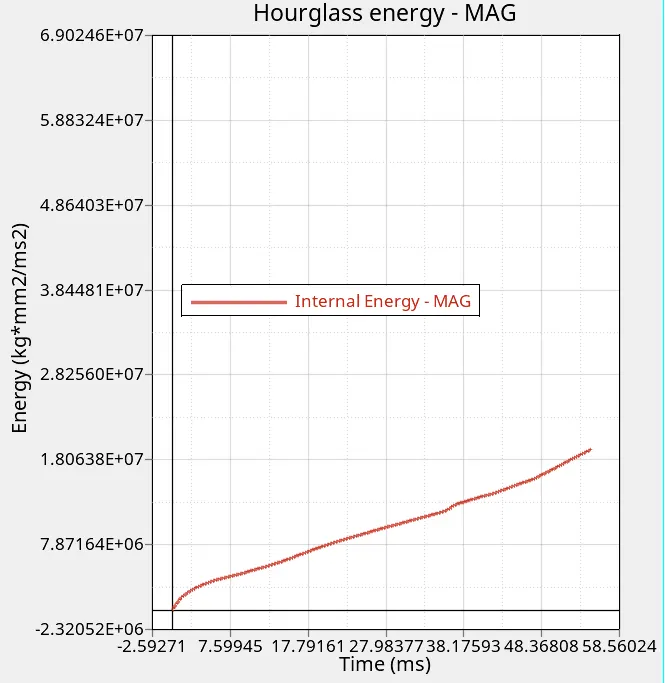
Hourglass Energy
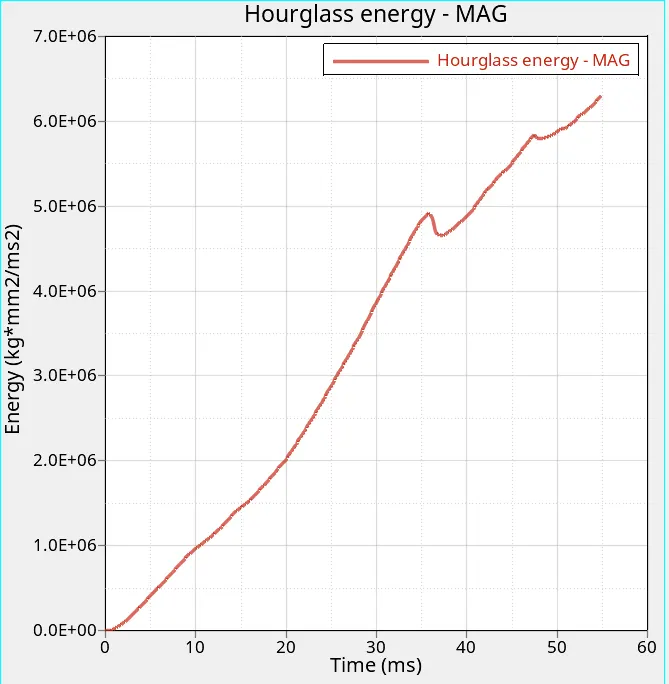
Contact Energy
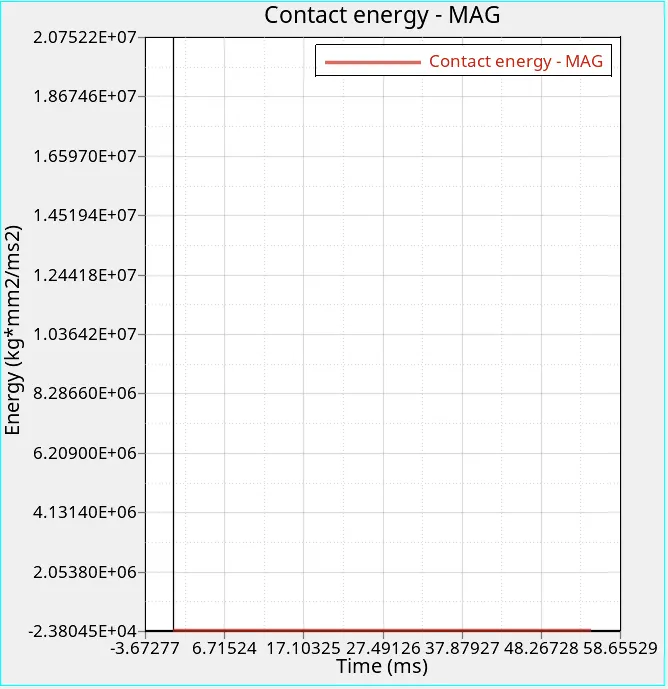
Total Energy
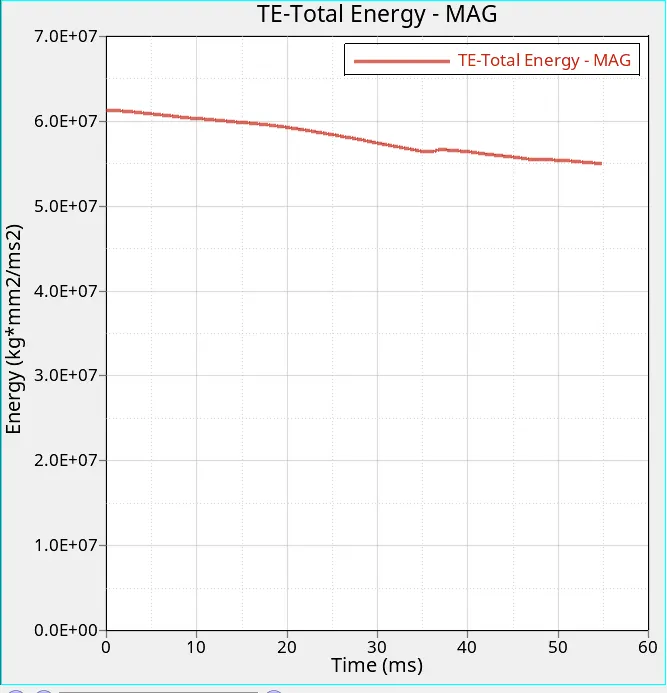
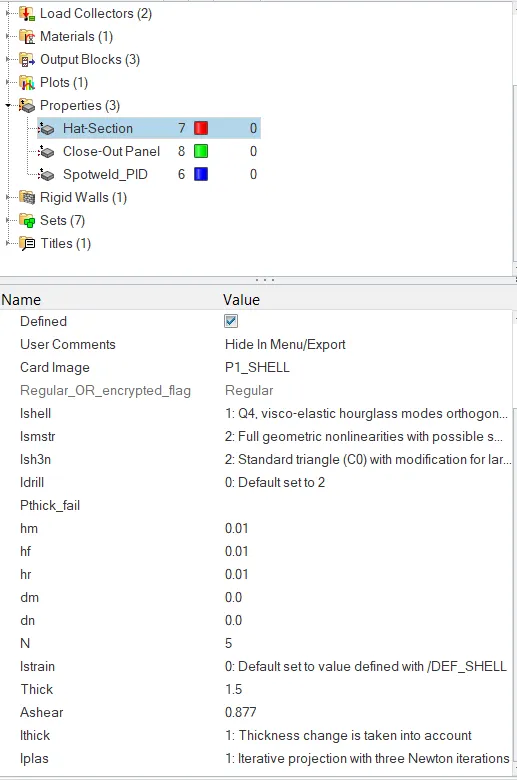
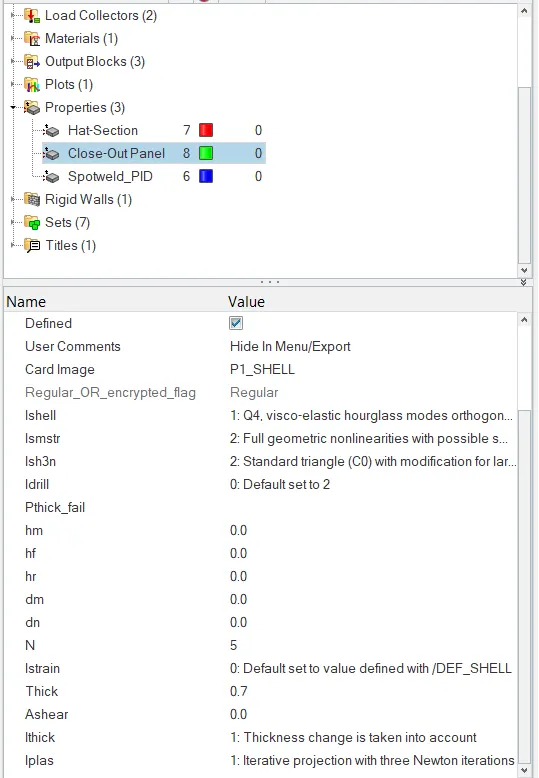
Changing all the shell elements properties to recommended properties
| Parameters | |
|
Ishell =24 |
|
|
Ismstr=2 |
|
|
Ish3n=2 |
|
| N=5 | |
|
Ithick=1 |
|
|
Iplas=1 |
On changing all the shell properties we get a graph shown below,
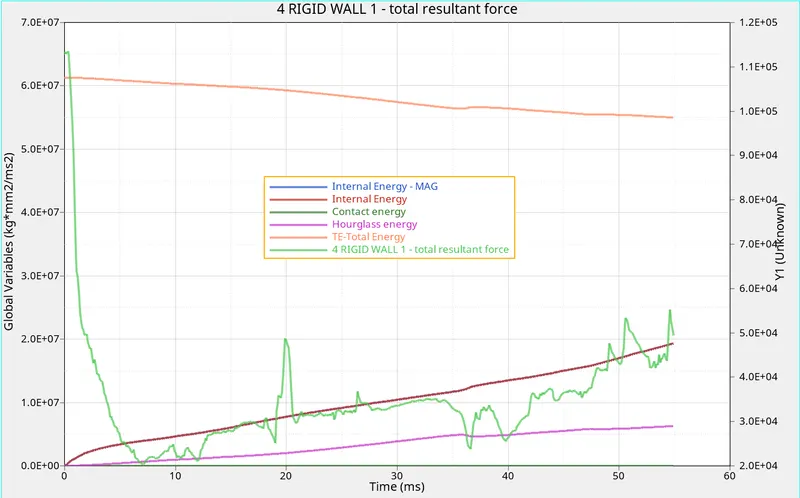
Case 1 - Before shell properties
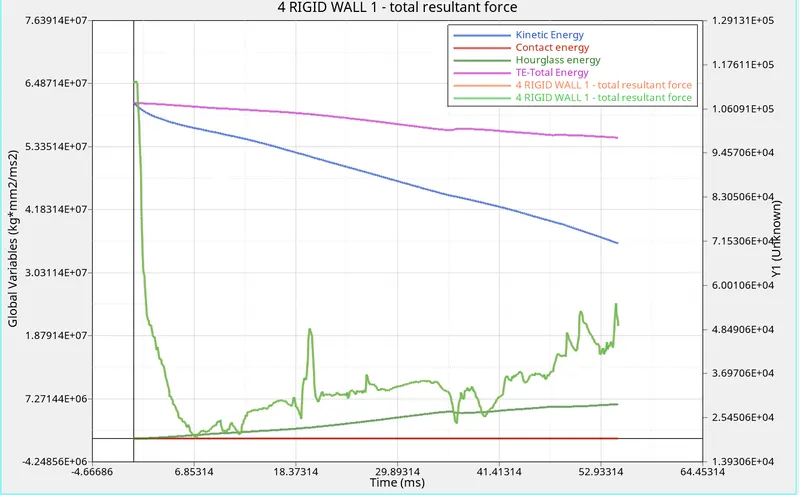
Case 2 - After shell properties
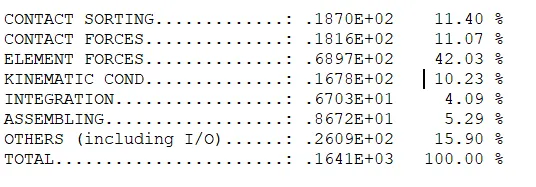
Conclusion:
As the first graph its shows the values which is approximate and once the shell properties is added to the material it started to show the values which is suited for it to act.
Result:
From the above the beam is measured with and without the shell properties and studied each and individual shell properties.