Analyzing the Education trends in Tamilnadu
Project 1 - Analyzing the Education trends in Tamilnadu
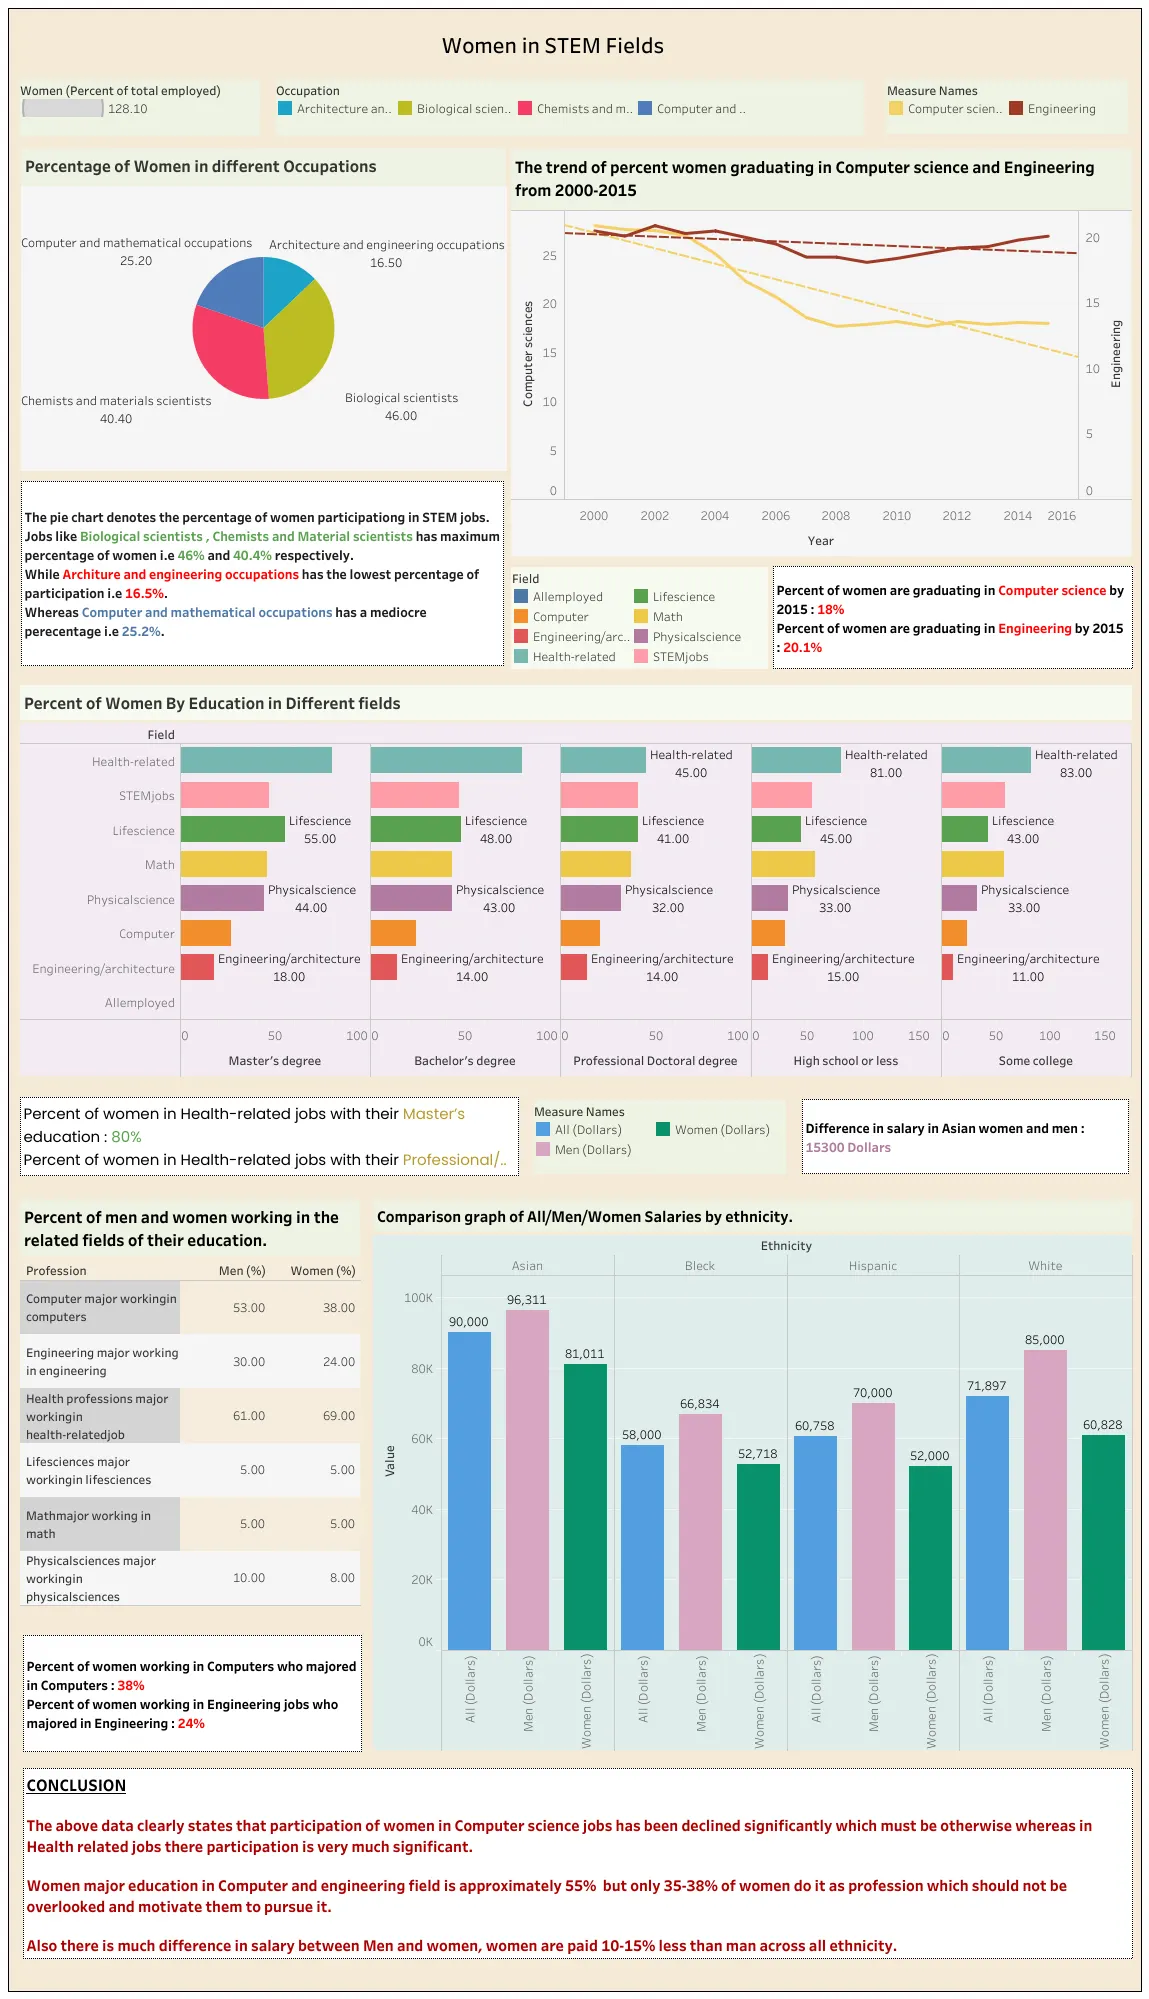
This dashboard empowers mission-driven organizations to harness the power of data visualization for social change. Women are tracked away from science and mathematics throughout their education, limiting their training and options to go into these fields as adults. The data set contains the data of women who graduated by years, employed persons, STEM jobs by Education, and Salary comparison. This dashboard addresses some major gaps between Men and Women in STEM (Science, Technology, Engineering & Mathematics) fields.
General Requirements
The dashboard should look like an article predicting the basic issues.
Business Requirements
Title: Women in STEM Fields.
-A pie graph of women in
Biological Scientists
Chemists & Materials Scientists
Computer & Mathematical Occupations
Engineers & Architects
-The trend of the percent women graduating in Computer science and Engineering from 2000-2015
-A bar graph of what percent of women are in stem jobs by education in which field.
-Show a cross tab of men and women working in the related fields of their education.
-A comparison graph of All/Men/Women Salaries by ethnicity.