Analysis and Comparison of different Contact Interfaces and Notch significance in a Crash Box model in Radioss
Aim:
1) Simulating different cases for contact interface. The cases are as follows;
- Run the crash tube model as it is.
- Change the Inacti=6 and run.
- Create the type 11 contact and run.
- Remove both notches and remove boundary condition on rigid body node then run.
- Create a new notch in the middle ,select the whole section and run.
- Create a new notch with nodes only from opposing 2 faces and run.
2) Plotting RWALL forces ,contact forces,internal energy and comparing results for all cases.
Procedure:
Contact and Interfaces:
1. Contact Types:
1) Case 1: Run the crash tube model as it is (Type 7 Contact).
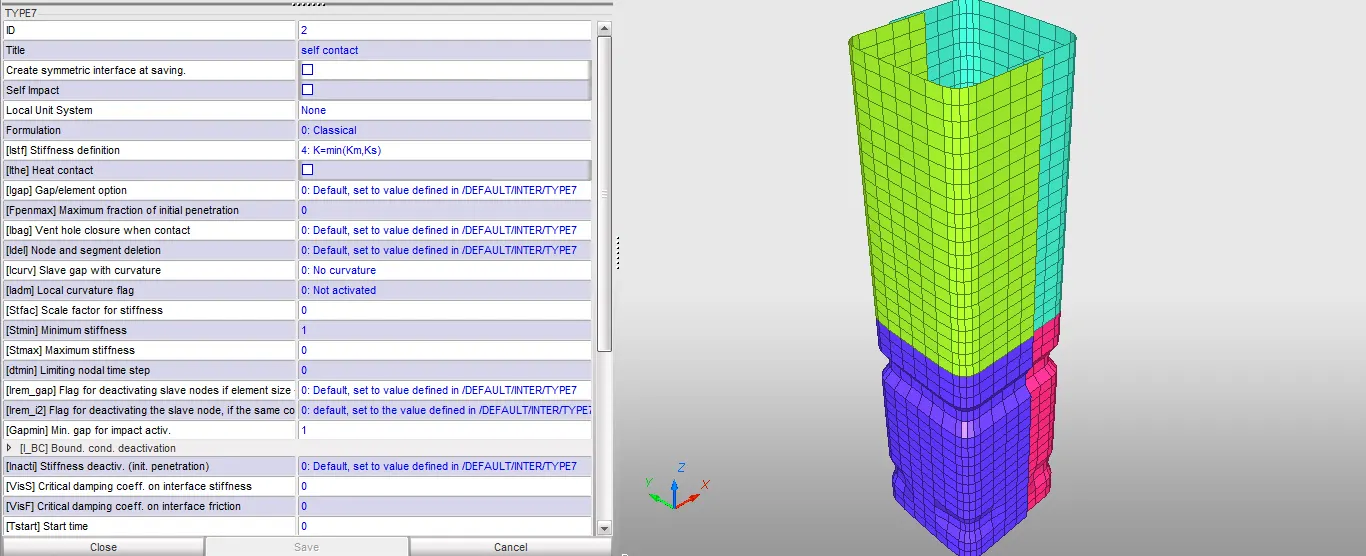
1) In this case we run the crash tube model as it is without changing the parameters in Hypercrash as shown in the image given below.
2) We then, import the .rad file in Hyperworks and then, run the simulation using the radioss option under analysis module as shown in the image given below.

3) We look out for the energy error and mass error in '0001.out' in the form of the text editor as shown in the image given below.
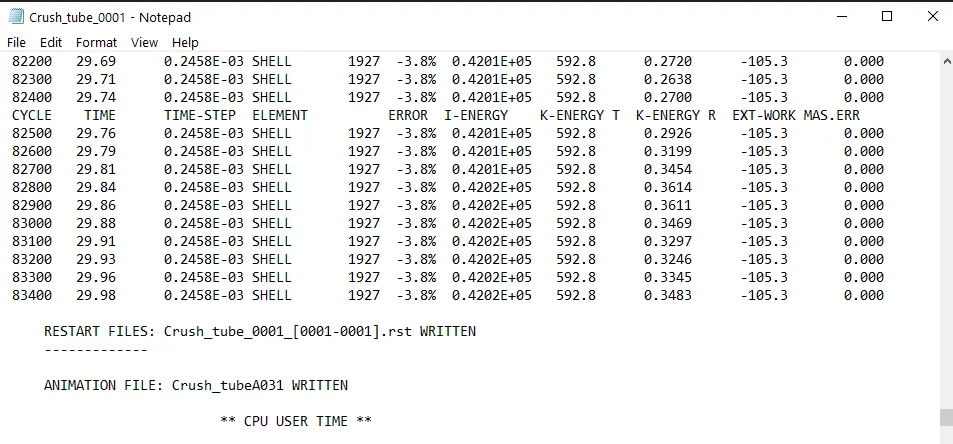
Energy Error: -3.8%
Mass Error: 0
Elapsed Time: 203.08 secs
No of Cycles: 83469
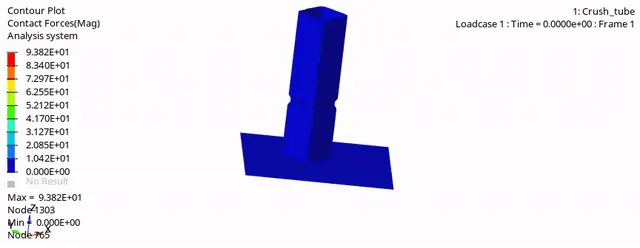
4) We go to Hyperview and import the file '.h3d' then, we check for contour plot on Von mises stress with simple average method and Contact forces in the form of animations as shown below.
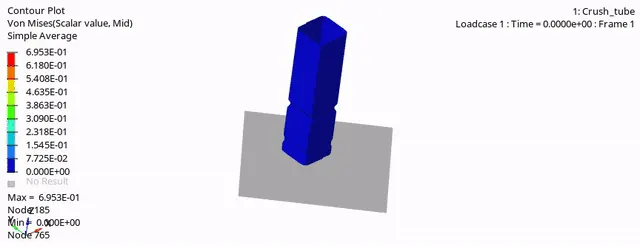
Max Von Mises Stress : 0.6953 GPa
Max Contact Forces: 93.82 kN
5) We then, proceed to plot the graphs the results with the help of Hypergraph 2D. We plot graphs for all the energies which include internal energy, kinetic energy, Contact energy & total energy, then we also plot graphs for Rigid wall forces. The plots are shown in the images given below.
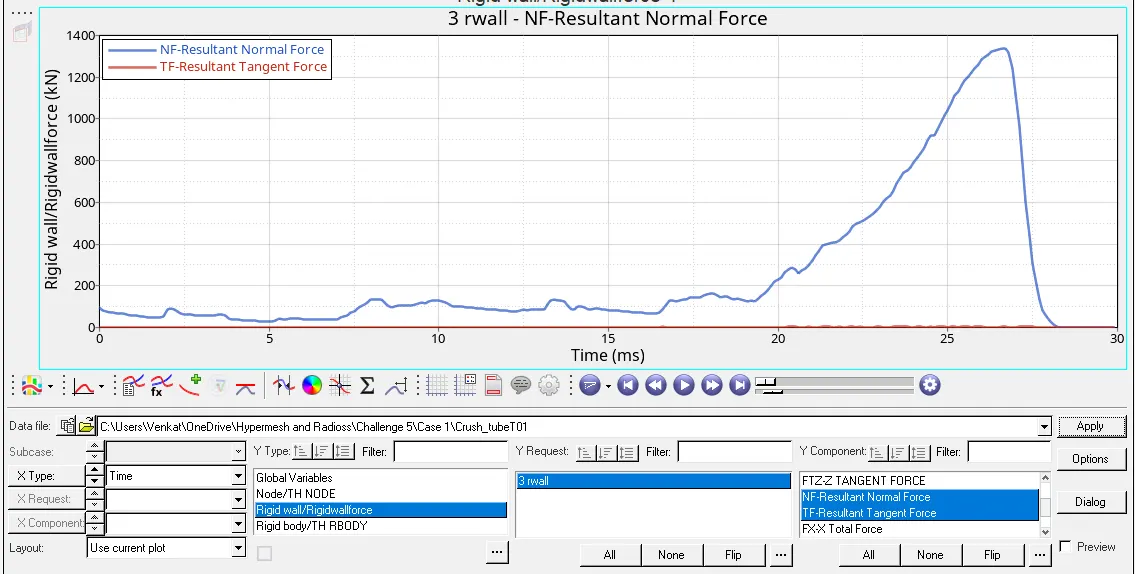
The Rigid Wall Forces are gradually increasing and the maximum value is recorded at 26 ms i.e. 1375 KN.
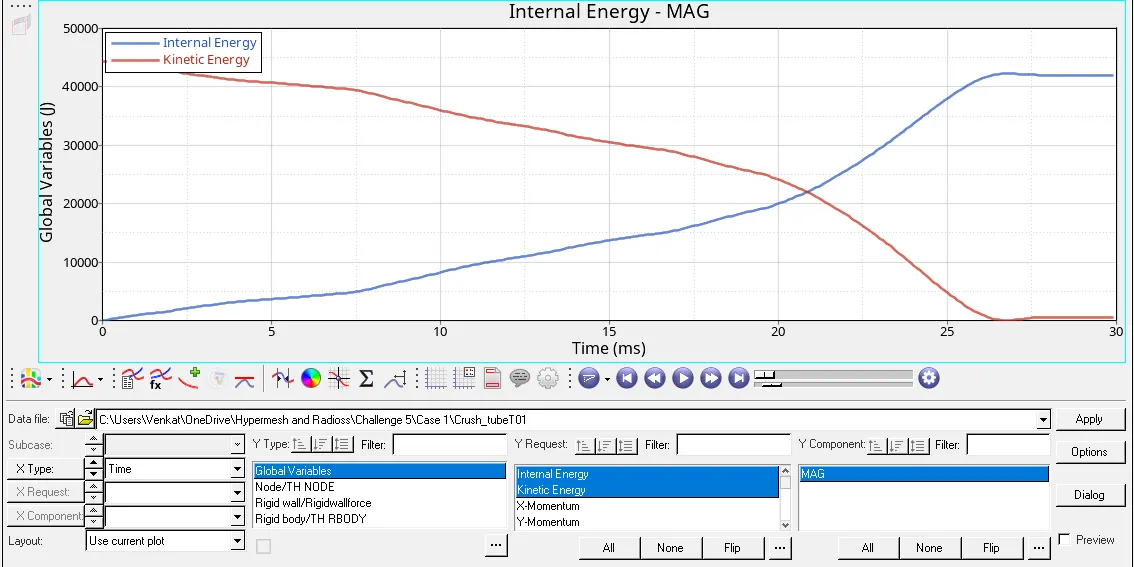
The Internal Energy increases gradually due forces being applied at one end its value is maximum value at 26.3 ms i.e. 43,000 J and Kinetic Energy decreases gradually with increase in time i.e. it comes to 0 J at 26.3 ms.
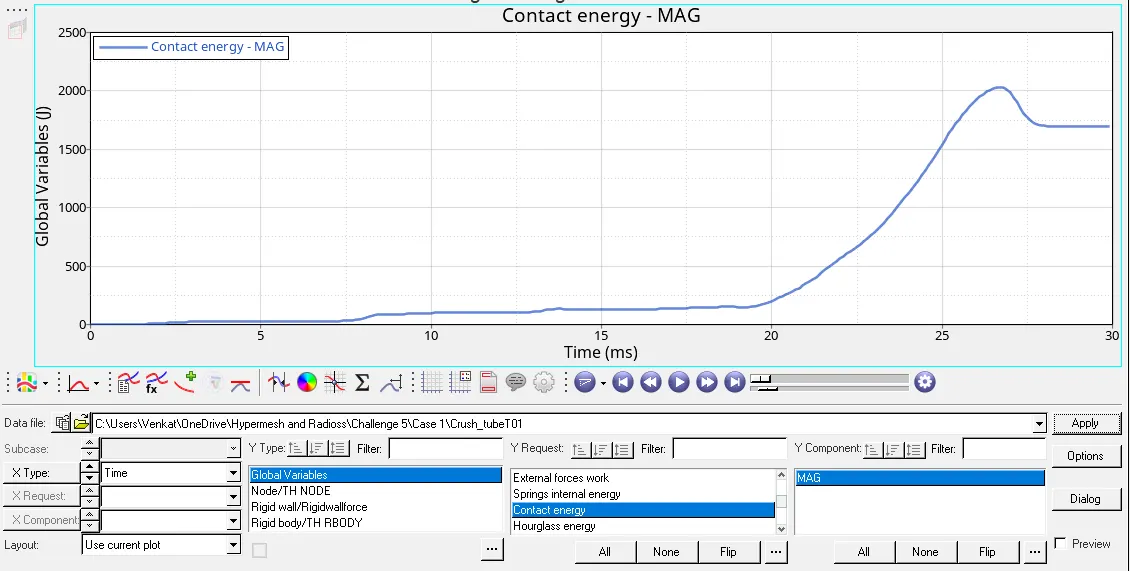
The contact energy also increases gradually with time the maximum value is recorded at 26.7 ms i.e. 2000 J and then, decreases w.r.t time then goes to constant state till the end of the simulation i.e. 1750 J.
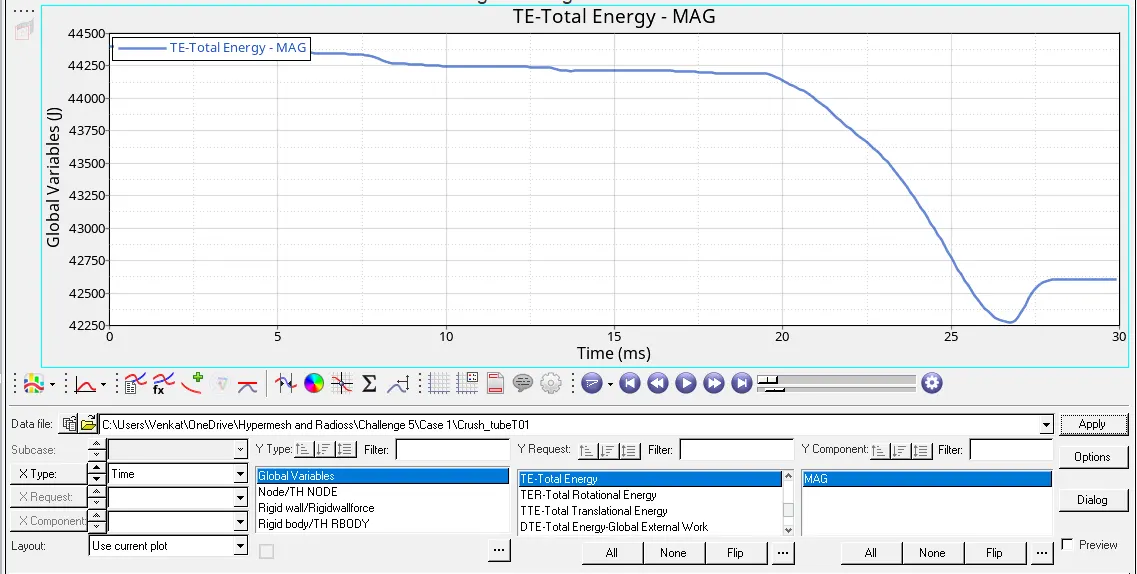
The Total Energy decreases gradually with increase in time, it goes to as low as 42250 J and then increases for some time then goes to constant state at the end of 30 ms i.e. 42625 J.
2) Case 2: Change the Inacti=6 and run (Type 7 Contact).
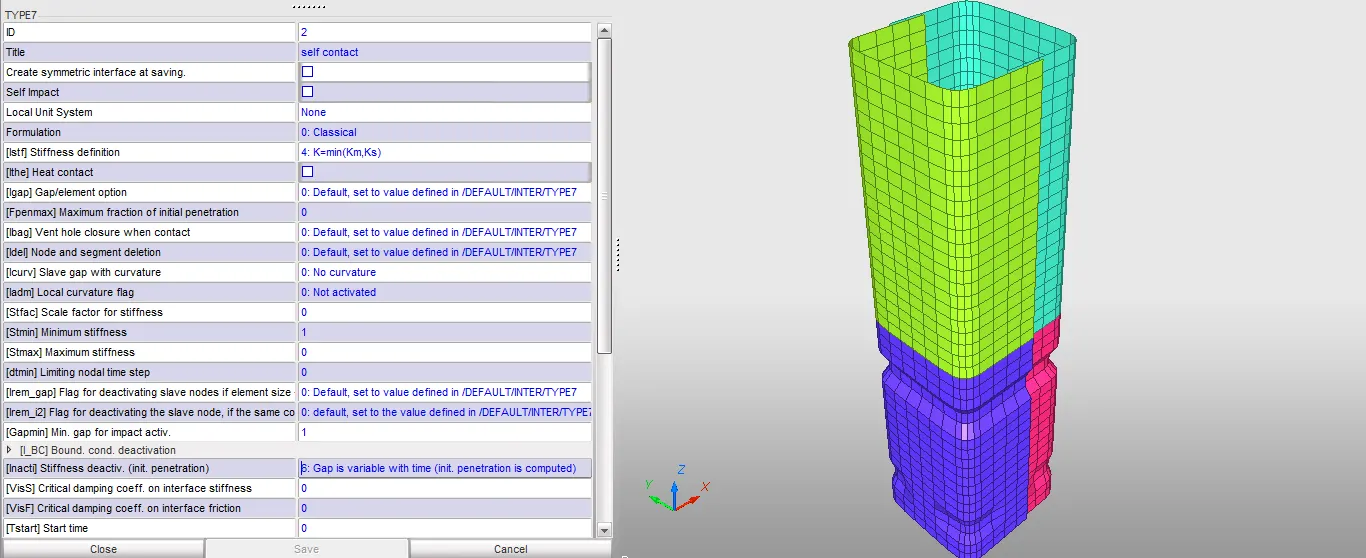
1) In this case we run the crash tube model by changing the value of Inacti =6 (Gap is Variable with time) in Hypercrash as shown in the image given below.
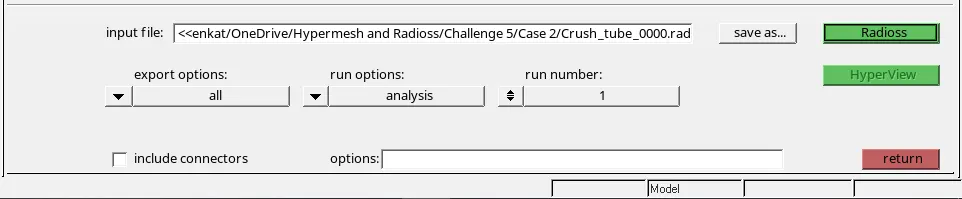
2) We then, import the .rad file in Hyperworks and then, run the simulation using the radioss option under analysis module as shown in the image given below.
3) We look out for the energy error and mass error in '0001.out' in the form of the text editor as shown in the image given below.
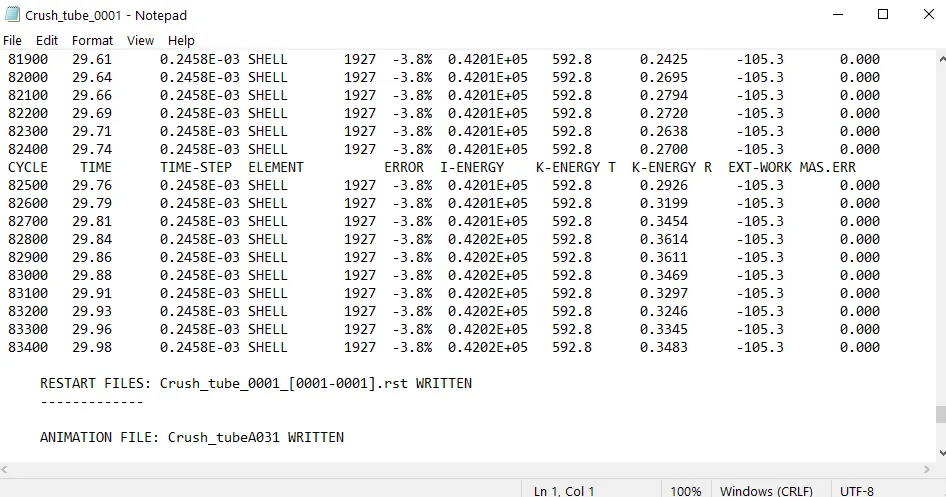
Energy Error: -3.8%
Mass Error: 0
Elapsed Time: 262.30 secs
No of Cycles: 83469
4) We go to Hyperview and import the file '.h3d' then, we check for contour plot on Von mises stress with simple average method and Contact forces in the form of animations as shown below.
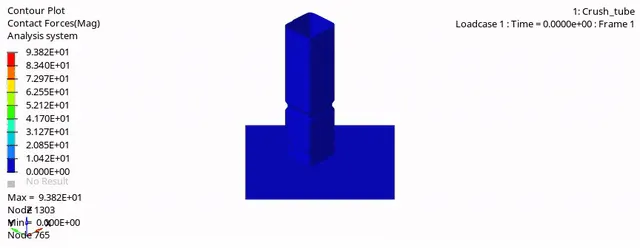
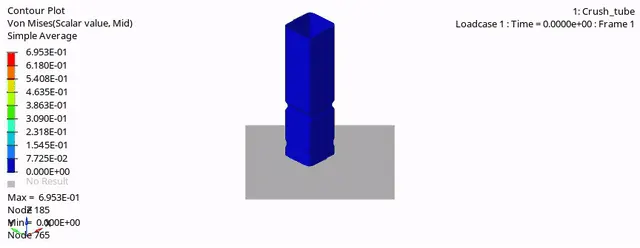
Max Von Mises Stress : 0.6953 GPa
Max Contact Forces: 93.82 kN
5) We then, proceed to plot the graphs the results with the help of Hypergraph 2D. We plot graphs for all the energies which include internal energy, kinetic energy, Contact energy & total energy, then we also plot graphs for Rigid wall forces. The plots are shown in the images given below.
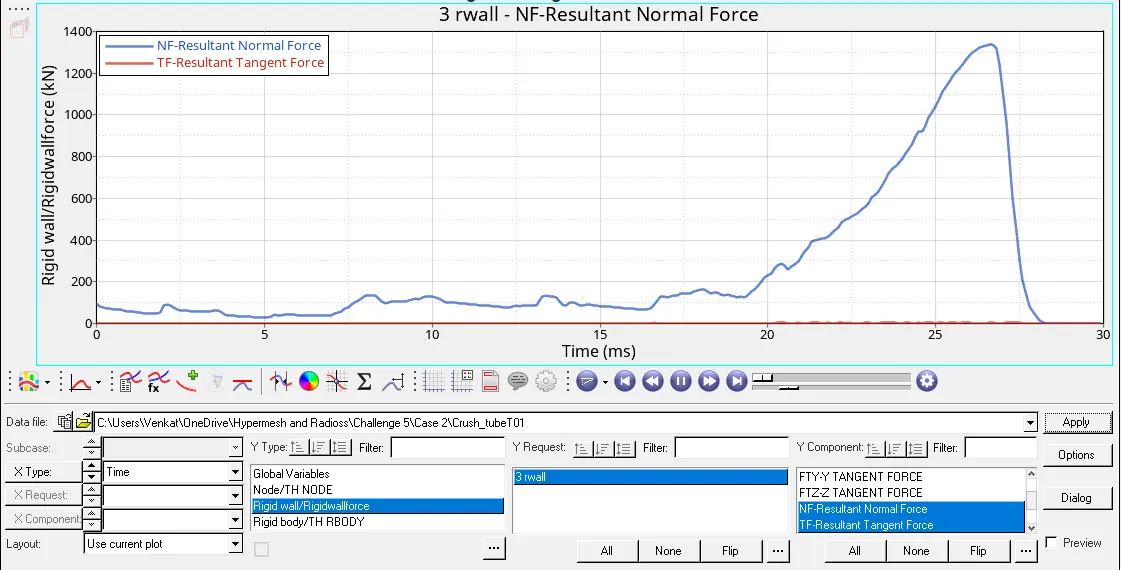
The Rigid Wall Forces are gradually increasing and the maximum value is recorded at 26 ms i.e. 1375 KN.
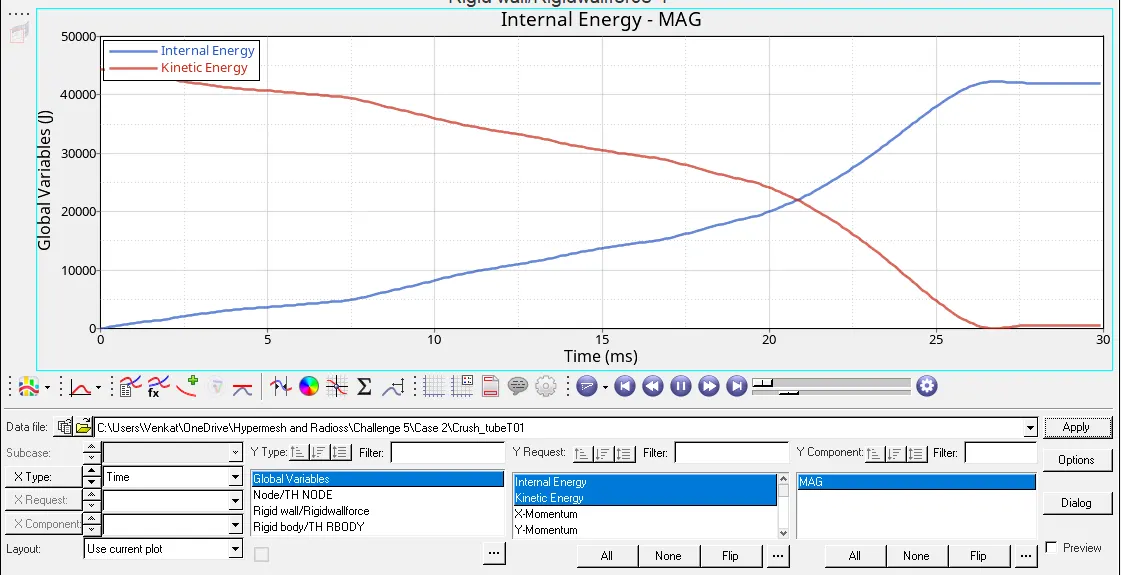
The Internal Energy increases gradually due forces being applied at one end its value is maximum value at 26.3 ms i.e. 43,000 J and Kinetic Energy decreases gradually with increase in time i.e. it comes to 0 J at 26.3 ms.
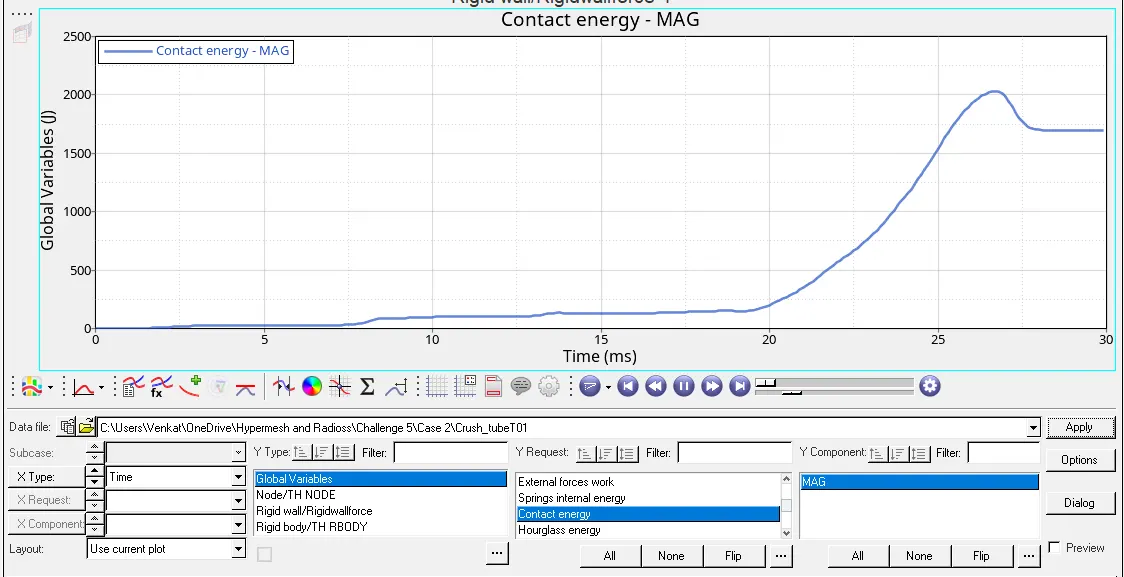
The contact energy also increases gradually with time the maximum value is recorded at 26.7 ms i.e. 2000 J and then, decreases w.r.t time then goes to constant state till the end of the simulation i.e. 1750 J.
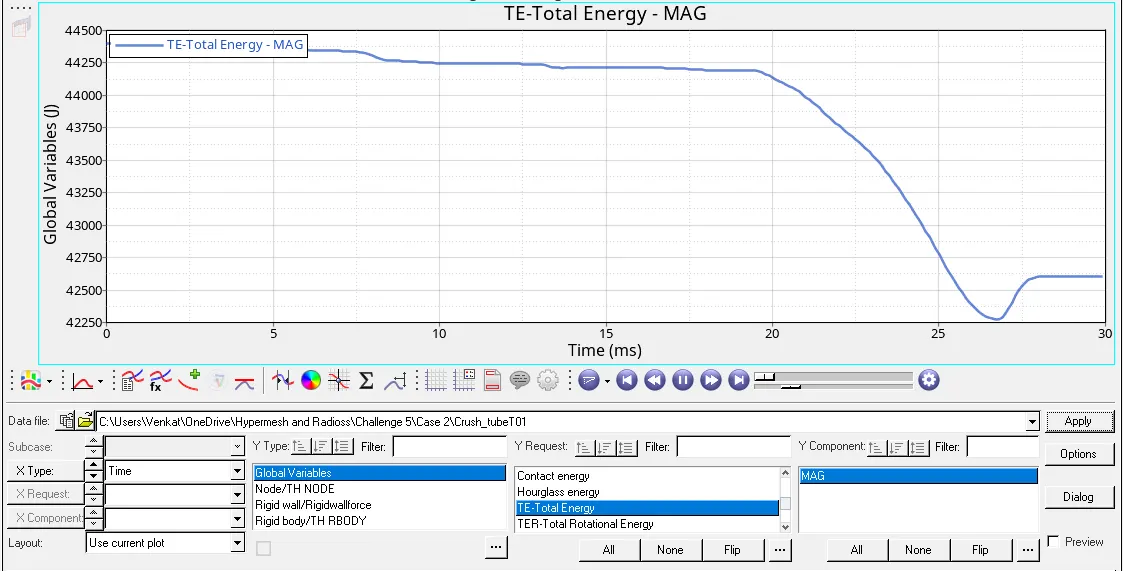
The Total Energy decreases gradually with increase in time, it goes to as low as 42250 J and then increases for some time then goes to constant state at the end of 30 ms i.e. 42625 J.
3) Case 3: Create the type 11 contact and run (Changing from Type 7 to Type 11).
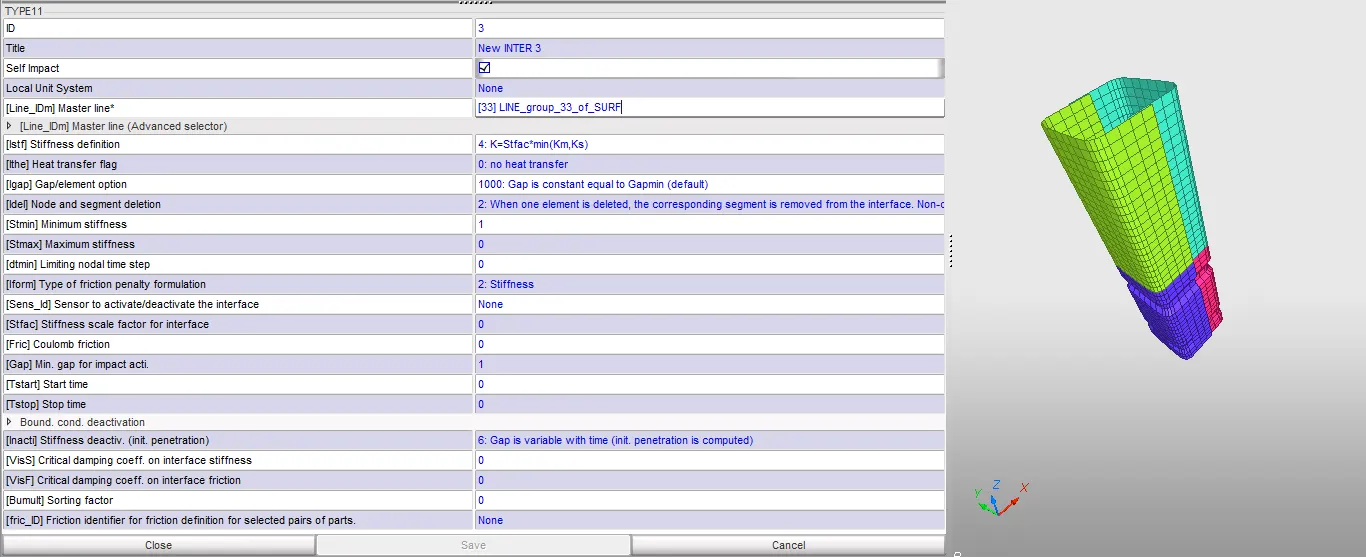
1) In this case, we change the type of contact from Type 7 (Edge to Surface) to Type 11 (Edge to Edge) contact with recommended parameters as shown in the image given below.
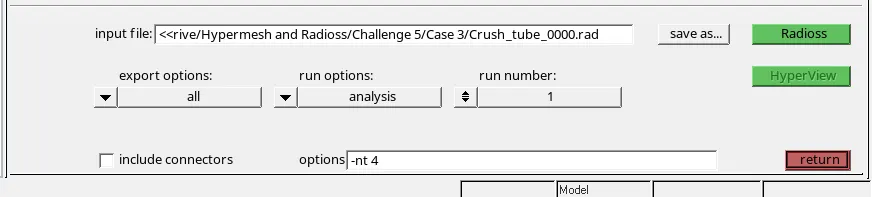
2) We then, import the .rad file in Hyperworks and then, run the simulation using the radioss option under analysis module as shown in the image given below.
3) We look out for the energy error and mass error in '0001.out' in the form of the text editor as shown in the image given below.
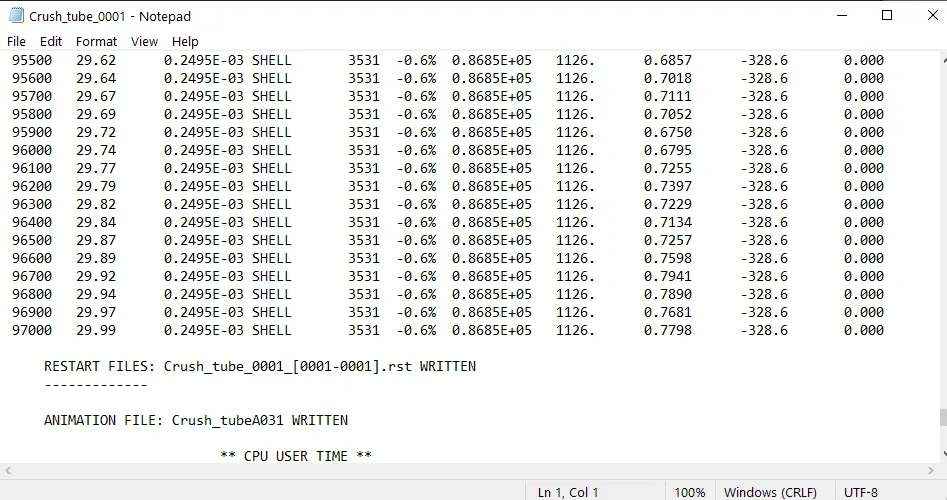
Energy Error: -0.6%
Mass Error: 0
Elapsed Time: 603.89 secs
No of Cycles: 97034
4) We go to Hyperview and import the file '.h3d' then, we check for contour plot on Von mises stress with simple average method and Contact forces in the form of animations as shown below.
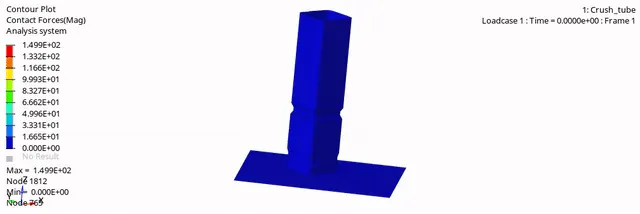
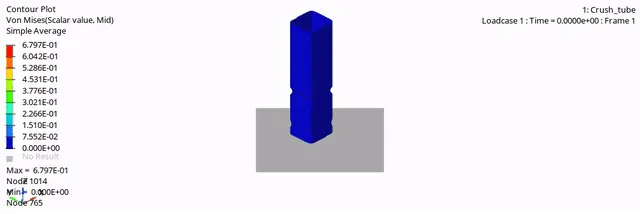
Max Von Mises Stress : 0.6797 GPa
Max Contact Forces: 149.90 kN
5) We then, proceed to plot the graphs the results with the help of Hypergraph 2D. We plot graphs for all the energies which include internal energy, kinetic energy, Contact energy & total energy, then we also plot graphs for Rigid wall forces. The plots are shown in the images given below.
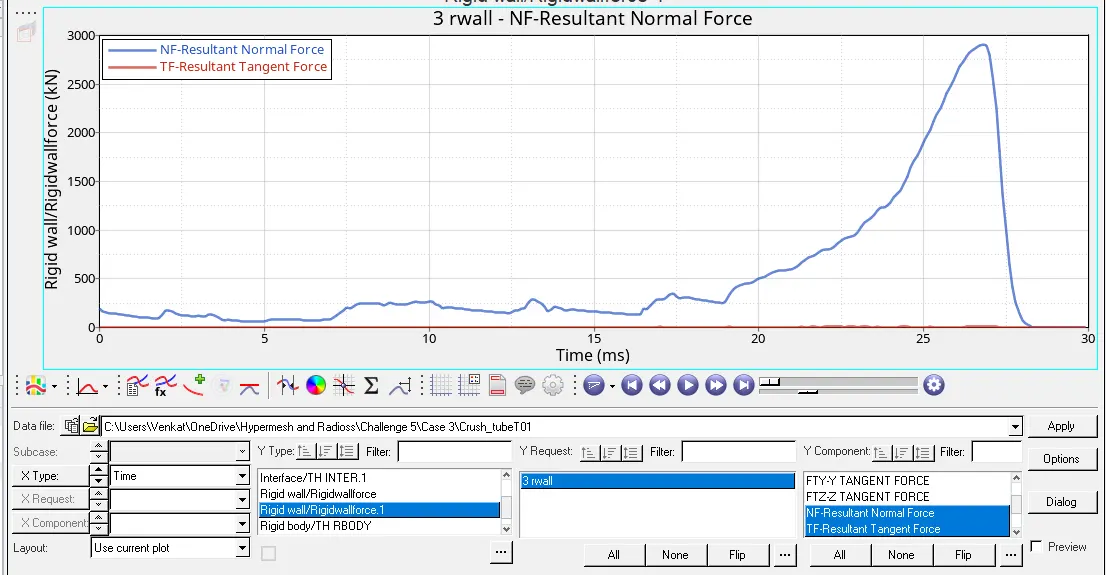
The Rigid Wall Forces are gradually increasing and the maximum value is recorded at 26 ms i.e. 2875 KN.
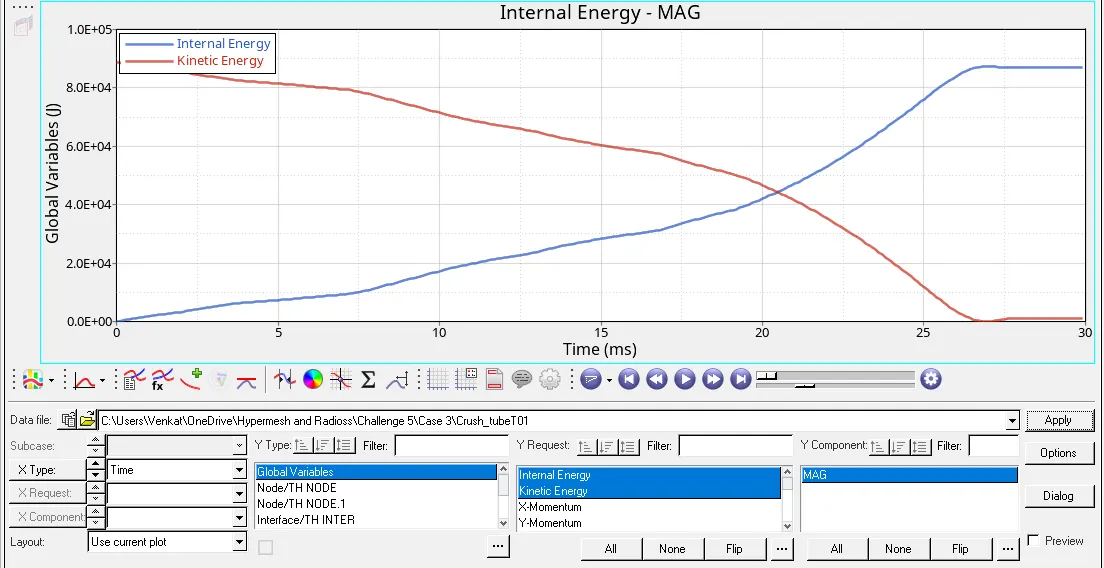
The Internal Energy increases gradually due forces being applied at one end its value is maximum value at 26.7 ms i.e. 90,000 J and Kinetic Energy decreases gradually with increase in time i.e. it comes to 0 J at 26.7 ms.
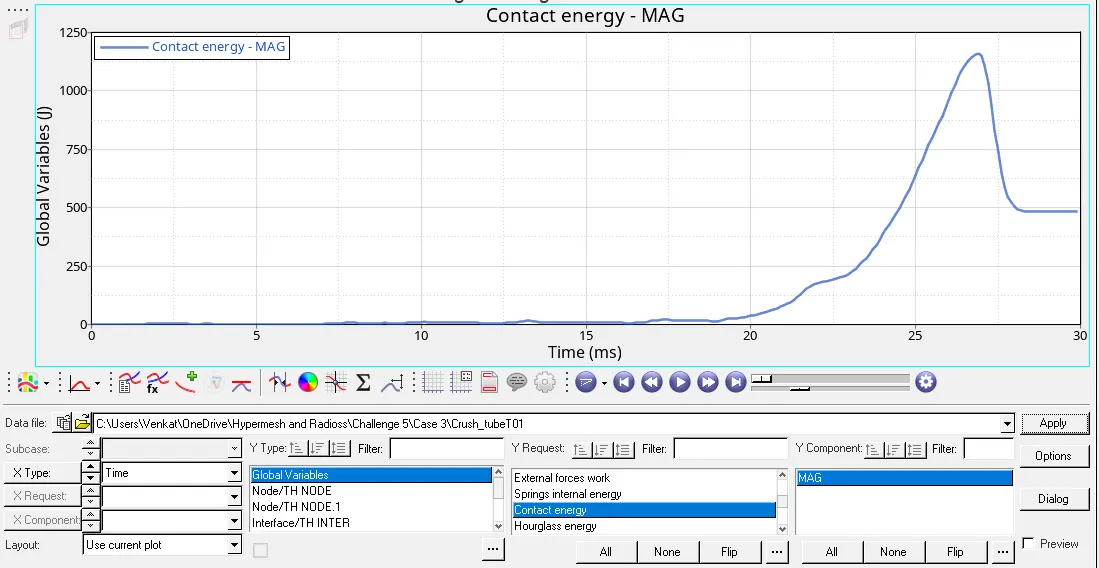
The contact energy also increases gradually with time the maximum value is recorded at 26.7 ms i.e. 1175 J and then, decreases w.r.t time then goes to constant state till the end of the simulation i.e. 500 J.
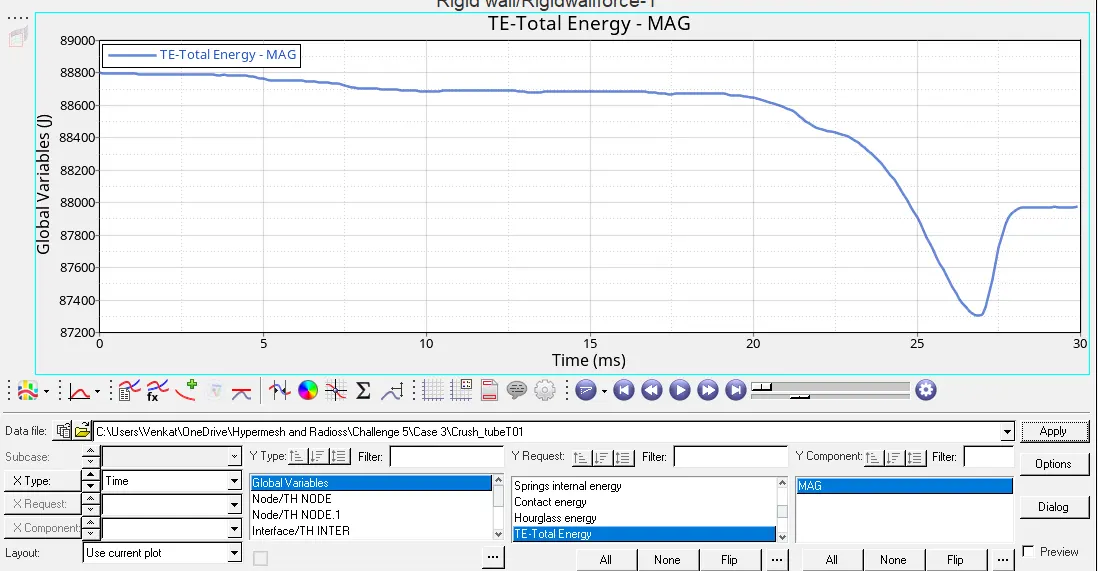
The Total Energy decreases gradually with increase in time, it goes to as low as 87,300 J and then increases for some time then goes to constant state at the end of 30 ms i.e. 88,000 J.
2. Notches:
4) Case 4: Remove both notches and remove boundary condition on rigid body node then run.
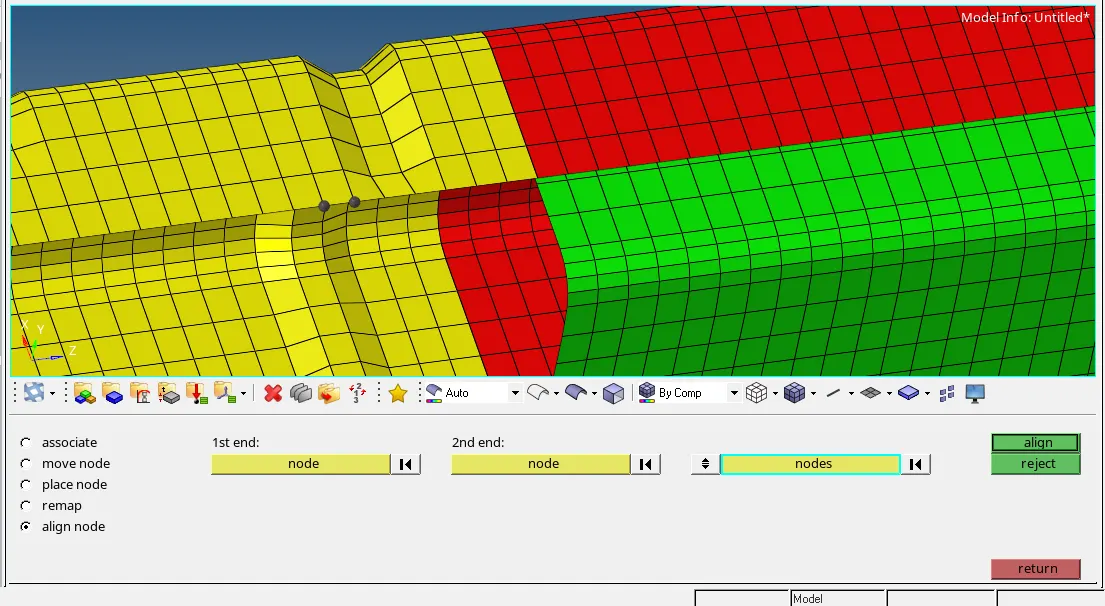
1) In this case, we remove the boundry conditions first in Hypercrash and then we import that rad file in Hyperworks then we remove the notches in the model using align nodes option in the node edit tab of the geometry module as shown in the image given below.
2) We then, import the .rad file in Hyperworks and then, run the simulation using the radioss option under analysis module as shown in the image given below.

3) We look out for the energy error and mass error in '0001.out' in the form of the text editor as shown in the image given below.
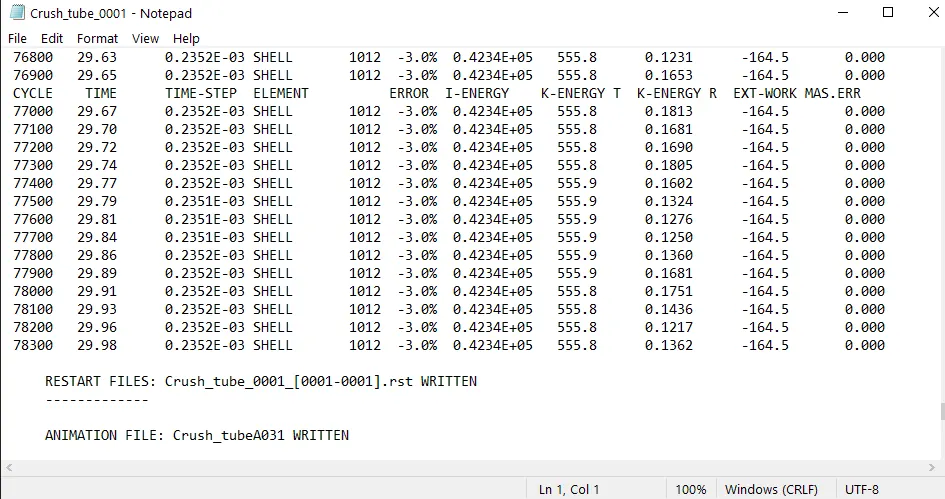
Energy Error: -3.0%
Mass Error: 0
Elapsed Time: 270.53 secs
No of Cycles: 78930
4) We go to Hyperview and import the file '.h3d' then, we check for contour plot on Von mises stress with simple average method and Contact forces in the form of animations as shown below.
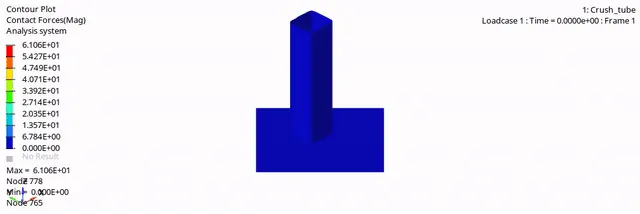
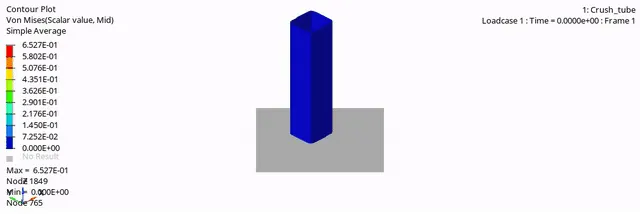
Max Von Mises Stress : 0.6527 GPa
Max Contact Forces: 61.06 kN
5) We then, proceed to plot the graphs the results with the help of Hypergraph 2D. We plot graphs for all the energies which include internal energy, kinetic energy, Contact energy & total energy, then we also plot graphs for Rigid wall forces. The plots are shown in the images given below.
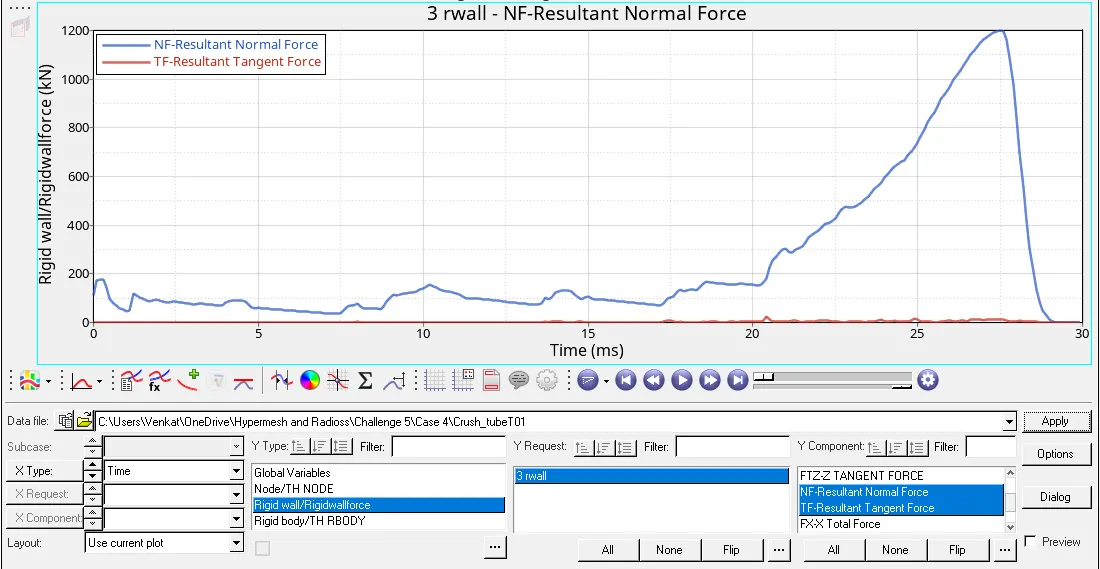
The Rigid Wall Forces are gradually increasing and the maximum value is recorded at 26 ms i.e. 1200 KN.
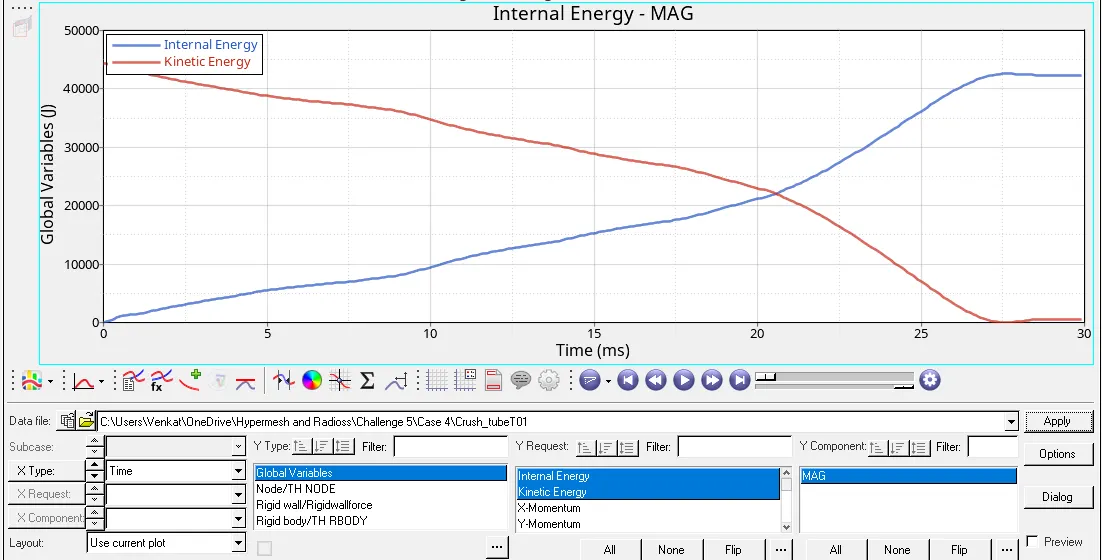
The Internal Energy increases gradually due forces being applied at one end its value is maximum value at 26.7 ms i.e. 42,000 J and Kinetic Energy decreases gradually with increase in time i.e. it comes to 0 J at 26.7 ms.
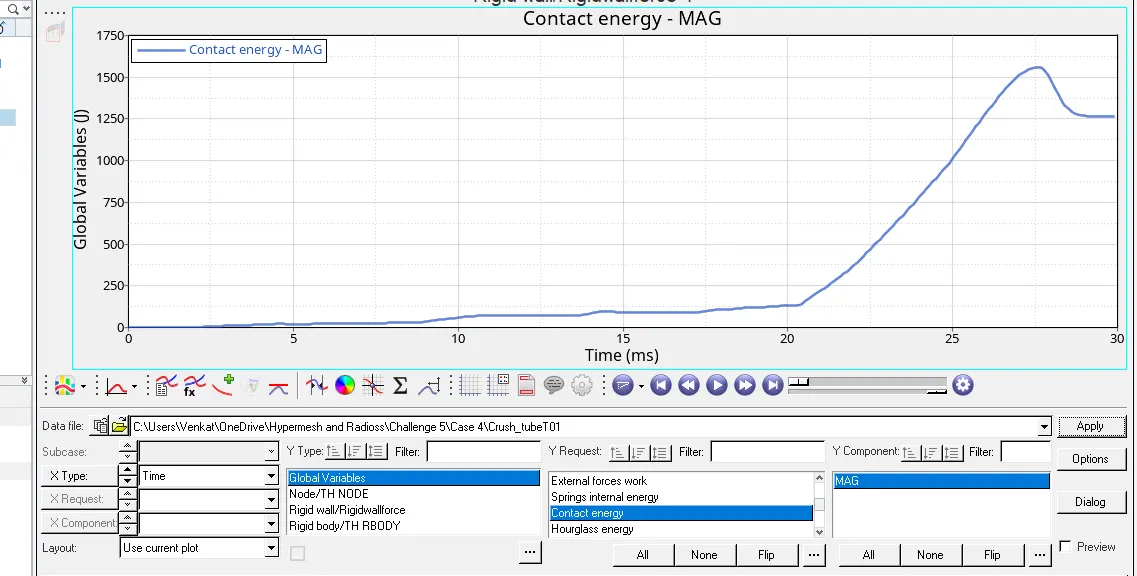
The contact energy also increases gradually with time the maximum value is recorded at 26.7 ms i.e. 1600 J and then, decreases w.r.t time then goes to constant state till the end of the simulation i.e. 1250 J.
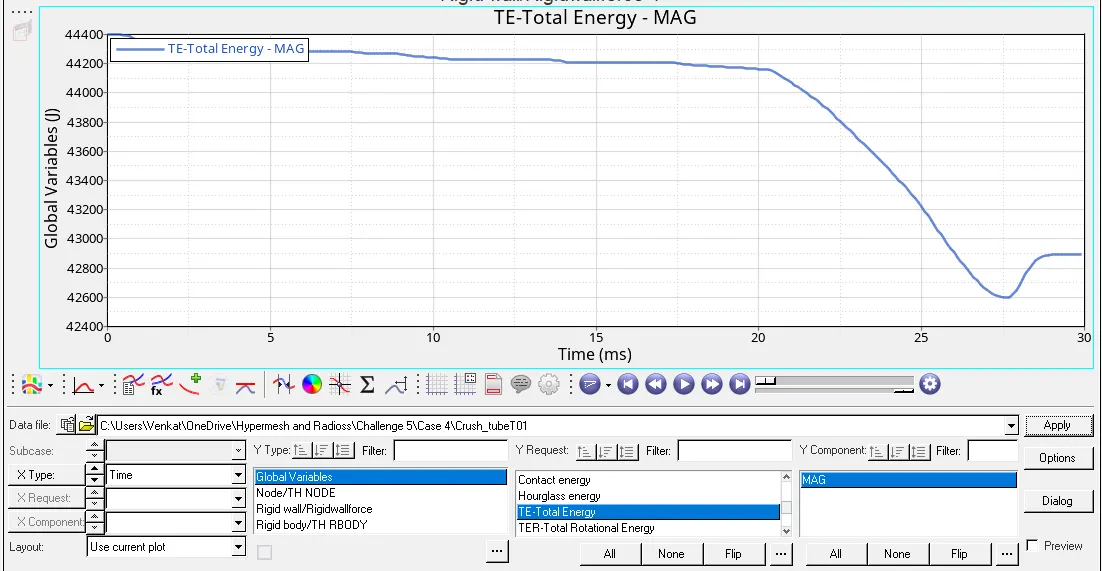
The Total Energy decreases gradually with increase in time, it goes to as low as 42,600 J and then increases for some time then goes to constant state at the end of 30 ms i.e. 42,900 J.
5) Case 5: Create a new notch in the middle ,select the whole section and run.
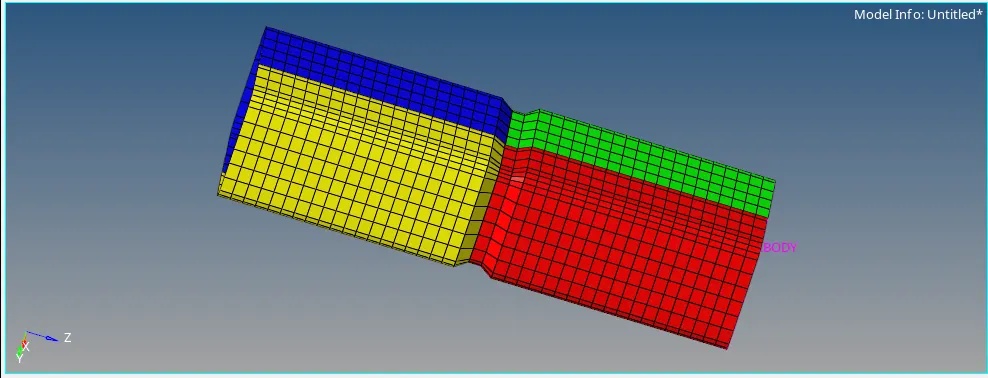
1) In this case, we create a new notch in the middle by using the distance option in the geometry module by measuring the coordinates and distance of existing notch and then create a notch in the middle of the model as shown in the image given below.
2) We then, import the .rad file in Hyperworks and then, run the simulation using the radioss option under analysis module as shown in the image given below.

3) We look out for the energy error and mass error in '0001.out' in the form of the text editor as shown in the image given below.
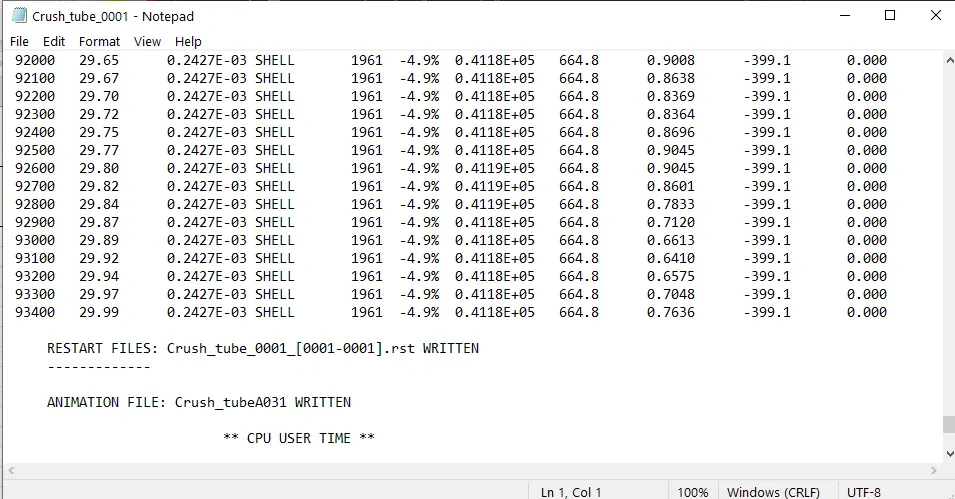
Energy Error: -4.90%
Mass Error: 0
Elapsed Time: 175.65 secs
No of Cycles: 93443
4) We go to Hyperview and import the file '.h3d' then, we check for contour plot on Von mises stress with simple average method and Contact forces in the form of animations as shown below.
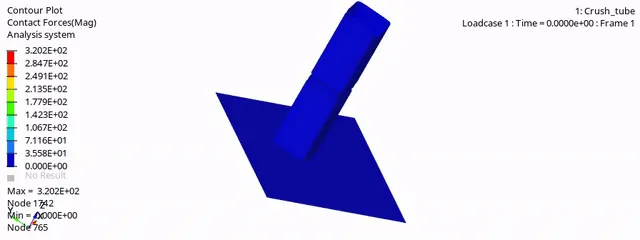
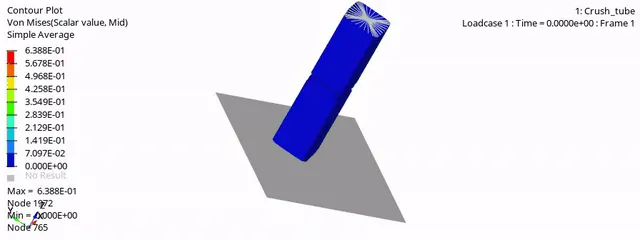
Max Von Mises Stress : 0.6388 GPa
Max Contact Forces: 32.02 kN
5) We then, proceed to plot the graphs the results with the help of Hypergraph 2D. We plot graphs for all the energies which include internal energy, kinetic energy, Contact energy & total energy, then we also plot graphs for Rigid wall forces. The plots are shown in the images given below.
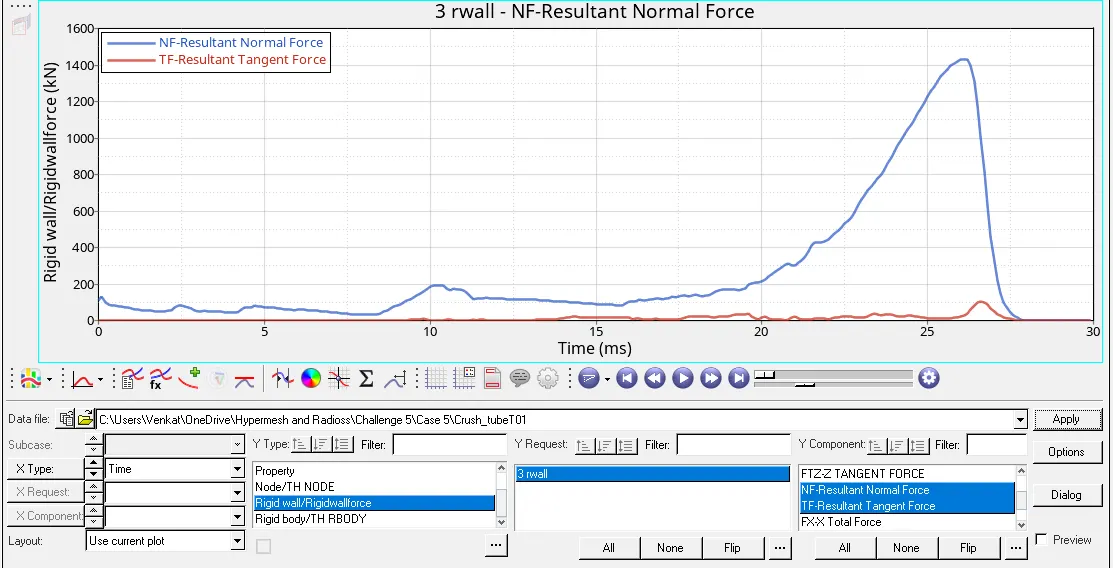
The Rigid Wall Forces are gradually increasing and the maximum value is recorded at 26 ms i.e. 1425 KN.
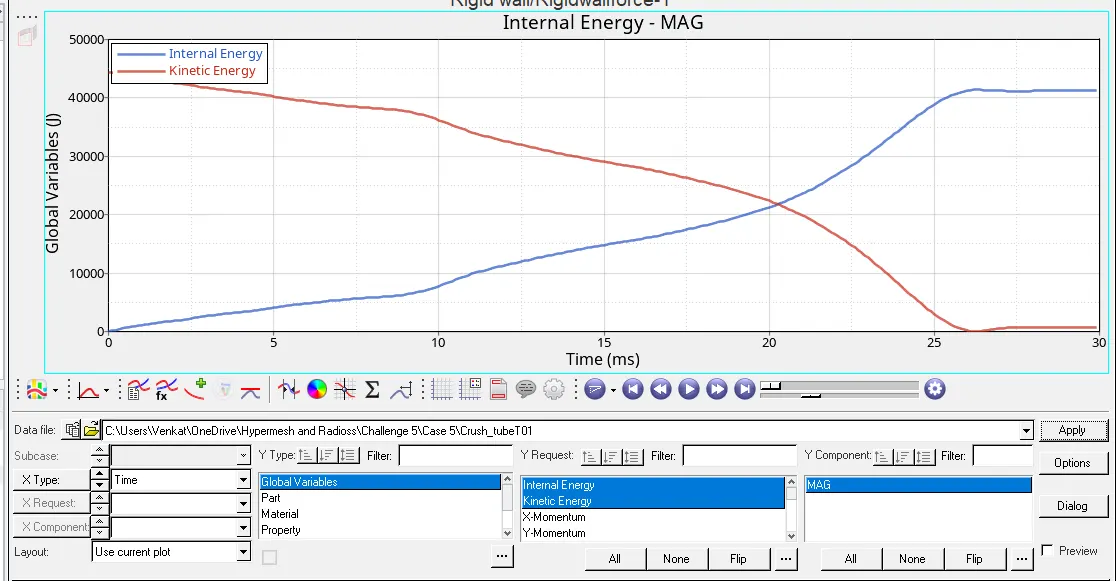
The Internal Energy increases gradually due forces being applied at one end its value is maximum value at 26.7 ms i.e. 41,900 J and Kinetic Energy decreases gradually with increase in time i.e. it comes to 0 J at 26.7 ms.
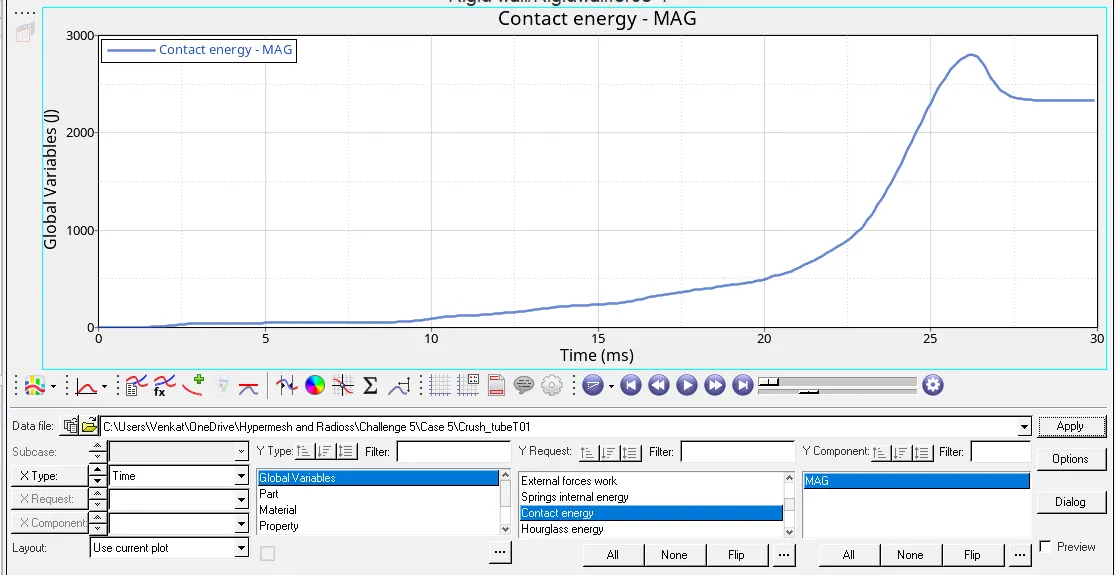
The contact energy also increases gradually with time the maximum value is recorded at 26.7 ms i.e. 2700 J and then, decreases w.r.t time then goes to constant state till the end of the simulation i.e. 2300 J.
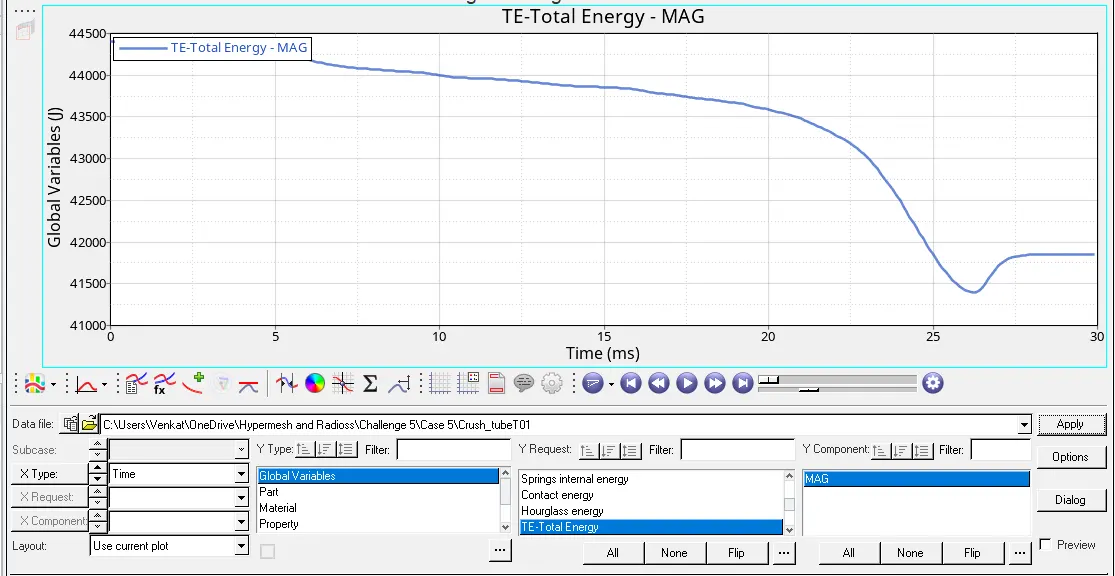
The Total Energy decreases gradually with increase in time, it goes to as low as 41,400 J and then increases for some time then goes to constant state at the end of 30 ms i.e. 41,700 J.
6) Case 6: Create a new notch with nodes only from opposing 2 faces and run.
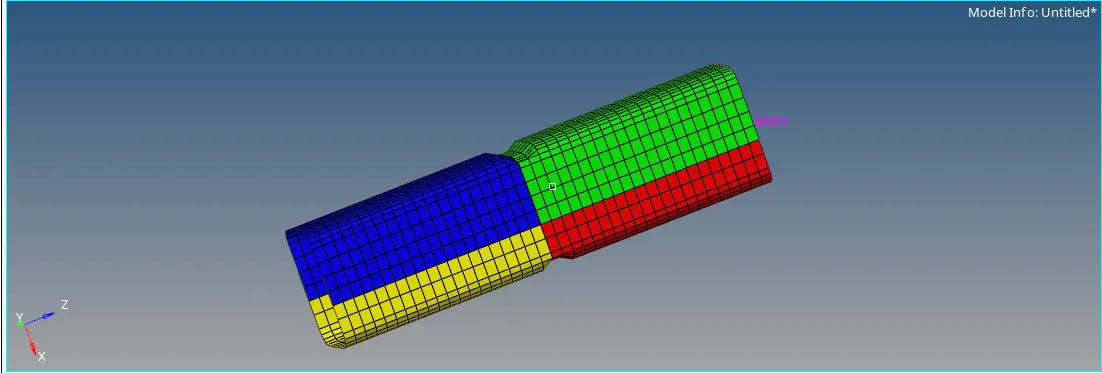
1) In this case, we create a new notch with nodes only from opposing 2 faces in the middle using the translate option in the geometry module as shown in the image given below.
2) We then, import the .rad file in Hyperworks and then, run the simulation using the radioss option under analysis module as shown in the image given below.

3) We look out for the energy error and mass error in '0001.out' in the form of the text editor as shown in the image given below.
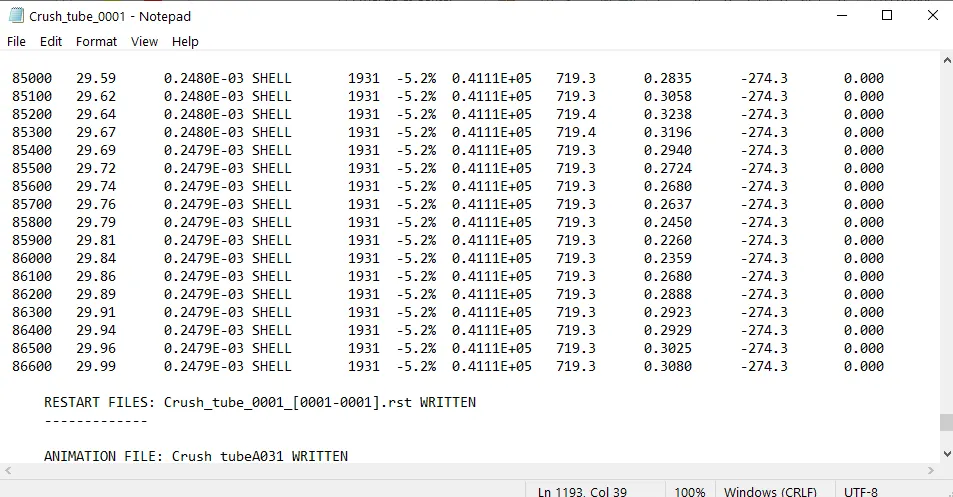
Energy Error: -5.20%
Mass Error: 0
Elapsed Time: 178.44 secs
No of Cycles: 86649
4) We go to Hyperview and import the file '.h3d' then, we check for contour plot on Von mises stress with simple average method and Contact forces in the form of animations as shown below.
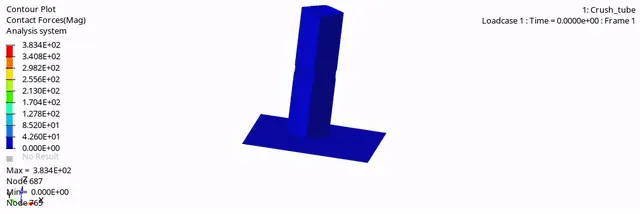
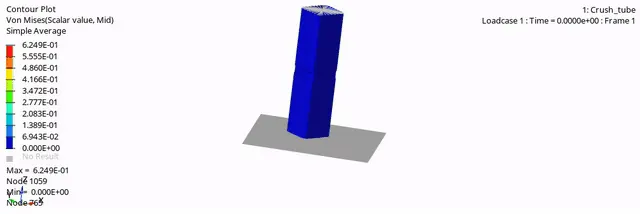
Max Von Mises Stress : 0.6249 GPa
Max Contact Forces: 38.34 kN
5) We then, proceed to plot the graphs the results with the help of Hypergraph 2D. We plot graphs for all the energies which include internal energy, kinetic energy, Contact energy & total energy, then we also plot graphs for Rigid wall forces. The plots are shown in the images given below.
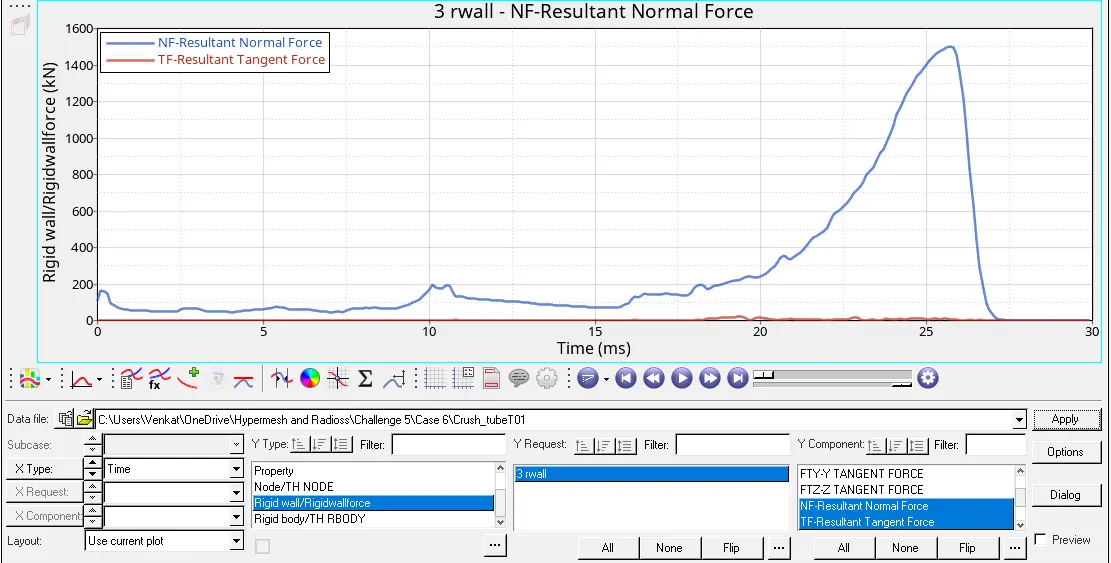
The Rigid Wall Forces are gradually increasing and the maximum value is recorded at 26 ms i.e. 1500 KN.
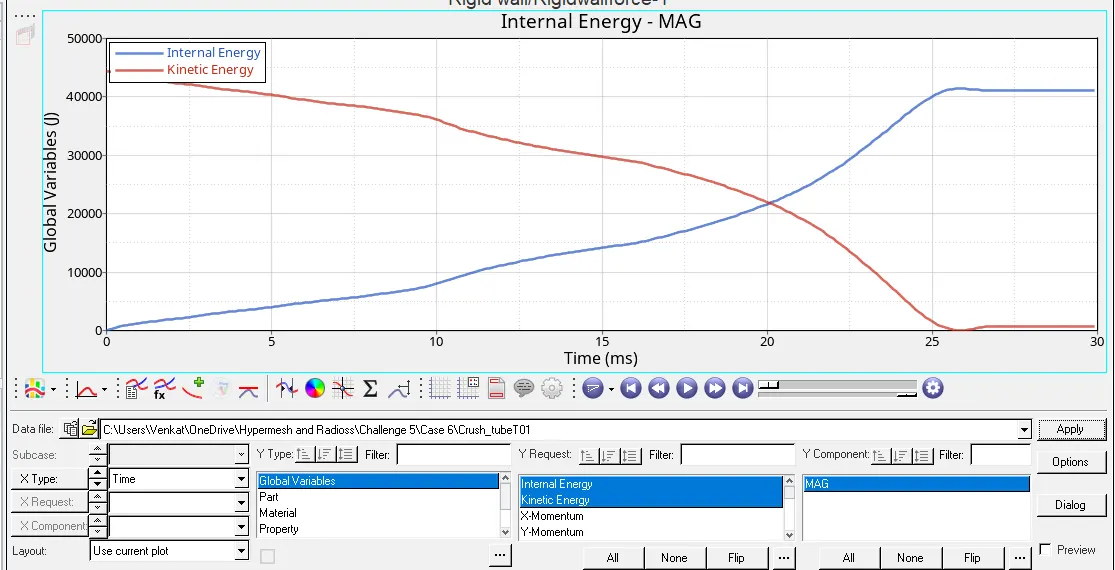
The Internal Energy increases gradually due forces being applied at one end its value is maximum value at 26.7 ms i.e. 41,900 J and Kinetic Energy decreases gradually with increase in time i.e. it comes to 0 J at 26.7 ms.
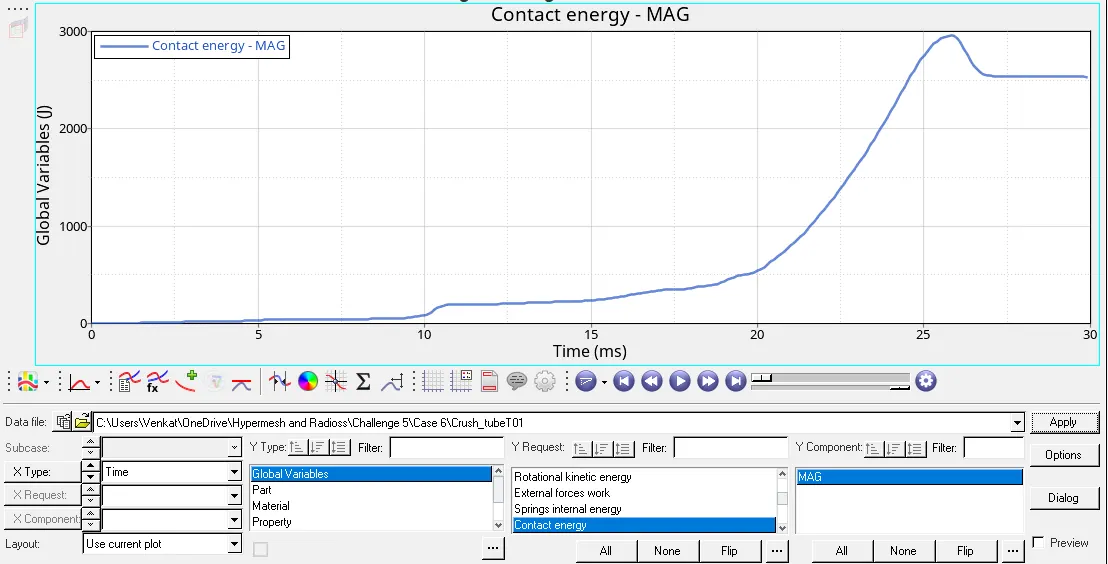
The contact energy also increases gradually with time the maximum value is recorded at 26.7 ms i.e. 2900 J and then, decreases w.r.t time then goes to constant state till the end of the simulation i.e. 2500 J.
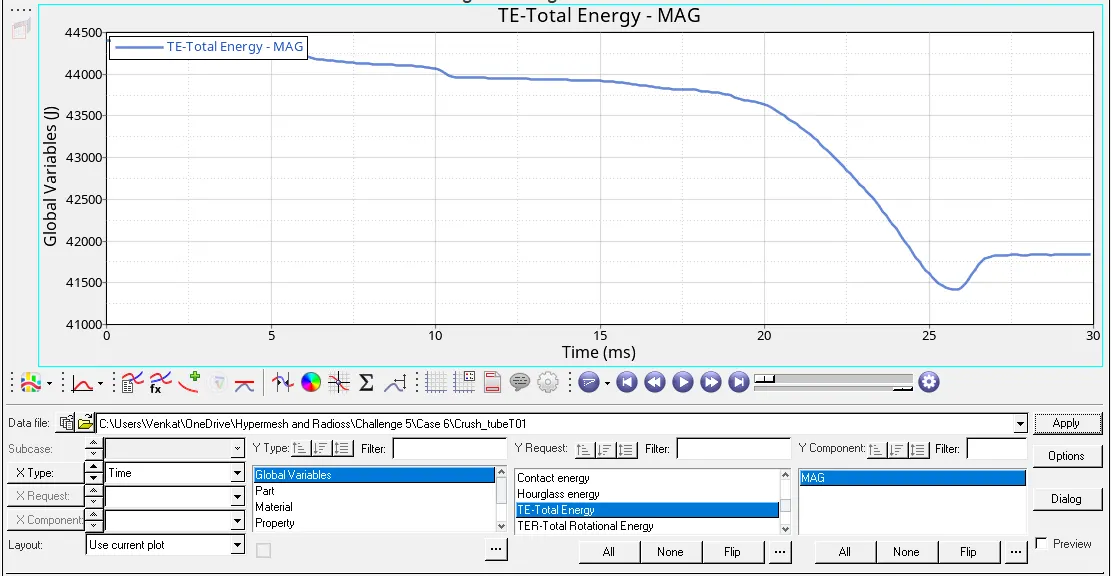
The Total Energy decreases gradually with increase in time, it goes to as low as 41,300 J and then increases for some time then goes to constant state at the end of 30 ms i.e. 41,800 J.
Results and Discussion:
1) We have seperated the first 3 cases as contact type and the second 3 cases based notches.
2) In the first 3 cases, we find that no differences were noted between Cases 1 and 2 because there were no initial penetrations in the model for the Inacti to have an effect. The has increased no of cycles and increase other because we have defined a Type 11 edge to edge contact.
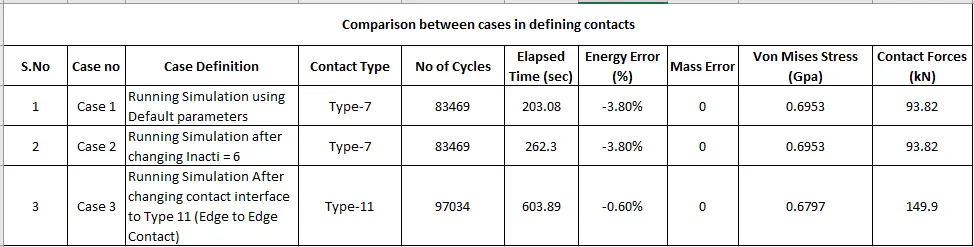
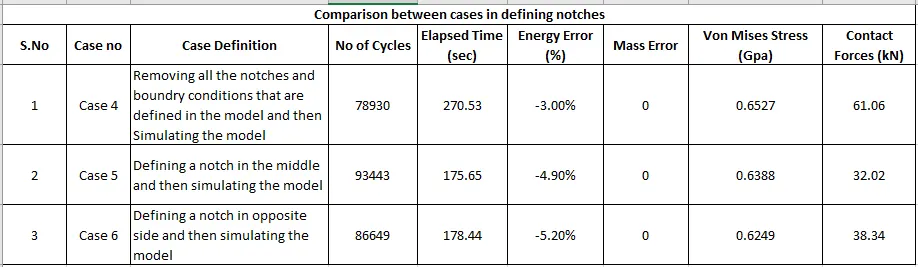
3) In the second 3 cases, we find that the notches play a significant role in the results obtained. The notches are the first to collapse (if present) in the event of a crash and by controlling the positioning of the notches, the Rigid wall forces, contact energy, internal energy flow can be controlled.
4) Other than, we find that there are no physical differences in the curves path of the internal energies only difference is present the values of it which is obtained according to the case definition.
5) It is also observed from the animations that deformation first takes place from the notches. The Von mises stress values have similar range i.e. the values lie between the 0.6 to 0.7 GPa. But, the contact forces have some changes in their values since the case definition is different.
6) There is no hourglass energy since there are recommended properties i.e. shell formulation inputed by default.
Conclusion:
We have also simulated the given cases and compared the results of segregating them into two sub-divisions i.e. type of contact and notches.
Model Link:
https://drive.google.com/file/d/1lhBi-vnwkw6sc91vkP_XwmsOYJqdTris/view?usp=sharing