 Free · 9 lessons · no payment
Medical Data Analytics & Visualization: 9 free lessons
Nine free lessons from Skill-Lync's Medical Data Analytics & Visualization course. They start with Microsoft Excel basics: the interface, data entry, cell references and shortcut keys. They then introduce Tableau, covering data connections, live and extract sources, the data pane and Show Me charts. The last three lessons introduce business intelligence and Power BI, including the Power Query editor.
Last updated 16 Nov 2026 · 9 free lessons (3 h 12 min) · full course: 123 lessons (54 h 21 min), paid · ₹40,000
 Free lesson 1 · 37 minExcel Interface, Data Entry and Auto Fill Basics
What will you learn in the free Medical Data Analytics & Visualization lessons?
- Excel interface, data entry and fill patterns
- Relative, absolute and mixed cell references
- Connecting Tableau to data with live or extract
- Loading and cleaning tables in Power BI
Free lessons you can watch now
- Lesson 1 · 37 minExcel Interface, Data Entry and Auto Fill BasicsThe instructor shows three ways to launch Excel, how to check the installed version, and the parts of the interface. Examples include entering and editing data, setting column width and row height, and using auto fill on numbers, weekdays and month names with a small student marks table.
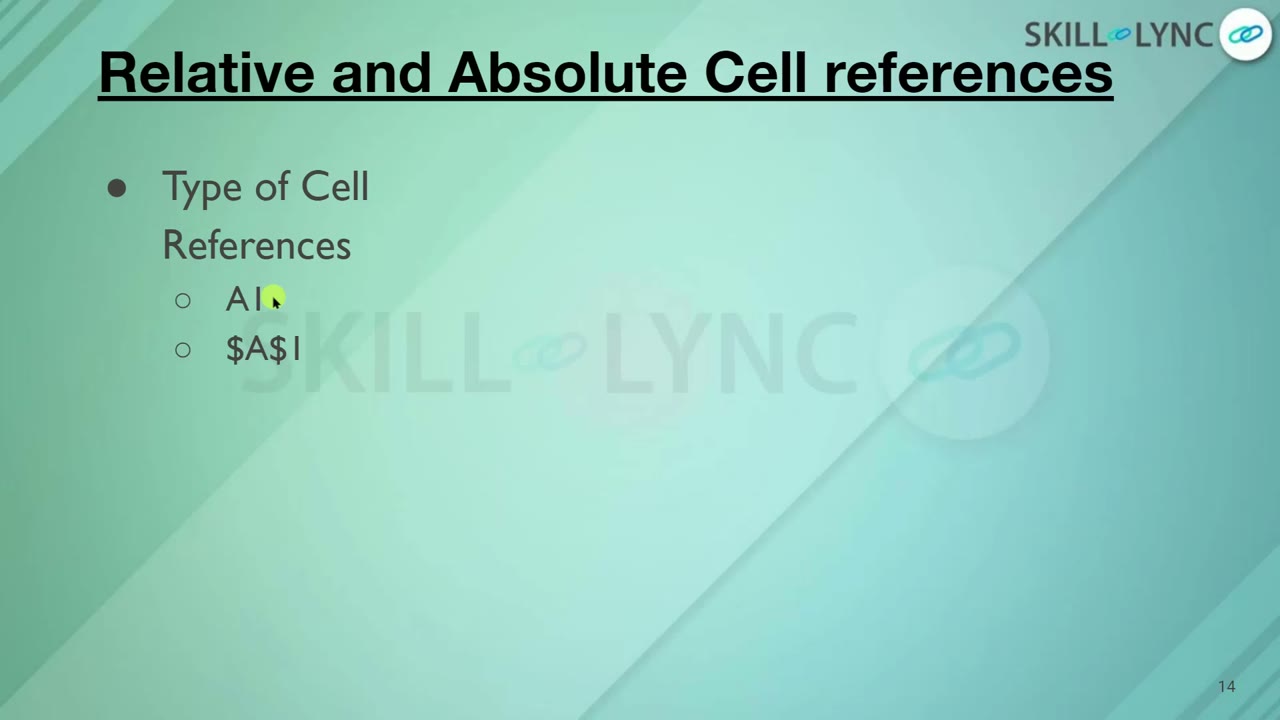 Lesson 2 · 29 minRelative, Absolute and Mixed Cell References in ExcelThe lesson explains why A1 is a relative reference and $A$1 is an absolute one. The instructor builds a marks total with a formula, then multiplies by a fixed cell using dollar signs, and ends by describing mixed references such as $A2.
 Lesson 3 · 13 minCommon Excel Shortcut Keys for Files, Editing and PrintingThe instructor goes through everyday Excel shortcuts and tries several in the application. These include Ctrl+N, Ctrl+O, Ctrl+S, F12 for Save As, cut, copy and paste, undo, Ctrl+P for the print dialog, selecting a column or row, and the Alt key for keyboard navigation.
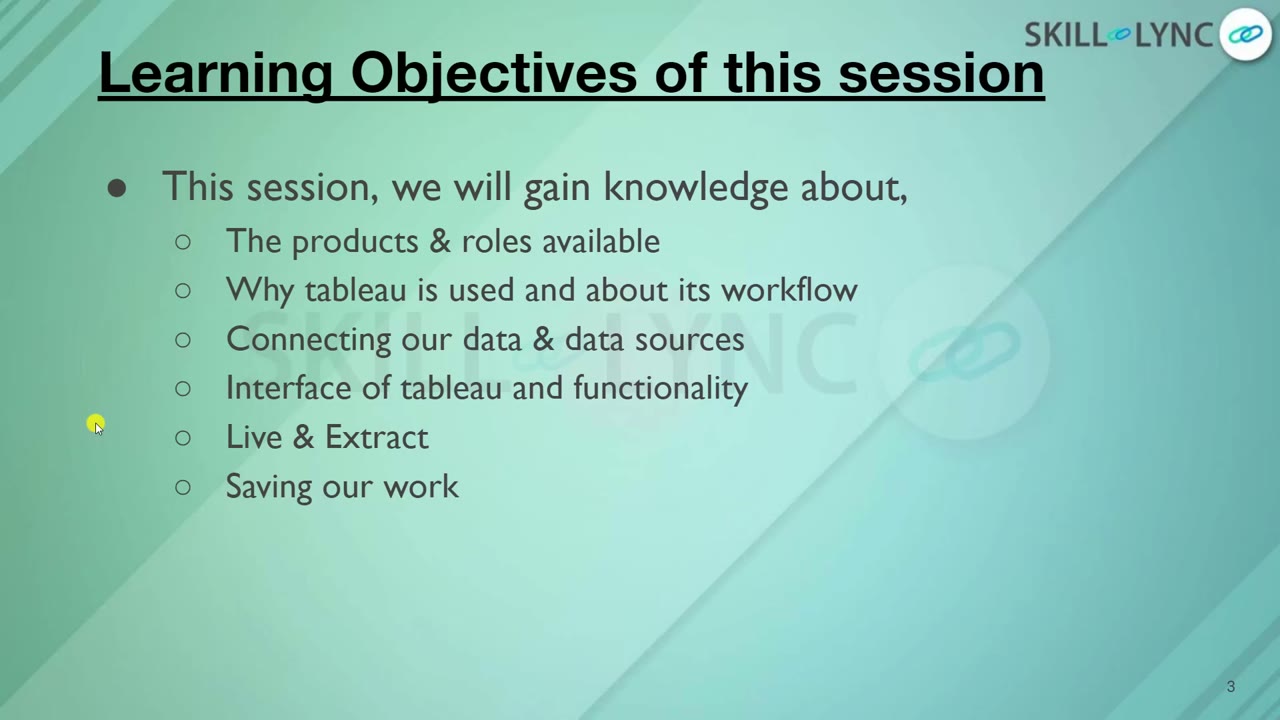 Lesson 50 · 19 minIntroduction to Tableau: Products, Workflow and Data SourcesThe lesson describes Tableau as a visual analytics platform and walks through installing the 14-day trial and the free Tableau Public. It covers the Viewer, Explorer and Creator roles, the ingest, store and process, analyze and share workflow, and the kinds of data sources Tableau can connect to.
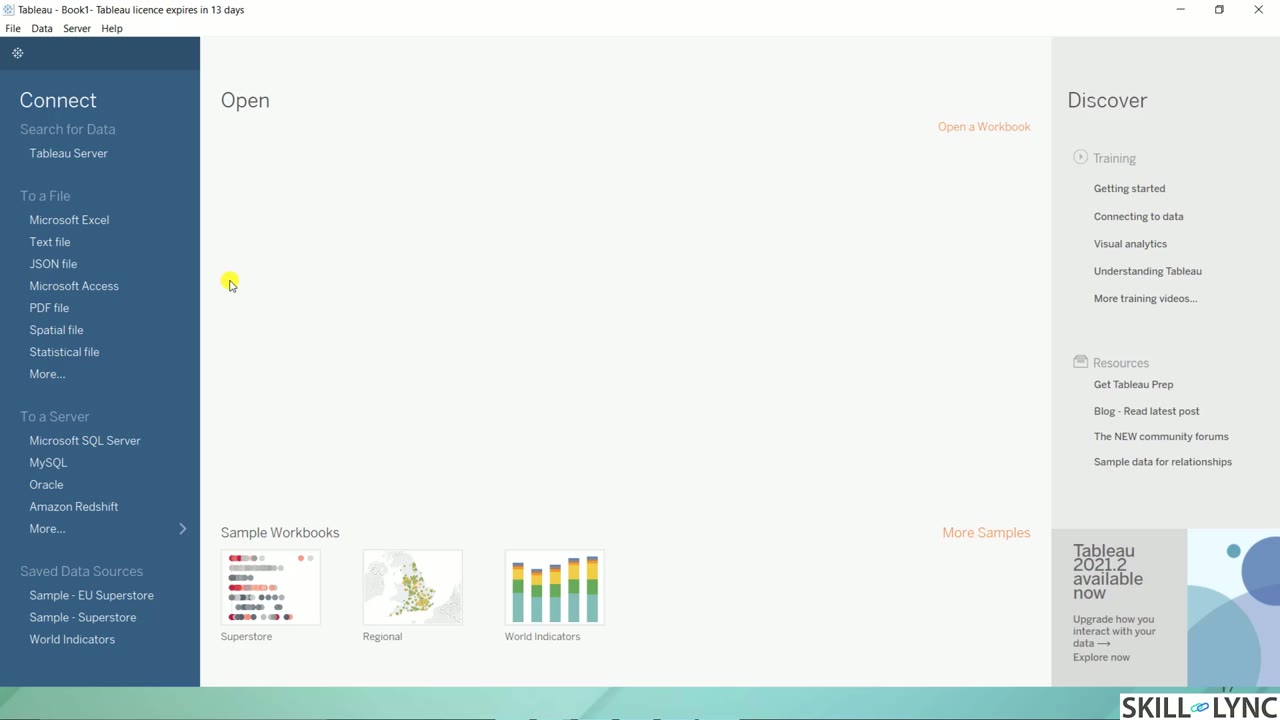 Lesson 51 · 30 minTableau Data Source Page, Live vs Extract ConnectionsThe instructor demonstrates Tableau Desktop's start page and data source page using an Excel practice file. Topics include the logical and physical canvas layers, relationships and joins, the data grid, creating a Hyper extract with filters, and the two ways to save a workbook.
 Lesson 52 · 29 minTableau Data Pane, Show Me Charts and Marks CardUsing the Sample Superstore Orders data, the instructor explains the Data and Analytics tabs and the live and extract icons. The lesson then covers Show Me quick visualizations, the Marks card, and builds a lollipop-style chart by combining a bar and a circle with a synchronized axis.
 Lesson 97 · 12 minWhat Business Intelligence Is and How BI Platforms CompareThe instructor defines business intelligence and walks through its processes: data preparation, reporting, performance metrics and benchmarking, querying, and visualization. The lesson then lists BI platform functionality and compares products such as Spotfire, Cognos, Power BI, Tableau and MicroStrategy.
 Lesson 98 · 12 minGetting Started with Power BI Desktop: Install and ViewsThe lesson explains what Power BI is, why it is chosen, and where DAX formulas fit in. The instructor describes two install routes, the website or the Microsoft Store, and the three Desktop views: Report View, Data View and Model View.
 Lesson 99 · 11 minPower BI Query Editor, Data Connectors and Table CleanupThe instructor introduces the Power Query editor, reached through Transform Data on the Home tab, and the categories of data connectors under Get Data. A demo loads a Superstore Excel workbook, promotes the first row to headers, removes blank rows, and applies the changes to the model.
Which lessons of Medical Data Analytics & Visualization are free?
The first 9 lessons are free on Grow by Skill-Lync: 3 h 12 min of video from Skill-Lync's Medical Data Analytics & Visualization course that you can watch here at no cost: leave your name and phone number once and they play (as of 16 Nov 2026). The full course is paid (₹40,000); its other 114 lessons are listed in the outline below so you can see what each one covers.
How long is the Medical Data Analytics & Visualization course?
The full course has 123 lessons and 54 h 21 min of recorded video, plus the projects and assignments that come with enrolment. The free lessons alone take about 3 h 12 min, so you can finish them in an evening and decide whether to continue.
What comes after the free lessons?
Lesson 4 onwards is in the paid Medical Data Analytics & Visualization course on Skill-Lync, with mentor support and a certificate. A counsellor can tell you which course or program fits your goal.