 Free · 3 lessons · no payment
Data Analysis and Visualization with Tableau: 3 free lessons
Three free lessons from Skill-Lync's Data Analysis and Visualization with Tableau course. They introduce Tableau products, roles and license types and why a live dashboard beats a PPT, then connect Tableau to Excel with live versus extract connections, and build bar, lollipop, scatter, treemap and heat map charts from the Data pane.
Last updated 16 Nov 2026 · 3 free lessons (1 h 18 min) · full course: 48 lessons (23 h 51 min), paid · ₹40,000
 Free lesson 1 · 19 minTableau Introduction: Products, Roles and Why It Beats a PPT
What will you learn in the free Data Analysis and Visualization with Tableau lessons?
- Tableau developer and admin roles and license types
- Live versus extract connections with Excel data
- Bar charts and a lollipop chart using dual axis
- Scatter plots, treemaps and heat maps
Free lessons you can watch now
- Lesson 1 · 19 minTableau Introduction: Products, Roles and Why It Beats a PPTIntroduces Tableau as a drag and drop visual analytics platform and the week's agenda. Covers products and roles such as developer and admin, license types, and how a live, filterable dashboard replaces manual PowerPoint reporting.
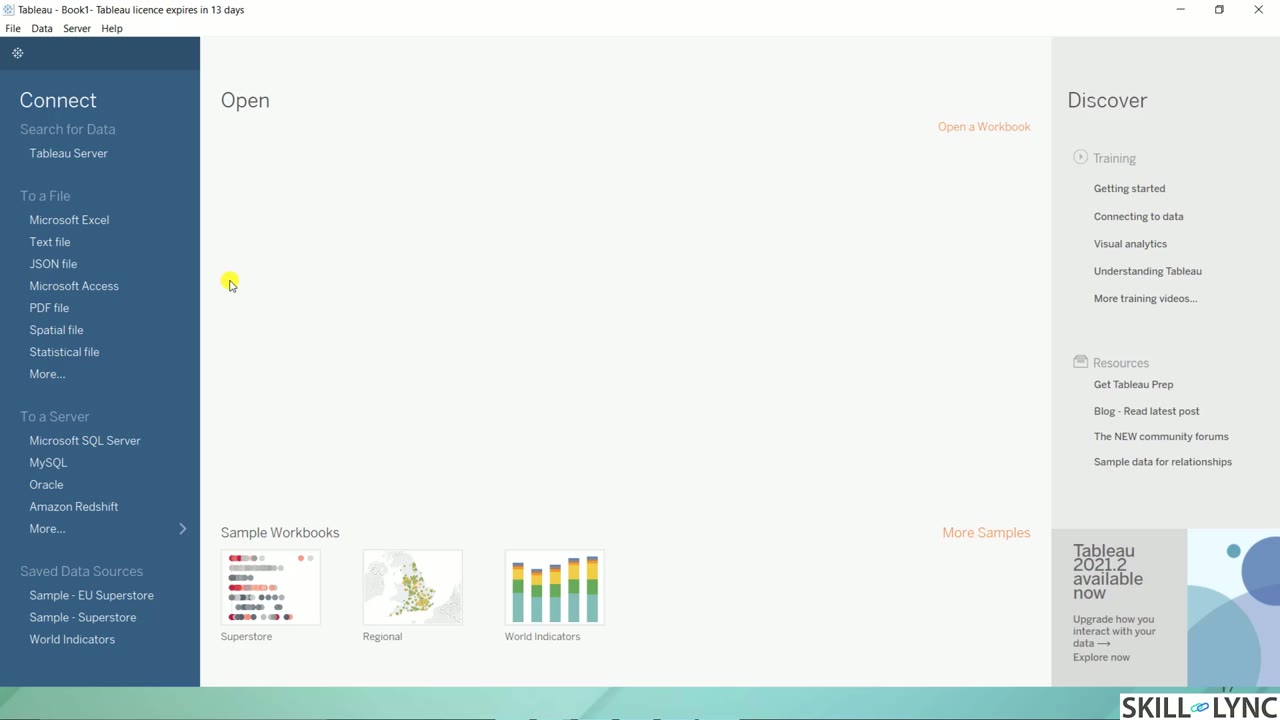 Lesson 2 · 30 minConnect Tableau to Excel: Live vs Extract ConnectionsDemonstrates Tableau Desktop's start page and connecting an Excel practice file. Explains the data source page, logical and physical canvas layers, live versus extract connections with a hospital example, extract options, and saving workbooks on Tableau Public.
 Lesson 3 · 29 minTableau Data Pane and Quick Charts: Bar, Lollipop, ScatterReviews week one, then tours the Data pane and builds quick visualizations from the sample data. Covers bar charts, a lollipop chart using dual axis, scatter plots, treemaps and heat maps, with marks, pages shelf and analytics pane in the agenda.
Which lessons of Data Analysis and Visualization with Tableau are free?
The first 3 lessons are free on Grow by Skill-Lync: 1 h 18 min of video from Skill-Lync's Data Analysis and Visualization with Tableau course that you can watch here at no cost: leave your name and phone number once and they play (as of 16 Nov 2026). The full course is paid (₹40,000); its other 45 lessons are listed in the outline below so you can see what each one covers.
How long is the Data Analysis and Visualization with Tableau course?
The full course has 48 lessons and 23 h 51 min of recorded video, plus the projects and assignments that come with enrolment. The free lessons alone take about 1 h 18 min, so you can finish them in an evening and decide whether to continue.
What comes after the free lessons?
Lesson 4 onwards is in the paid Data Analysis and Visualization with Tableau course on Skill-Lync, with mentor support and a certificate. For a career in Software & data, the Post Graduate Program in Data Science and Machine Learning goes further with industry projects and placement support.