
Core and Advanced Python Programming
English Dictionary App
You will have to create an English Dictionary App that responds with definitions of English words according to the given input.

Our data science course syllabus includes training in data analysis software, machine learning and advanced mathematics. Work on industry-relevant data sets and build skills to help you get your dream job.
As data and statistics run operations across all industries, data scientists with a practical understanding of programming, statistics, and machine learning algorithms are in demand. This program is designed to give engineers the skills they need to secure job roles in the industry.
By enrolling in this program, you will
After completing this program, you will have the skills needed to apply for the following job roles:
You can also pursue higher education in the following domains:
In this week, students will learn about
In this week, students will learn about
In this week, you will learn about
In this week, students will learn about
In this week, students will learn about
In this week, students will learn about
In this week, students will learn about
In this week, students will learn about
In this week, students will learn about
In this week, students will learn about
In this week, you will get a hands-on understanding of the following
In this week, you will get a hands-on understanding of the following
Tableau software allows businesses to clearly visualize, analyze, and report large data sets. In the industry, Tableau is a business intelligence tool used to make decisions supported by data. In order to develop effective dashboards and data visuals that can be studied and interpreted, learners must understand the UI and basic features.
This week will cover
The Tableau workspace has features such as shelves, cards, the Data Pane, Analytics Pane, toolbars, and menus. Each of these features has a specific function that learners must understand how to use when working with Tableau.
This week will cover
As not all types of data are the same, Tableau supports 7 different data types, which can be sorted and grouped according to requirements. In order to present and organize data visually, learners should understand the features of Tableau related to data types and sorting.
This week will cover
There are six different filters available for users on Tableau, each with their own unique function. By using filters, datasets can be condensed to illustrate concise information, thus improving the efficiency of dashboards. Data in a table can also be analyzed through performing table calculations. These features are essential for learners, as they can be used to develop efficient and concise dashboards.
This week will cover
Spreadsheets with data can be transformed into visually interactive dashboards that present the information. Dashboards can be combined with spreadsheets to tell a story and narrate performance through measured parameters. By learning the best practices, learners can design and develop effective dashboards and stories for businesses.
This week will cover
Tableau workbooks can be shared, exported, and published as required. As many individuals may work on a dashboard together, it is important for learners to understand how distribution and publishing work.
This week will cover
Tableau is also used to perform data blending and data joining. Through joining, data in tables and sheets from the same source can be combined. Data blending lets users combine data from different sources. It is important for learners to understand joins and blending as both are often required in the industry.
This week will cover
When analyzing data on Tableau, Relationships let you combine data from different tables. It is important for learners to understand how to work with multiple sets of data for effective analysis and visualization.
This week will cover
Before data is used in business intelligence, it goes through data preparation. This involves collecting, combining, and systematically organizing the dataset before it gets processed. It is important for learners to understand the parameters considered when preparing data.
This week will cover
When working with large sets of data, Tableau lets users perform advanced calculations and analytics to draw accurate inferences. It is important for learners to understand how to perform advanced calculations using Tableau to meet industry standards.
This week will cover
Nested LOD is an advanced topic in Tableau that lets users assess data sets in-depth. Users can also build maps using Tableau, and understand the related data. As certain data sets may require mapping functions, and analysis in-depth, it is important to know about these concepts.
This week will cover
Through dynamic designs, values in dashboards can automatically change when related data is modified. As it is common for data sets to have changing values, knowing how to work with dynamic designs is an essential skill for learners.
This week will cover
To use Excel for data analysis and visualization, learners must first understand how to navigate the UI. It is also important to know about the basic formatting, shortcuts, and features of Microsoft Excel.
In this week, you will learn about
Functions in Excel can be used to execute logical, mathematical, or statistical calculations on data in the spreadsheet. For ease of analysis and interpretation, data should be arranged in a legible manner using rows and columns. Learners must understand the basic Excel features to effectively work with data on the spreadsheet.
In this week, you will learn about
When working with data sets, it is important to format the information according to a given set of specifications. This lets users organize, understand, and process the information with ease. Users can also insert charts to visualize the information in the data set. Knowing how to organize and present data is a vital skill for learners.
In this week, you will learn about
Excel Templates let users create spreadsheets with a common format. It is important to understand how to use these templates, as well as how to format the layout of a spreadsheet to print it. In addition to this, learners must also know how to insert tables into their spreadsheet to present their data and findings.
In this week, you will learn about
Conditional functions are commonly used in logical operations when cells must fulfill specific conditions. When working with data, it is important to understand how conditional functions are integrated into an Excel spreadsheet.
In this week, you will learn about
Pivot Tables are used to summarize, calculate, and study a dataset in order to identify patterns or draw comparisons. When sorting through large sets of data, Lookup functions are used to identify values of data in a column or row that matches the value in a particular position. It is important for learners to understand the use of Pivot Tables and Lookup Functions when working with data sets in Excel.
In this week, you will learn about
Power Query is a tool in Excel that lets users import data from a variety of sources. Using this tool, users can organize, reshape, and transform the data as needed in order to then create reports or visual charts. Learners must understand how the Power Query tool works as it is essential in business and industries that are driven by data.
In this week, you will learn about
Using Power Pivot in Excel, users can import large sets of data, and analyze it without reductions in speed or functionality. This feature allows users to develop data models and merge data from different sources. Power Pivot is an essential skill for learners to have when it comes to working with large data sets.
In this week, you will learn about
Information collected in the industry is often in the form of large data sets with raw information. It is important for learners to know how to sort through this data, and validate it to ensure maximum quality.
In this week, you will learn about
Operations can be performed on lists of data which are often found in rows or columns of an Excel spreadsheet. Repetitive tasks can also be automated using macros in Excel. It is important for learners to know the functions used to analyze data in lists, as well as the use of Macros to automate tasks.
In this week, you will learn about
Using Visual Basic for Applications (VBA), users can automate tasks by making macros. This optimizes the efficiency of a spreadsheet, and lets users carry out many functions at once. It is important for learners to understand how and why VBA is used in Excel.
In this week, you will learn about
With Excel, users can send out emails to a set of people automatically through email automation. This feature optimizes time and efficiency, which is important in the industry when working with a large number of people.
In this week, you will learn about
This week will cover
This week will cover
This week will cover
This week will cover
This week will cover
This week will cover
This week will cover
This week will cover
This week will cover
This week will cover
This week will cover
This week will cover
This week, you will learn about
This week, you will learn about
This week, you will learn about
This week, you will learn about
This week, you will learn about
This week, you will learn about
This week, you will learn about
This week, you will learn about
This week, you will learn about
This week, you will learn about
This week, you will learn about
This week, you will learn about
This week will cover
This week will cover
This week will cover
This week will cover
This week will cover
This week will cover
This week will cover
This week will cover
This week will cover
This week will cover
This week will cover
This week will cover
This week will cover
This week will cover
This week will cover
This week will cover
This week will cover
This week will cover
This week will cover
This week will cover
This week will cover
This week will cover
This week will cover
To use Excel for data analysis and visualization, learners must first understand how to navigate the UI. It is also important to know about the basic formatting, shortcuts, and features of Microsoft Excel.
In this week, you will learn about
Functions in Excel can be used to execute logical, mathematical, or statistical calculations on data in the spreadsheet. For ease of analysis and interpretation, data should be arranged in a legible manner using rows and columns. Learners must understand the basic Excel features to effectively work with data on the spreadsheet.
In this week, you will learn about
When working with data sets, it is important to format the information according to a given set of specifications. This lets users organize, understand, and process the information with ease. Users can also insert charts to visualize the information in the data set. Knowing how to organize and present data is a vital skill for learners.
In this week, you will learn about
Excel Templates let users create spreadsheets with a common format. It is important to understand how to use these templates, as well as how to format the layout of a spreadsheet to print it. In addition to this, learners must also know how to insert tables into their spreadsheet to present their data and findings.
In this week, you will learn about
Conditional functions are commonly used in logical operations when cells must fulfill specific conditions. When working with data, it is important to understand how conditional functions are integrated into an Excel spreadsheet.
In this week, you will learn about
Pivot Tables are used to summarize, calculate, and study a dataset in order to identify patterns or draw comparisons. When sorting through large sets of data, Lookup functions are used to identify values of data in a column or row that matches the value in a particular position. It is important for learners to understand the use of Pivot Tables and Lookup Functions when working with data sets in Excel.
In this week, you will learn about
Power Query is a tool in Excel that lets users import data from a variety of sources. Using this tool, users can organize, reshape, and transform the data as needed in order to then create reports or visual charts. Learners must understand how the Power Query tool works as it is essential in business and industries that are driven by data.
In this week, you will learn about
Using Power Pivot in Excel, users can import large sets of data, and analyze it without reductions in speed or functionality. This feature allows users to develop data models and merge data from different sources. Power Pivot is an essential skill for learners to have when it comes to working with large data sets.
In this week, you will learn about
Information collected in the industry is often in the form of large data sets with raw information. It is important for learners to know how to sort through this data, and validate it to ensure maximum quality.
In this week, you will learn about
Operations can be performed on lists of data which are often found in rows or columns of an Excel spreadsheet. Repetitive tasks can also be automated using macros in Excel. It is important for learners to know the functions used to analyze data in lists, as well as the use of Macros to automate tasks.
In this week, you will learn about
Using Visual Basic for Applications (VBA), users can automate tasks by making macros. This optimizes the efficiency of a spreadsheet, and lets users carry out many functions at once. It is important for learners to understand how and why VBA is used in Excel.
In this week, you will learn about
With Excel, users can send out emails to a set of people automatically through email automation. This feature optimizes time and efficiency, which is important in the industry when working with a large number of people.
In this week, you will learn about
Tableau software allows businesses to clearly visualize, analyze, and report large data sets. In the industry, Tableau is a business intelligence tool used to make decisions supported by data. In order to develop effective dashboards and data visuals that can be studied and interpreted, learners must understand the UI and basic features.
This week will cover
The Tableau workspace has features such as shelves, cards, the Data Pane, Analytics Pane, toolbars, and menus. Each of these features has a specific function that learners must understand how to use when working with Tableau.
This week will cover
As not all types of data are the same, Tableau supports 7 different data types, which can be sorted and grouped according to requirements. In order to present and organize data visually, learners should understand the features of Tableau related to data types and sorting.
This week will cover
There are six different filters available for users on Tableau, each with their own unique function. By using filters, datasets can be condensed to illustrate concise information, thus improving the efficiency of dashboards. Data in a table can also be analyzed through performing table calculations. These features are essential for learners, as they can be used to develop efficient and concise dashboards.
This week will cover
Spreadsheets with data can be transformed into visually interactive dashboards that present the information. Dashboards can be combined with spreadsheets to tell a story and narrate performance through measured parameters. By learning the best practices, learners can design and develop effective dashboards and stories for businesses.
This week will cover
Tableau workbooks can be shared, exported, and published as required. As many individuals may work on a dashboard together, it is important for learners to understand how distribution and publishing work.
This week will cover
Tableau is also used to perform data blending and data joining. Through joining, data in tables and sheets from the same source can be combined. Data blending lets users combine data from different sources. It is important for learners to understand joins and blending as both are often required in the industry.
This week will cover
When analyzing data on Tableau, Relationships let you combine data from different tables. It is important for learners to understand how to work with multiple sets of data for effective analysis and visualization.
This week will cover
Before data is used in business intelligence, it goes through data preparation. This involves collecting, combining, and systematically organizing the dataset before it gets processed. It is important for learners to understand the parameters considered when preparing data.
This week will cover
When working with large sets of data, Tableau lets users perform advanced calculations and analytics to draw accurate inferences. It is important for learners to understand how to perform advanced calculations using Tableau to meet industry standards.
This week will cover
Nested LOD is an advanced topic in Tableau that lets users assess data sets in-depth. Users can also build maps using Tableau, and understand the related data. As certain data sets may require mapping functions, and analysis in-depth, it is important to know about these concepts.
This week will cover
Through dynamic designs, values in dashboards can automatically change when related data is modified. As it is common for data sets to have changing values, knowing how to work with dynamic designs is an essential skill for learners.
This week will cover
In this week, students will learn about
In this week, students will learn about
In this week, you will learn about
In this week, students will learn about
In this week, students will learn about
In this week, students will learn about
In this week, students will learn about
In this week, students will learn about
In this week, students will learn about
In this week, students will learn about
In this week, you will get a hands-on understanding of the following
In this week, you will get a hands-on understanding of the following
This week will cover
This week will cover
This week will cover
This week will cover
This week will cover
This week will cover
This week will cover
This week will cover
This week will cover
This week will cover
This week will cover
This week will cover
This week will cover
This week will cover
This week will cover
This week will cover
This week will cover
This week will cover
This week will cover
This week will cover
This week will cover
This week will cover
This week will cover
This week, you will learn about
This week, you will learn about
This week, you will learn about
This week, you will learn about
This week, you will learn about
This week, you will learn about
This week, you will learn about
This week, you will learn about
This week, you will learn about
This week, you will learn about
This week, you will learn about
This week, you will learn about
This week will cover
This week will cover
This week will cover
This week will cover
This week will cover
This week will cover
This week will cover
This week will cover
This week will cover
This week will cover
This week will cover
This week will cover
Our projects are designed by experts in the industry to reflect industry standards. By working through our projects, Learners will gain a practical understanding of what they will take on at a larger-scale in the industry. In total, there are 18 Projects that are available in this program.
You will have to create an English Dictionary App that responds with definitions of English words according to the given input.
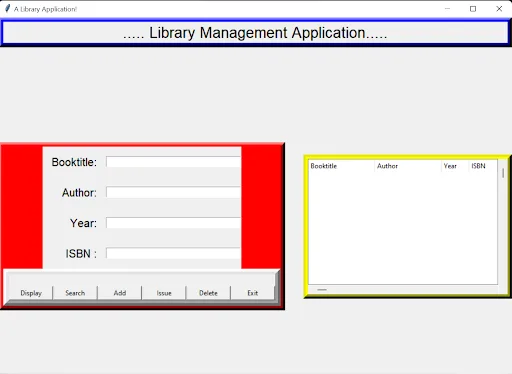
You have to develop a Library Book Management System based on given inputs. The Management System will be implemented with the front-end GUI developed using Tkinter and the backend…
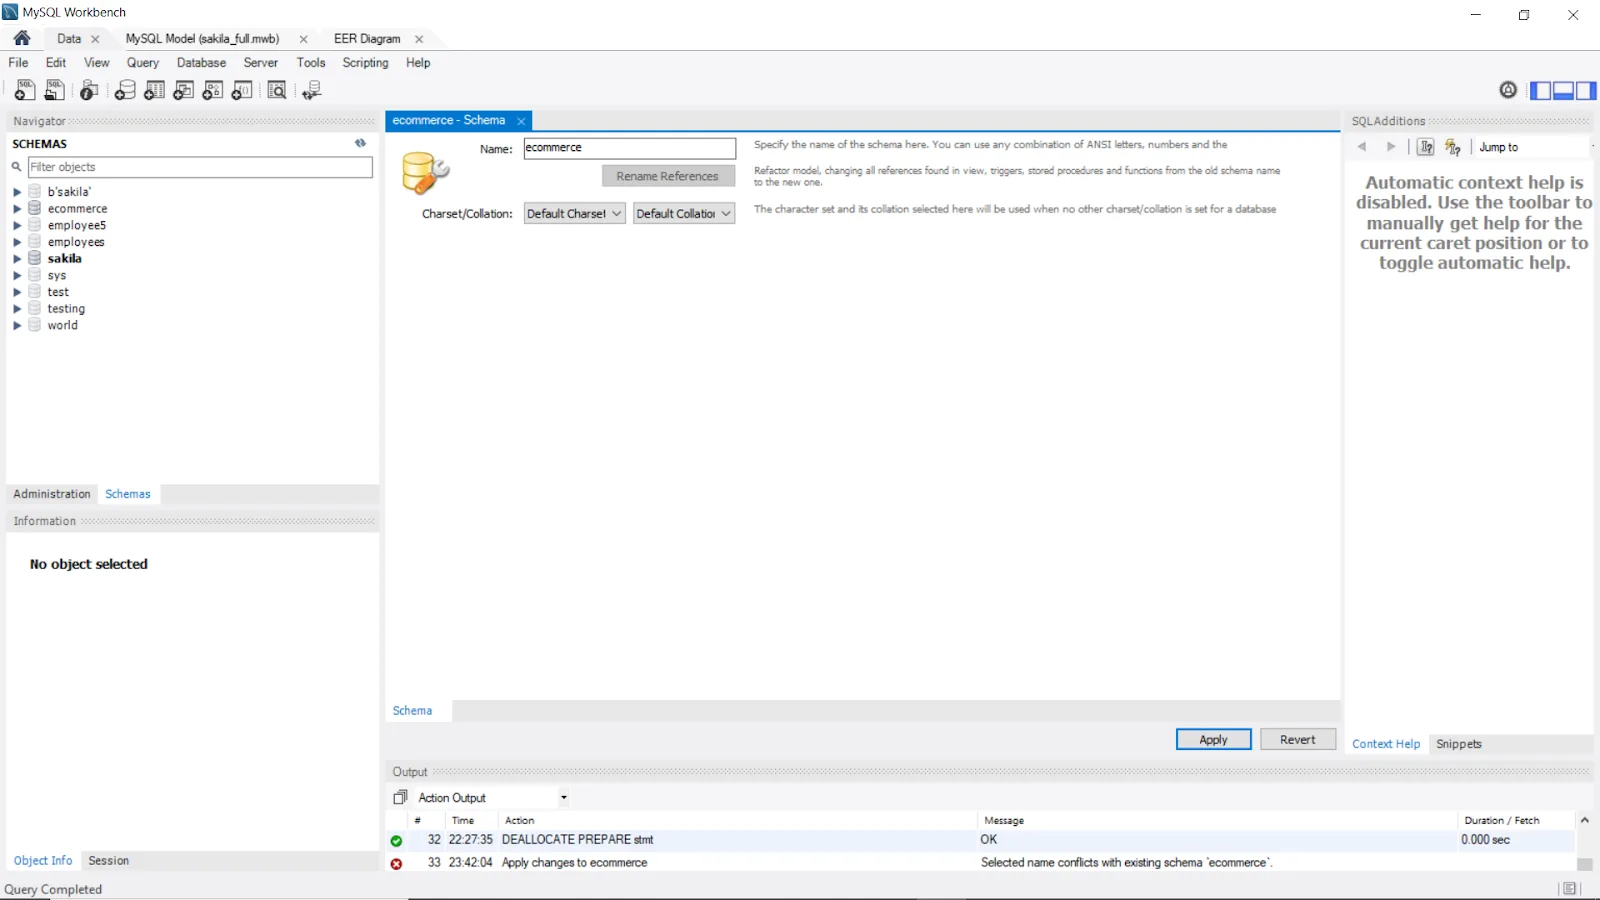
In this project, students are expected to analyze user behavior in a C2C E-Commerce business. Analyzing the user’s database will help understand the business perspective. The…
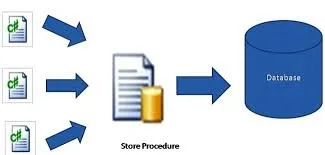
In this project, students are expected to analyze the career choices of alumni from an institution based on given data.
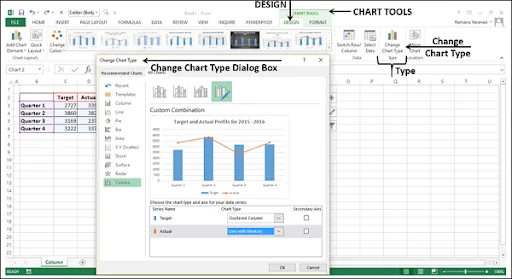
In this project, you will be given a large set of data from ABC Private Limited that is manufacturing and selling various types of automobiles. With this information, you will have…
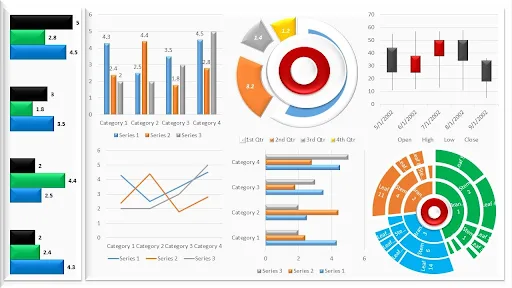
You will be given a set of data about loan applicants that will have to be analysed and presented with Dashboard in Excel. With the given data, you will have to make separate sprea…
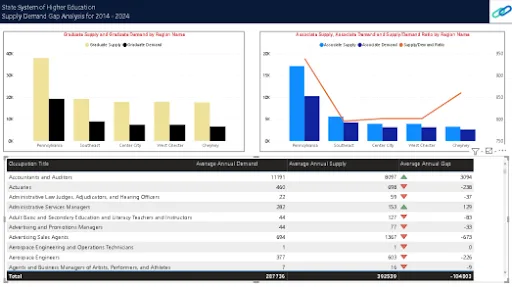
Learners will have to identify the gap between demand and supply so that organizations can take action to minimize those gaps. The candidates can choose any domain, like Human Reso…
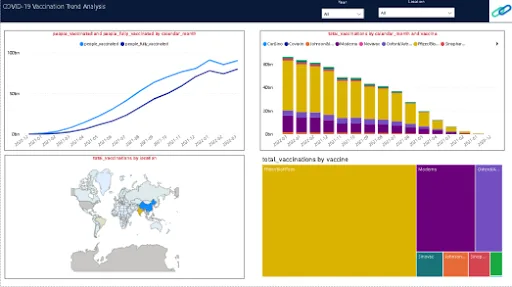
In this project, learners have to track and analyze COVID-19 vaccination trends to see doses administered by manufacturer, country, region, age, and gender. This project requires l…
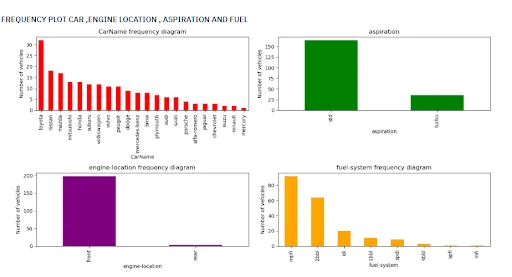
In this project, you will perform descriptive analysis on given data regarding cars. Using the data, you will have to classify cars based on various parameters and analyze the pric…
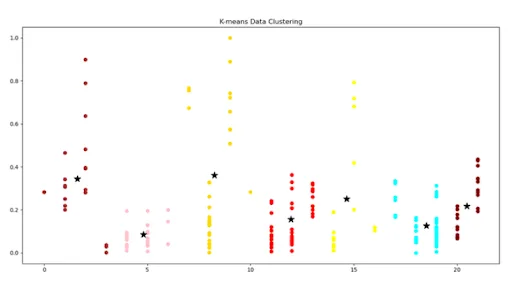
In this project, you will have to clean a data set regarding cars and implement the clustering algorithm using K-Means. You will then have to explain the results and find the optim…

In this project, you will perform logistic regression and gradient descent on a given dataset using Python.

In this project, you will have to work on prediction of machine failure for a given dataset using ANN (Hyperparameters is completely dependent on individuals to come up with the be…
+ 6 more projects in the full syllabus
Become job ready with our comprehensive industry focused curriculum for freshers & early career professionals
Data Science and Analytics lets you analyze Big Data and use it for various purposes like research, marketing, advertising, etc.
Data Science professionals generally work in industries like Information Technology, BFSI, Healthcare, Telecommunications, Retail, Digital Marketing, Automotive, Cyber Security etc.
Blended learning refers to a combination of instructor-led, live classes and online classes. This post-graduation in data science offers the right mix of online and offline sessions, along with practical projects.
Depending on experience and course quality, a Data Science engineer may earn anything between INR 6 lakh and INR 25 lakh per annum. Courses in data science and analytics will give you a chance to pursue a lucrative career.
Almost anyone with a degree in Science or Technology may study Data Science. Business graduates can also take up this program in Data Science.
The data science course duration is 24 weeks.
Skill-Lync delivers data science courses online.
Through the data science certification course, you will learn Machine Learning, Artificial Intelligence, Python, Tableau, and Power BI. You will also understand advanced mathematics and Excel, alongside data visualization.
Skill-Lync is among India's leading EdTech platforms dedicated to transforming engineering education. We equip young engineers with the latest skill sets and cutting-edge tools in new-age technologies.
The brainchild of two engineers from Chennai, Skill-Lync, is on a mission to bridge the skill gap between aspiring professionals and the industry's demands through job-oriented courses.
A counsellor will walk you through the syllabus, projects and fee options — and tell you honestly if another course suits you better.