Supply and Demand Gap Analysis
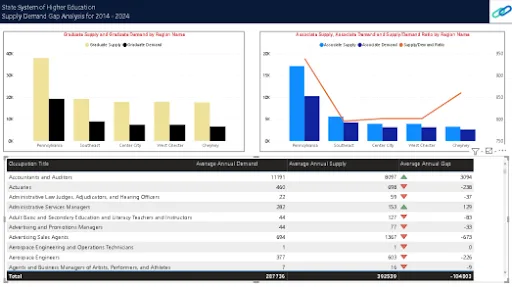
Learners will have to identify the gap between demand and supply so that organizations can take action to minimize those gaps. The candidates can choose any domain, like Human Reso…
DussehraFestive scholarship on Skill-Lync courses, this week onlyFestive scholarship is openOffer ends Wed, 21 Oct, 11:59 pm IST.

Become an expert in the development of effective visual dashboards using Power BI.
Business intelligence tools like Power BI drive organizations towards better decision outcomes that put them ahead of competitors in the industry. With Power BI, businesses can effectively visualize and interpret data to make informed decisions, as well as draw strategic insights about the future. As data interpretation and visualization is crucial to business across all industries, an understanding of Power BI has become an essential element.
Who can take this course?
Engineering graduates and working professionals with a background in similar fields.
This week will cover
This week will cover
This week will cover
This week will cover
This week will cover
This week will cover
This week will cover
This week will cover
This week will cover
This week will cover
This week will cover
Our projects are designed by experts in the industry to reflect industry standards. By working through our projects, Learners will gain a practical understanding of what they will take on at a larger-scale in the industry. In total, there are 2 Projects that are available in this program.
Learners will have to identify the gap between demand and supply so that organizations can take action to minimize those gaps. The candidates can choose any domain, like Human Reso…
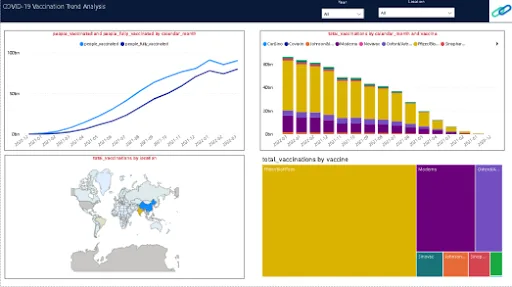
In this project, learners have to track and analyze COVID-19 vaccination trends to see doses administered by manufacturer, country, region, age, and gender. This project requires l…
Become job ready with our comprehensive industry focused curriculum for freshers & early career professionals
Students and graduates of computer science and related engineering streams can take the BI reporting course.
Yes, the BI reporting course is 100% online.
This advanced BI reporting course is 7 weeks long and covers all the concepts any BI developer must be aware of.
According to Payscale, the average annual of a BI developer ranges from ₹300,000 - ₹ 1,108,000. However, your pay package varies with your experience and skills.
Yes, you shall be given a course completion certificate after completing the Power BI course. The top 5% of the scorers will receive a merit certificate alongside the course completion certificate.
Yes, you can clear your doubts during coursework from our technical support team through email and forum support.
Skill-Lync is among India’s leading EdTech platforms dedicated to transforming engineering education. We equip young engineers with the latest skill sets and cutting-edge tools in new-age technologies.
The brainchild of two engineers from Chennai, Skill-Lync, is on a mission to bridge the skill gap between aspiring professionals and the industry’s demands through job-oriented courses.
A counsellor will walk you through the syllabus, projects and fee options — and tell you honestly if another course suits you better.