WIDE OPEN THROTTLE CONDITION (WOT) CONDITION
PROJECT 2 – WIDE OPEN THROTTLE CONDITION (WOT) CONDITION
AIM –
To calculate Wide Open Throttle Condition (WOT).
OBJECTIVES –
- To find the ratio of Hill –Climbing power required by the fully loaded TATA Ultra truck to the half loaded one.
- To calculate the minimum length of the flyover considering the minimum height of the summit should be 5.5 meters.
- To prepare the new drive cycle excel file for the driver glider model and also include hill climbing angle to it.
- To model the WOT (Wide Open Throttle) response of GM Ev1 car & compare it with the official figures of the performance of the real vehicle.
- To show variation in acceleration time with a 5% change in vehicle parameters.
SOLUTION –
- To find the ratio of Hill-Climbing power required by fully loaded TATA Ultra truck to the Half loaded one.
TATA T.11 Model is selected for calculations –
CASE I – Truck is fully loaded
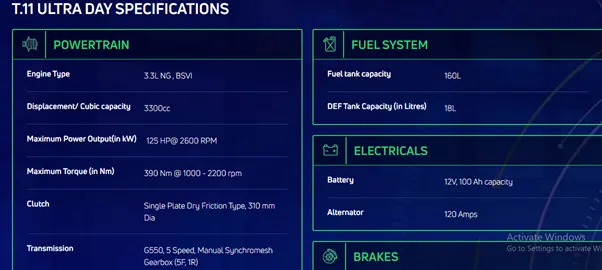
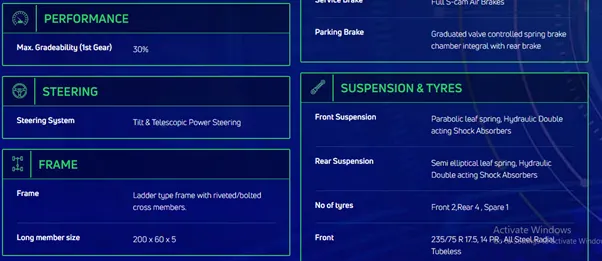

The given specification of TATA T.11 Model are as given above –
CASE 1 – Truck is fully Loaded
Kerb Weight – 3630 kg.
Payload Weight – 7360 kg.
Gross – Vehicle Weight (m) = Kerb Weight + Payload Weight = 3630 + 7360 = 10990 kg.
Gradeability = 30% = 16.69 degrees.
Speed(Velocity) = 30 kmph.
Hill climbing force is given by,
Fhc = mgsin(`theta`)
Fhc = 10990 * 9.8 * sin(16.69 )
Fhc = 30931.29 N.
Power required at full load,
P = Fhc * V
= 30931.29* 30 * 5/18
P = 257758.33 W.
CASE II – Truck is half loaded
Payload Weight = 7360/2 = 3680 kg;
Kerb weight = 3630kg;
Gross vehicle weight (m) = Kerb weight + Payload Weight = 3680 + 3630 = 7310kg;
Gradeability = 16.69 degrees.
Speed(Velocity) = 30 kmph.
Hill climbing force is given by,
Fhc = mgsin(`theta`)
Fhc = 7310* 9.8 * sin(16.69 )
Fhc = 20573.95 N.
Power required at full load,
P = Fhc * V
= 20573.95* 30 * 5/18
P = 171449.63 W.
Ratio = Power at full load / Power at half load
= 257758.33 / 171449.63
= 1.50
The Ratio is equal to 1.5
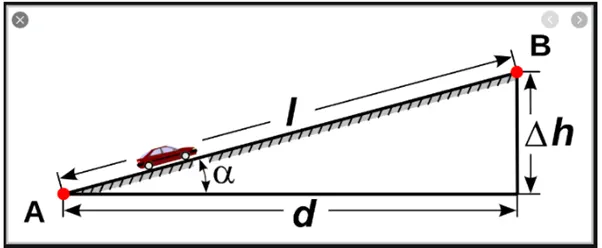
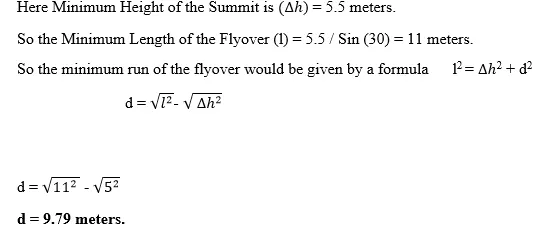
- Calculate Minimum length of the flyover considering the minimum height at the summit should be 5.5 meters.
Gradeability – Greadeability is the truck’s or any other vehicles’ ability to climb slopes. OR it can be defined as - ability of the vehicle to negotiate a grade/ slope in Gross Vehicle Weight Condition (GVW).
Let’s assume the slope angle = 30 Degree.
- To prepare a new drive cycle excel file for the driver glider model and also include a hill climbing angle to it & prepare a new drive cycle excel file having third column representing hill climbing angle corresponding to speed and time. Revise the model for file “Driver_Glider.slx” such that it can calculate gradient force from drive cycle.
MODIFIED DRIVER GLIDER –
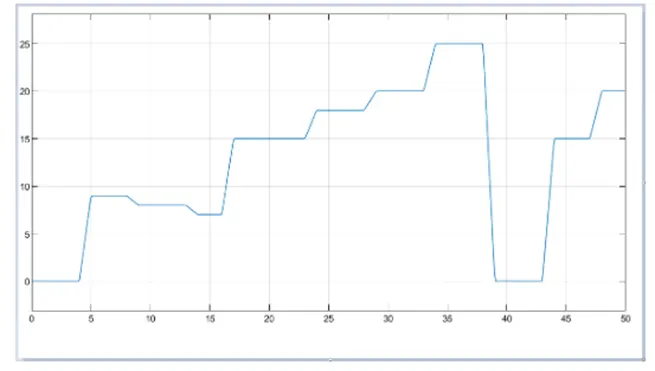
The link to the excel data for velocity of a vehicle at a particular time is given below
https://drive.google.com/file/d/1Ne290YRgZwtE28DTeDG54TSb2VVG-R1T/view?usp=sharing
the velocity of the vehicle in the spreadsheet is converted to m/s from km/hr. the vehicle data is assumed to be for 2 minutes for 1 second gap interval.
Steps to prepare for drive cycle -
- At first, Open MATLAB & then open ‘Drive Cycle’ excel sheet by double clicking.
2.Then change the output type as ‘column vectors’ & this will select two columns ‘Time’ & ‘Velocity’ Separately & then click on import data to load the data to load the data in the workspace.
- Define ‘Drive_Cycle’ as an array of Time and Velocity in command window.
- Then open the Driver Glider Model file and import ‘Drive_Cycle’ file.
- Include hill climbing angle, double click on ‘Glider’ block, then click on ‘Grade Force’ block. Change the value of inclination angle.
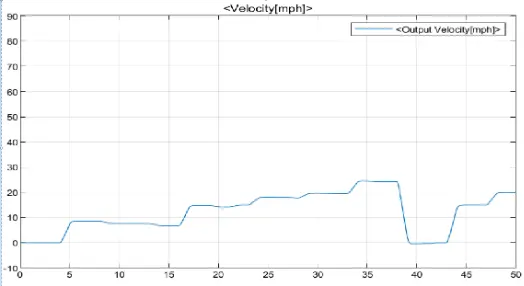
- Then model is run and we get the graph of ‘Time vs. Velocity’ along with effect of inclination angle.
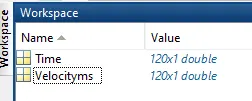
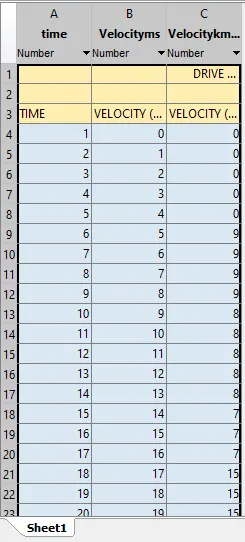
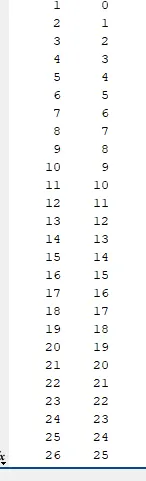
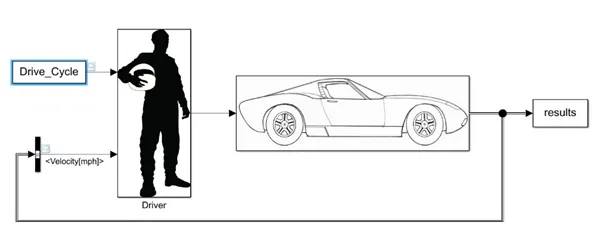
Driver glider Model File and imported ‘Drive_Cycle’ file.
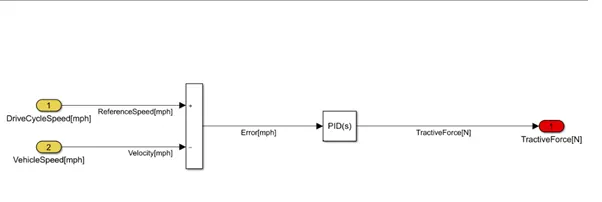
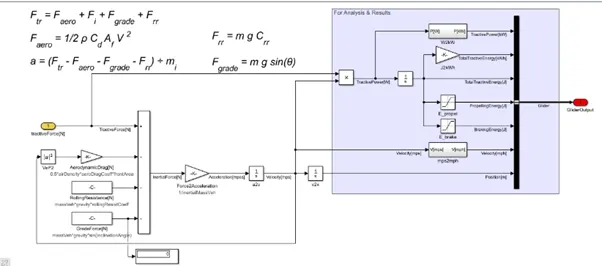
PLOT OF INPUT VELOCITY GIVEN FROM SPREADSHEET –
PLOT OF OUTPUT VELOCITY GIVEN AS INPUT TO DRIVER
INSIDE SLOPE ANGLE TO CALCULATE HILL CLIMBING FORCE FROM EXCEL SPREADSHEET –
https://drive.google.com/file/d/1saSuqQiXg3XJyfm33_OFvWnLnh_0dyyo/view?usp=sharing
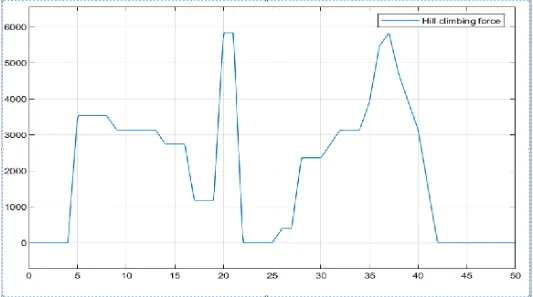
Results –
- As the inclination of the angle increases, vehicle will require more force to move the vehicle and to overcome the grade.
- Input velocity and input slope angle with respect to time and calculated gradient force from drive cycle.
- Model the WOT Condition (Wide Open Throttle) response of Ev1 Car. Compare it with the official figures for the performance of the real vehicle. Prepare a table showing variation in acceleration time with 5% change in vehicle parameters.
GM Ev1 Details –
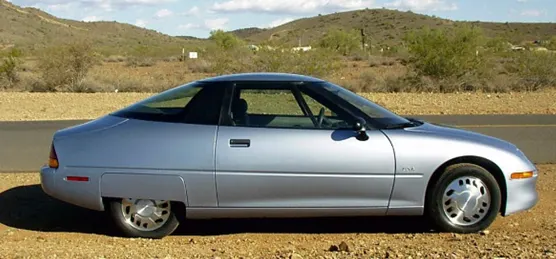
The general motors Ev1 was an electric car produced and leased by General Motors from 1996 to 199. It was first mass produced & purpose designed electric vehicle of the modern era from a major automaker, the first GM car designed to be an electric vehicle from the outset along with being the first and only passenger car to be marketed under the corporate General Motors (GM0 name instead of being branded under one of its divisions.
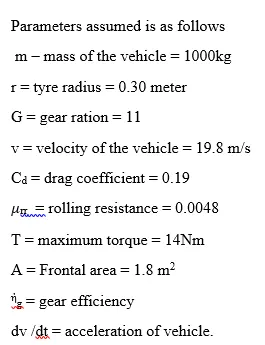
Governing equation for acceleration time is as follows

CASE I – CONSIDERING ORIGINAL PARAMTERS.
% WOT SIMULATION OF GM's Ev1
clear all
close all
 clc
 % Response of GM Ev1
 % iNPUT DATA
 % 0 TO 30 IN 301 VALUES
 t = linspace (0,30,301);
 % 301 Reading of Velocity
 vel = zeros(1,301);
 dt = 0.1;

 for n = 1: 300
     if vel(n) < 19.8
         vel(n + 1) = vel(n) + dt*(3.08-(0.000137*(vel(n)^2)));
     else if vel(n) > 19.8
             vel(n+1) = vel(n)+dt*((62.1/vel(n))-0.046-(0.000137*(vel(n)^2)));
         end
         if vel(n) > 36
             vel(n + 1) = vel(n);
         end
     end
 end

% PLOTTING OF GM Ev1 WITH ORIGINAL PARAMETERS
vel = vel.*3.6;
figure(1)
plot(t,vel);
axis([0 30 0 140]);
xlabel('Time(sec)');
ylable('velocity(kmph)');
title('WOT OF GM Ev1 CAR');
grid on
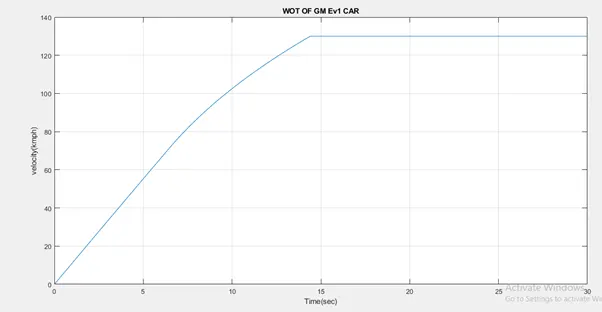
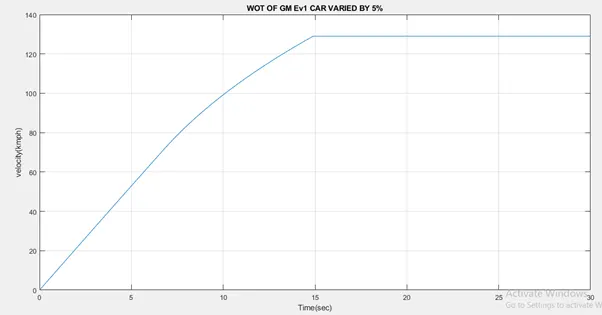
CASE II – 5% CHANGE IN PARAMTERS
m – Mass of the vehicle = 1050 kg

A – Frontal Area = 1.9 m2;

% WOT RESPONSE FOR GM Ev1 CAR VARIED BY 5%

vel1 = 0

for n = 1 : 300

   if vel1(n) < 19.8

         vel1(n + 1) = vel1(n) + dt*(2.95-(0.00013*(vel1(n)^2)));

     else if vel1(n) > 19.8

             vel1(n+1) = vel1(n)+dt*((59.14/vel1(n))-0.046-(0.00013*(vel1(n)^2)));

         end

         if vel1(n) > 36

             vel1(n + 1) = vel1(n);

         end

     end

 end


% PLOTTING OF GM Ev1 WITH CHANGE IN PARAMETERS

vel1 = vel1.*3.6;

figure(1)

plot(t,vel1);

axis([0 30 0 140]);

xlabel('Time(sec)');

ylable('velocity(kmph)');

title('WOT OF GM Ev1 CAR VARIED BY 5%');
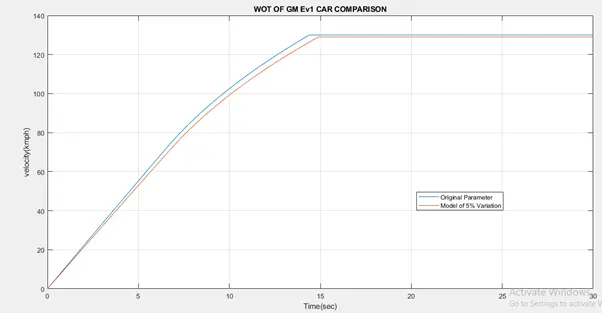
Now we will compare original parameters with 5% varied parameters,
COMPARISON -
% COMPARISON OF ORIGINAL MODEL WITH 5% VARIED PARAMETERD MODEL

figure(3)

plot(t,vel);

hold on

plot(t,vel1);

axis([0 30 0 140]);

xlabel('Time(sec)');

ylabel('velocity(kmph)');

title('WOT OF GM Ev1 CAR COMPARISON');

legend('Original Parameter','Model of 5% Variation')

grid on
CONCLUSION –
- The ration of power required by the fully loaded TATA Ultra truck to half loaded one is approximately equal to 1.5
- He minimum length of the flyover with assured values of gradeability of truck is fouNd to be 9.8 meters.
- The new drive cycle is prepared and driver glider model is simulated including hill climbing angle.
- The 5 % change in vehicle parameters leads to increase acceleration time.
- Mohammed Mannanwhy velocity is written as 30*5/18 from whwer 5/18 has came ??