Week 9 Tension and Torsion test challenge

Introduction
Tension Test:
Tensile testing, also known as tension test. It is a fundamental materials science and engineering test in which a sample is subjected to a controlled tension until failure. Properties that are directly measured via a tensile test are ultimate tensile strength, breaking strength, maximum elongation and reduction in area. From these measurements the following properties can also be determined:
- Young's modulus
- Poisson's ratio
- Yield strength
- Strain-hardening characteristics.
Uniaxial tensile testing is the most commonly used for obtaining the mechanical characteristics of isotropic materials
Torsion Test:
Torsion testing is a type of mechanical testing that evaluates the properties of materials or devices while under stress from angular displacement. Torsion testing can be split into two distinct categories: testing raw materials like metal wires or plastic tubing to determine properties such as shear strength and modulus, or functional testing of finished products subjected to torsion, such as screws, pharmaceutical bottles, and sheathed cables. The most common mechanical properties measured by torsion testing are:
- Modulus of elasticity in shear
- Yield shear strength
- Ultimate shear strength
- Modulus of rupture in shear
- Ductility
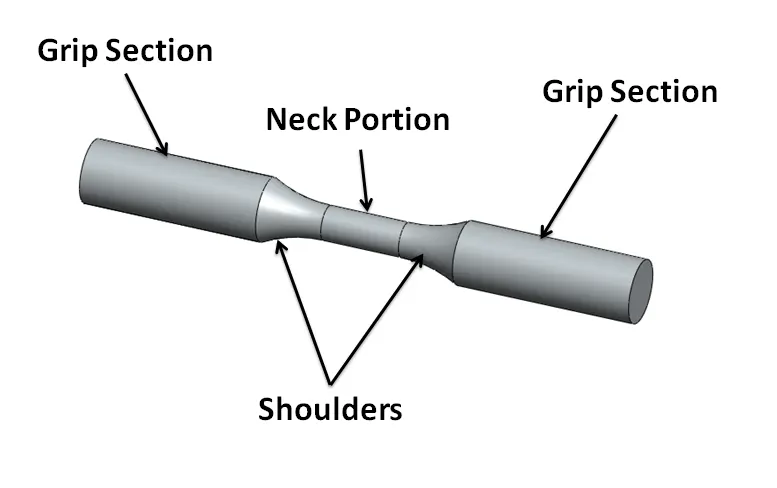
- Torsion testing allows the determination of shear properties in a material. Torsion testing twists a specimen to a specified degree, with a specified force, or until the material fractures. This when combined with tensile testing (either as a combined application of tension and torsion, or sequentially) allows a number of engineering behaviors to be explored that cannot be achieved with uniaxial testing alone. The test can also be performed under fatigue conditions and at elevated temperature.
_____________________________________________________________________________________________________________________
Analysis
Here we will perform Explicit Dynamic analysis for Tension and Torsion test on a specimen.
There will be two different analyses on a same specimen with different type of displacement.
- In Tension test, while keeping the one end fixed, other end will be displaced in linear direction.
- In Torsion test, while keeping the one end fixed, other end will be displaced in the angular direction.
On applying the load of the displacement for Tension and Torsion test, we will measure different parameters such as Stress, Strain and Deformation.
There is an increase in temperature with deformation of a specimen. So we will also measure the temperature for the specimen
_____________________________________________________________________________________________________________________
Geometry:
_________________________________________________________________________________________________________
Material Properties:
_________________________________________________________________________________________________________
Mesh:
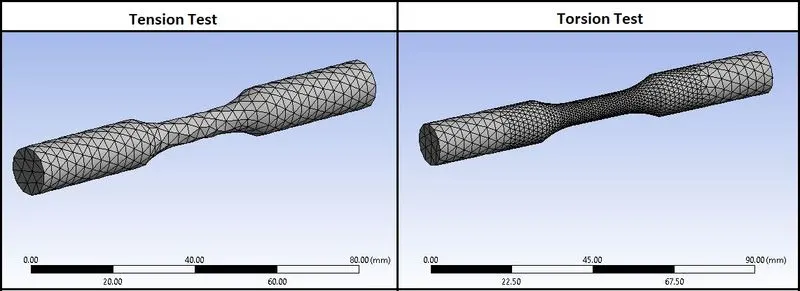
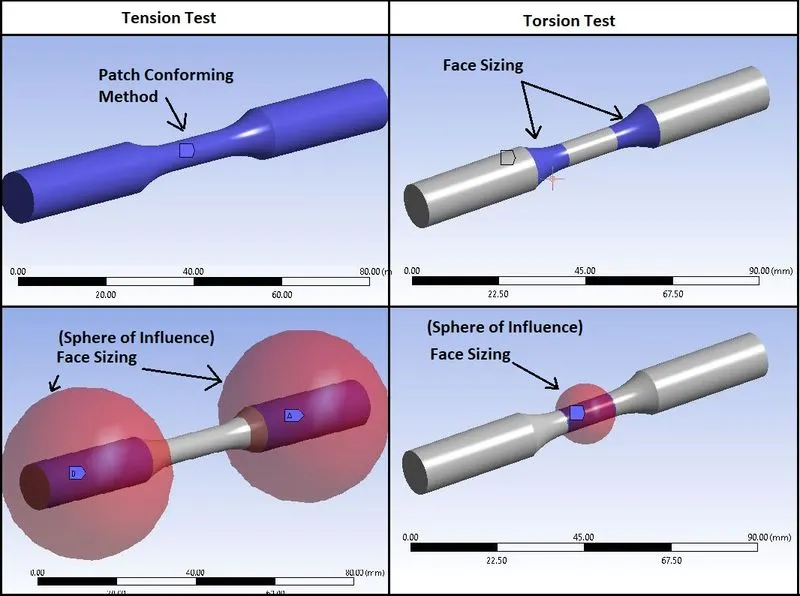
- Here for Tension Test, we have used Patch conforming method and used Tetrahedron meshing for the Specimen body.
- Also for the sizing of the grip section, we have used face sizing and sizing is applied with help of “Sphere of Influence”.
- For Torsion Test, in addition to above mesh criteria, we have used face sixing for the Shoulder areas.
- And for the Neck portion, face sizing is done with help of “Sphere of Influence”.
Coordinate System:
For proper meshing, and use of “Sphere of Influence”, we have used different coordinate system as given below:
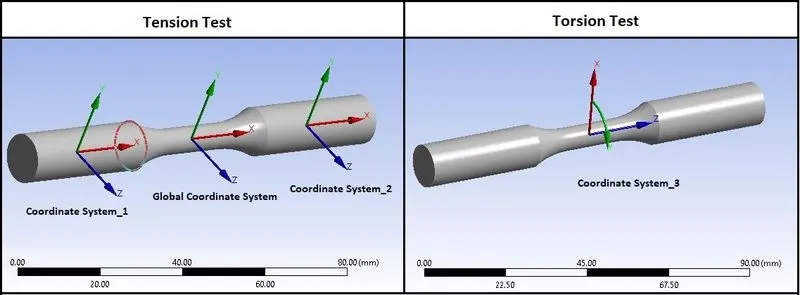
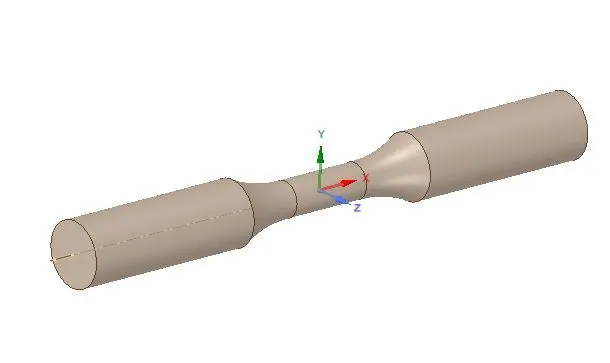
- Coordinate systems generated on the shoulder area are used for the “Sphere of Influence in face sizing of different portions in Tension and Torsion Test.
- Cylindrical coordinate system as shown in above image is used for the angular displacement in Torsion Test.
Mesh Details:
Meshing parameters for Tension as well as Torsion test are as given below:
- Patch conforming method: Tetrahedron
- Body : Specimen
- Face Sizing: 2 Grip Faces
- Type: Sphere of influence
- Sphere Centre: Coordinate system 1 & 2
- Sphere Radius: 22mm
- Element Size: 3 mm
- Face Sizing: Neck Portion
- Type: Sphere of influence
- Sphere Centre: Global Coordinate system
- Sphere Radius: 8 mm
- Element Size: 1 mm
- Face Sizing: 2 Shoulder Areas
- Element Size: 1.5 mm
- Statistics:
No.of Nodes: 4538
No.of Elements: 20791
_________________________________________________________________________________________________________
Procedure:
- Import model in Explicit Dynamics in Geometry section.
- Then go to Mechanical model section.
- Check or Rename the Part of the setup as “Specimen” as shown in above geometry image.
Boundary Conditions:
- After meshing as described above, create Boundary Conditions as given below:
Analysis Settings:
- No.of Steps: 1
- End Time: 1e-3
- Maximum Number of Cycles:1e+07
- Initial Time Step: Program Controlled
- Minimum Time Step: Program Controlled
- Maximum Time Step: Program Controlled
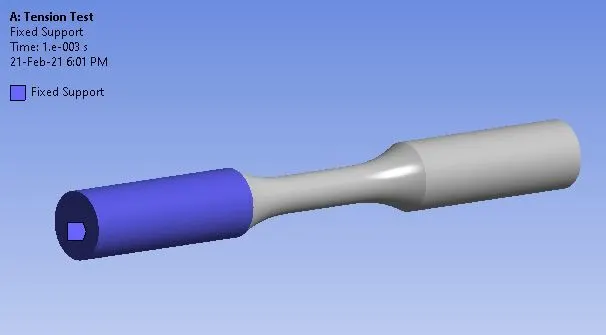
Fix Support (For Tension & Torsion Test):
- Keep one end of the specimen as a fixed to see the effect of Tension and Torsion as below:
Displacement (For Tension Test):
- Apply Displacement to one end of the specimen with Global coordinate system in order to give a uniaxial Tension as below:
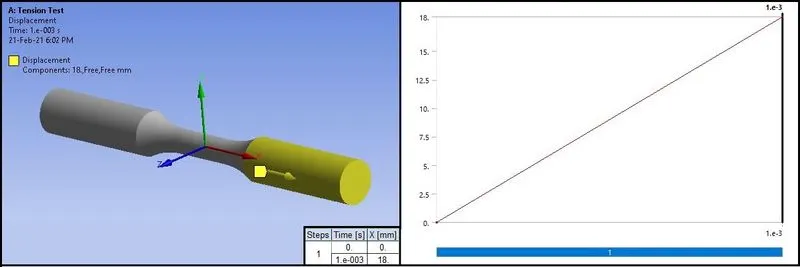
- Here the Displacement to the one end of the specimen is given up to 18 mm in Global X- Direction.
Displacement (For Torsion Test):
- Apply Displacement (Angular) to one end of the specimen in order to generate torsion with angular displacement with help of Cylindrical coordinate system (Coordinate system 3) as below:
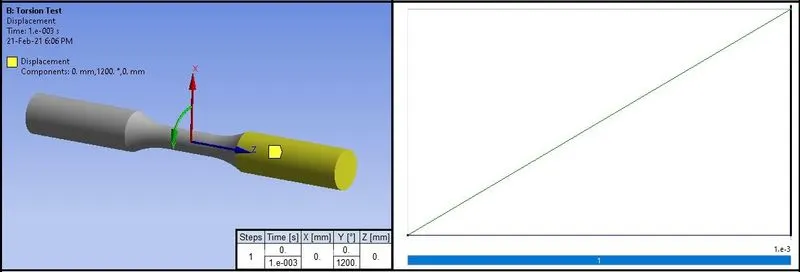
- Here the Angular Displacement to one end of the specimen is given up to 1200 degree with help of Cylindrical coordinate system (Coordinate system 3) generated at the Neck portion in local rotational Y-Direction.
- Here the displacement in X and Z direction is set to 0 in order to avoid the displacement in that direction.
Solution:
- After giving proper boundary conditions, create desired solutions for output results.
- Create Solutions for :
- Equivalent Stress
- Equivalent Elastic Strain
- Total Deformation
- User Defined Result: Temperature ( With help of Worksheet)
_________________________________________________________________________________________________________
Results:
- Now we will see all the results for Tension and Torsion Test.
Tension Test Results:
Stress Contours:
Stress Plot & Data:
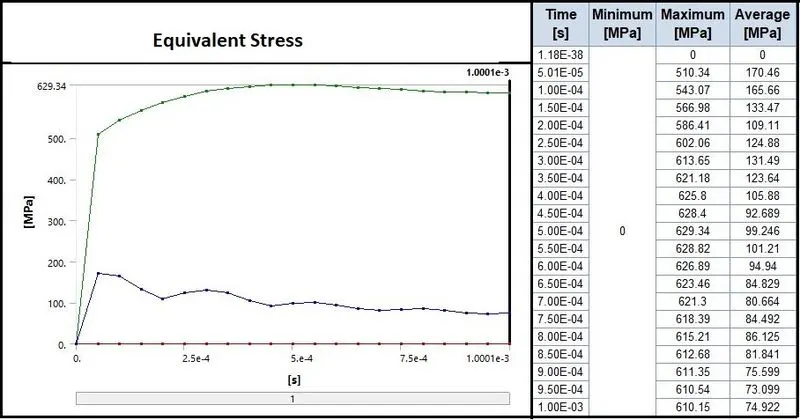
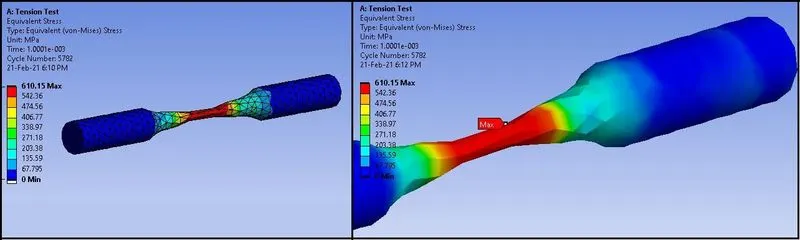
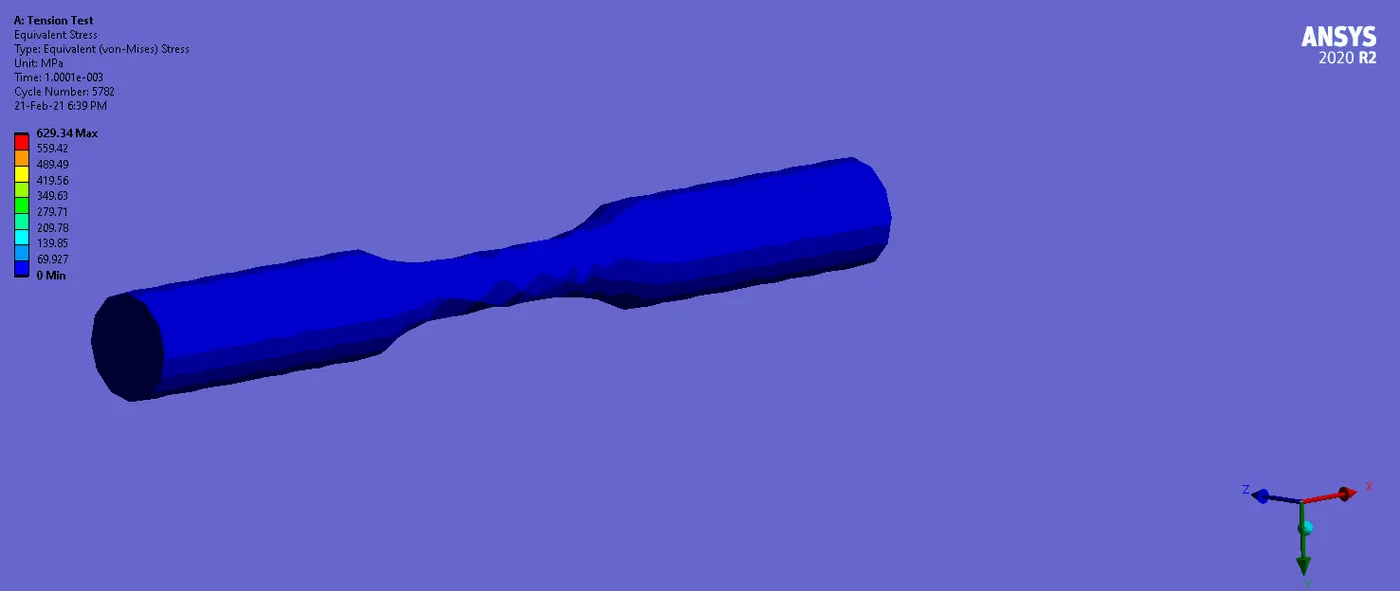
- From Contours, plots and data, we can observe that maximum stress on the specimen is 610Mpa.
- We can see that at 5e-4 s, necking happens, and then the value of stress is slightly decreasing.
- After necking, specimen will not withstand more stress, so the stress is decreasing after necking.
- We can observe stress in lateral direction, which quite low compared to axial stress.
Strain Contours:
Strain Plot & Data:
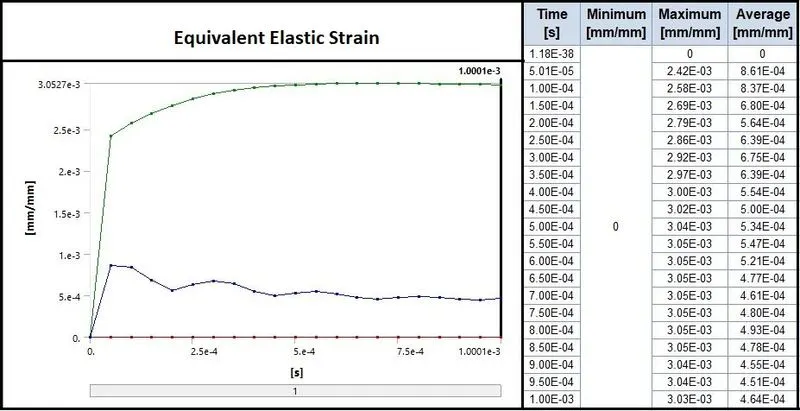
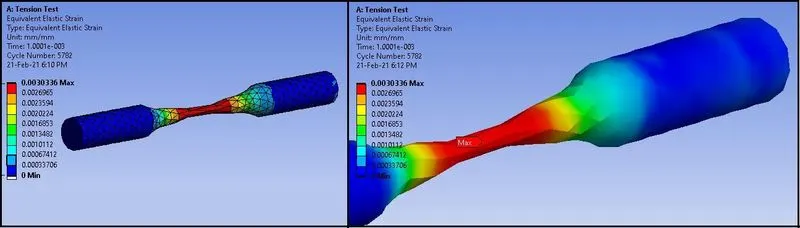
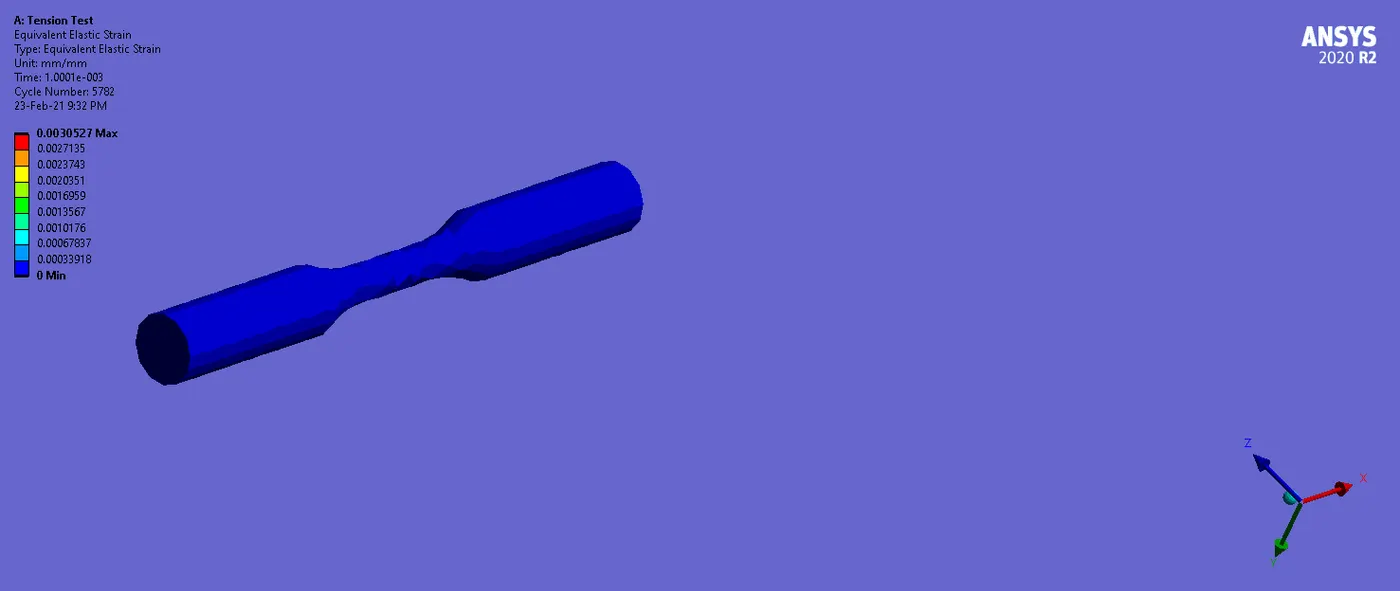
- From strain results, we can see that strain is very low compare to stress.
- At the necking point, there is only 0.3% strain.
- After necking, there is no significant change in strain, it remains nearly constant.
- Lateral strain can be observed from the graph.
Total Deformation Contours:
Total Deformation Plot & Data:
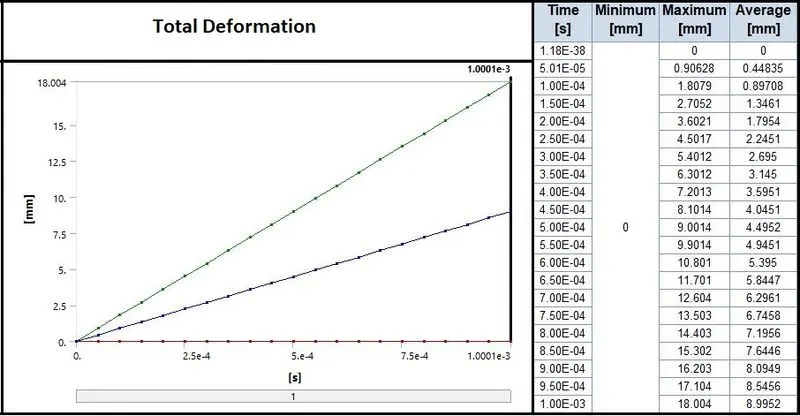
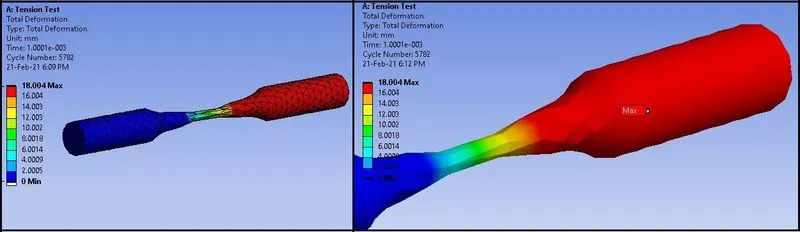
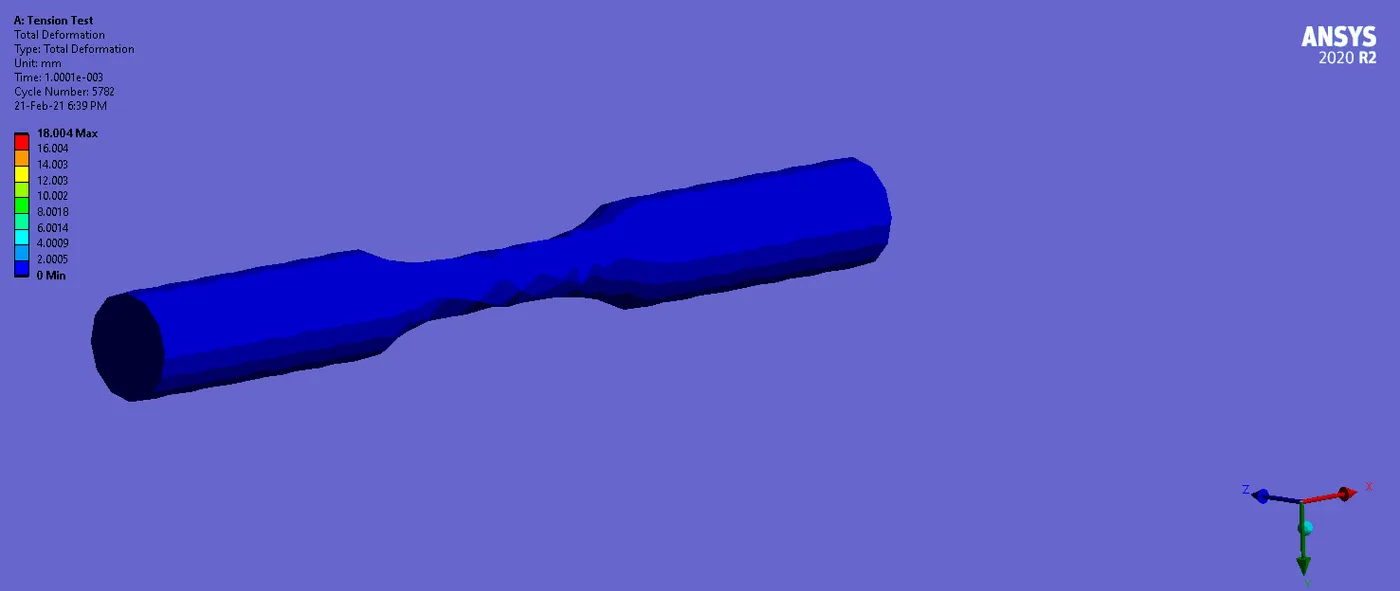
- From deformation results, we can see the maximum deformation is 18 mm.
- As we know that we have stretched the specimen only up to 18 mm, so we are getting maximum 18 mm deformation.
- Also the displacement is given in X-direction, so we are getting linear graph of deformation.
- Also we can see the deformation in Y-direction also due to lateral strain.
Temperature Contours:
Temperature Deformation Plot & Data:
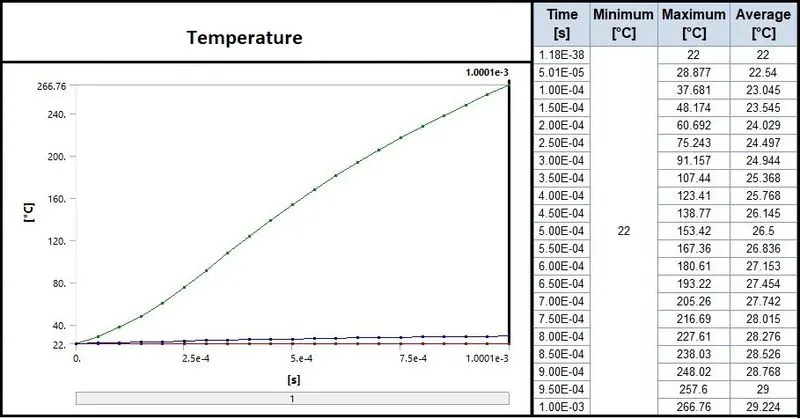
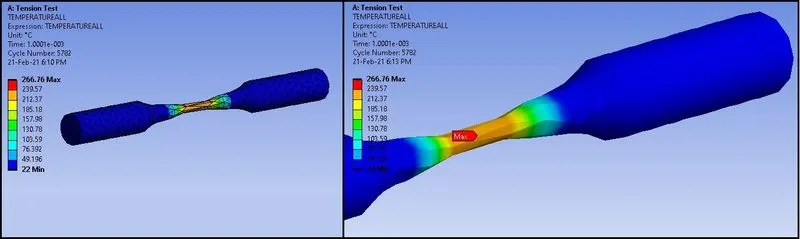
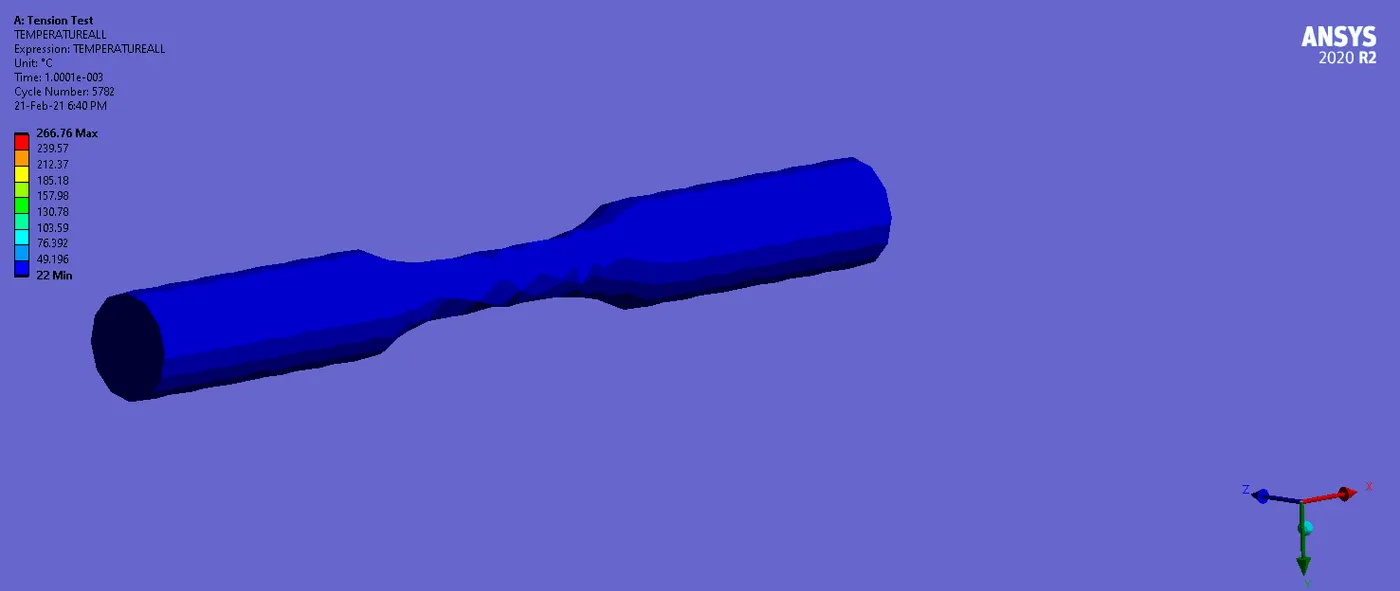
- From the temperature results, we can observe the significant change in temperature.
- As the deformation increases, stress is also increases, and there will be heat generation.
- So, with increases in stress, we can see the rise in temperature.
- Here the temperature of the specimen is rising up to very high 266.76 0 C.
Energies:
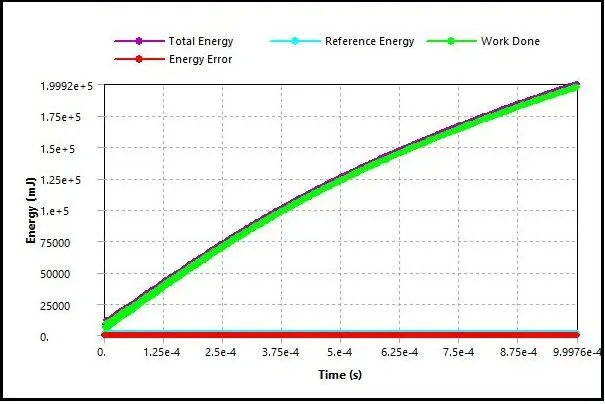
- Here we can see that Total energy is same as the Work Done.
- So we can say that the amount of work done on the specimen is transferred in to internal energy of the specimen.
- Also the energy error is about 0, so there is no energy wasted.
_ _ _ _ _ _ _ _ _ _ _ _ _ _ __ _ _ _ _ _ _ _ _ _ _ _ _ _ _ _ _ _ _ _ _ __ _ __ _ ___ _ _ _ _ _ _ _ _ _ _ _ __ _ _ _ _ _ _ _ _ _ _ _ _ _ _ _ _ _ _ _
Torsion Test Results:
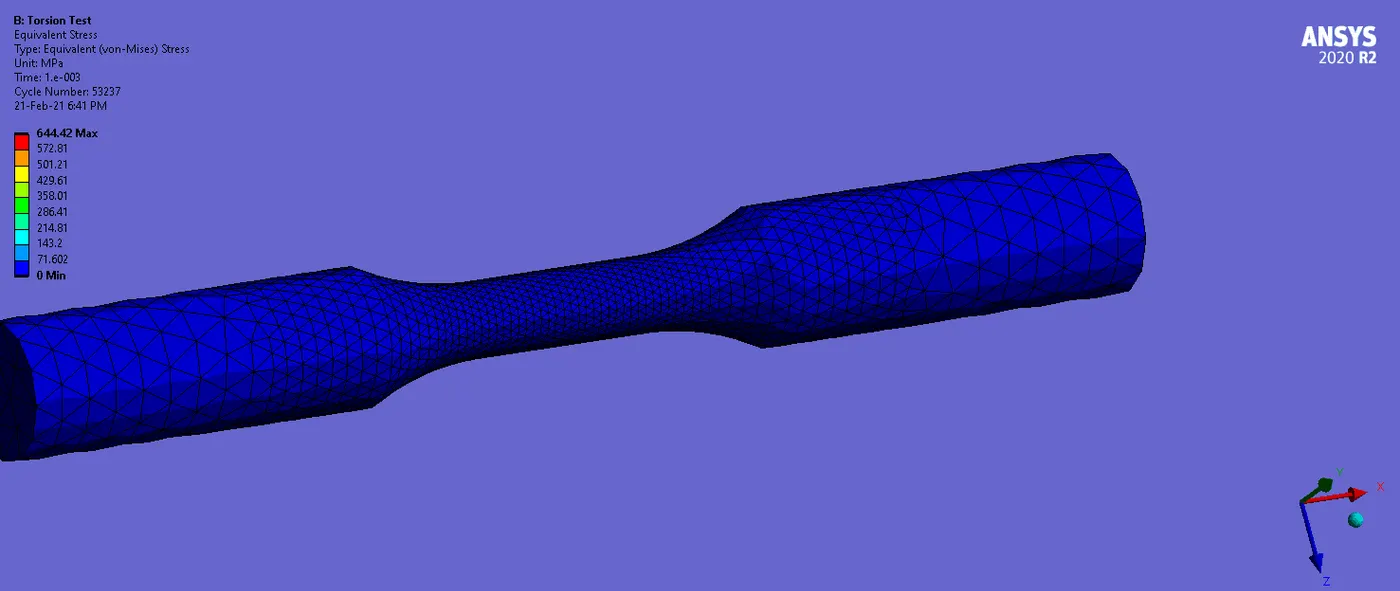
Stress Contours:
Stress Plot & Data:
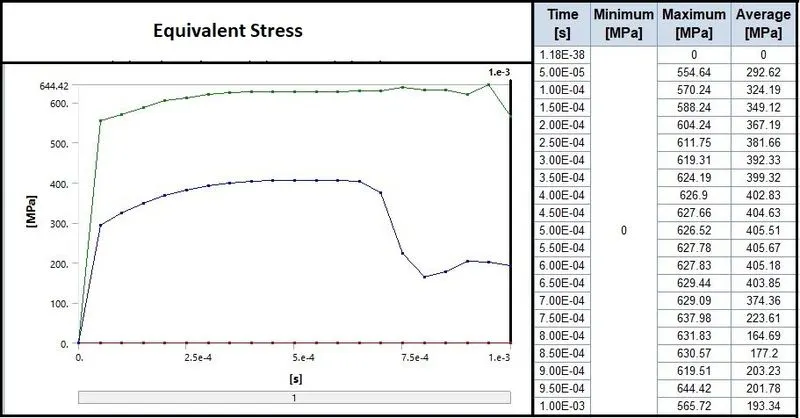
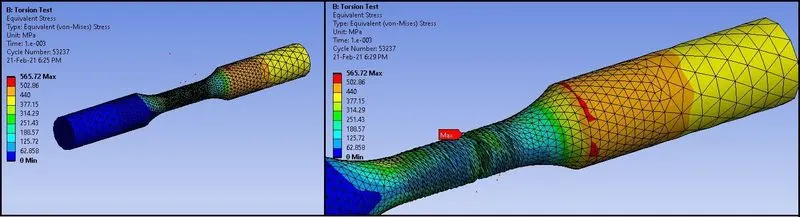
- From Contours, plots and data, we can observe that maximum stress on the specimen is 565.72Mpa.
- We can see that there is fracture near 7.5e-4 s.
- We can observe that to reach up to maximum stress, specimen is taking more time in torsion than tension.
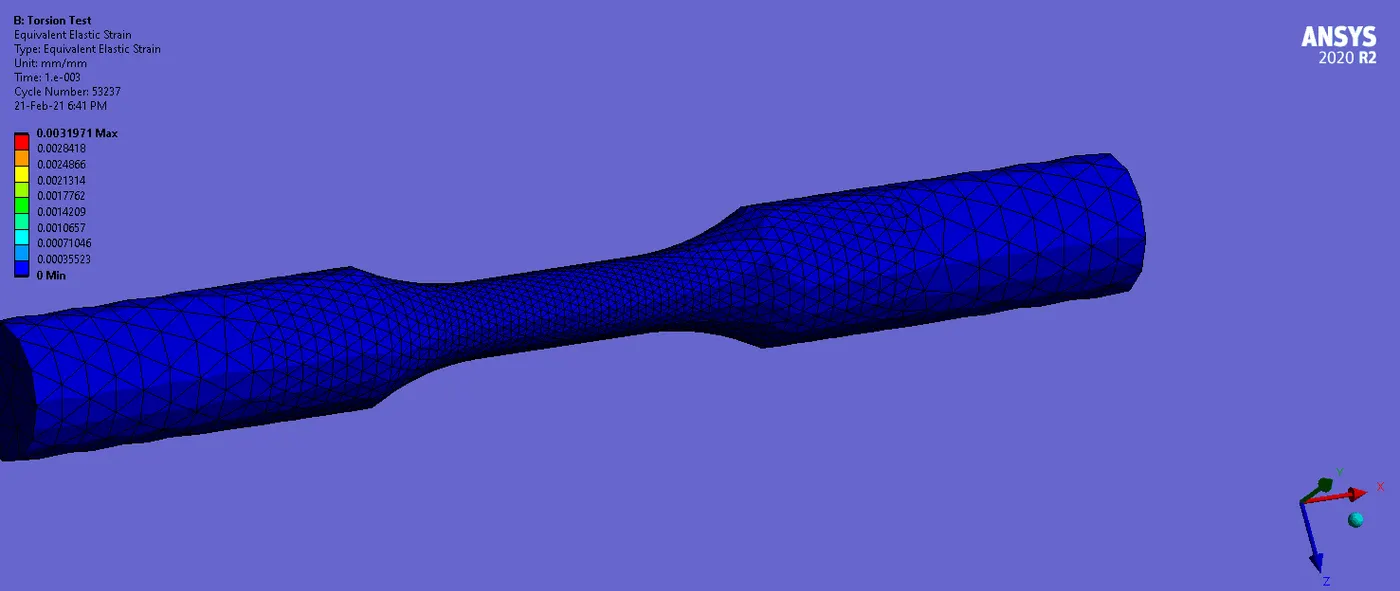
Strain Contours:
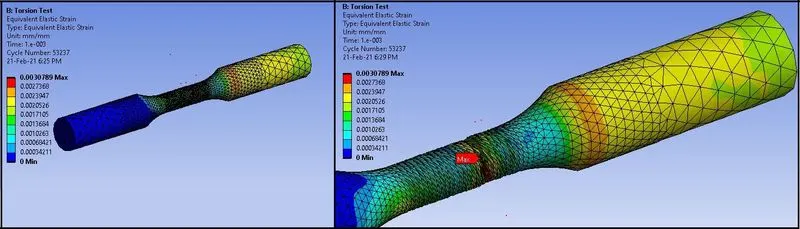
Strain Plot & Data:
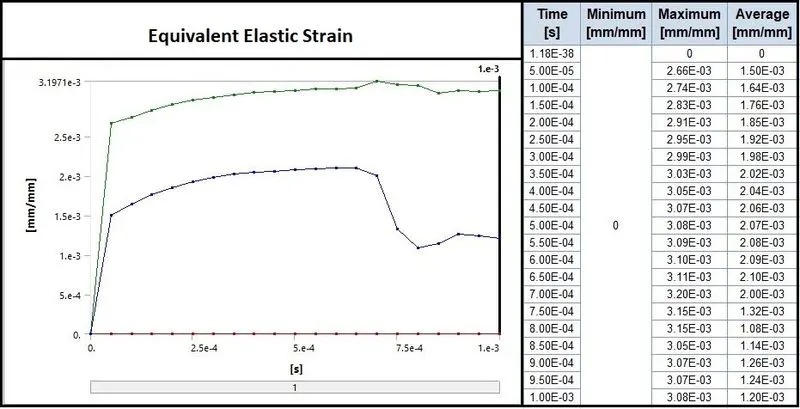
- From strain results, we can see that strain is very low compare to stress.
- At the fracture point, there is only 0.3% strain.
- After fracture, there is a little decrease in strain, and becomes nearly constant.
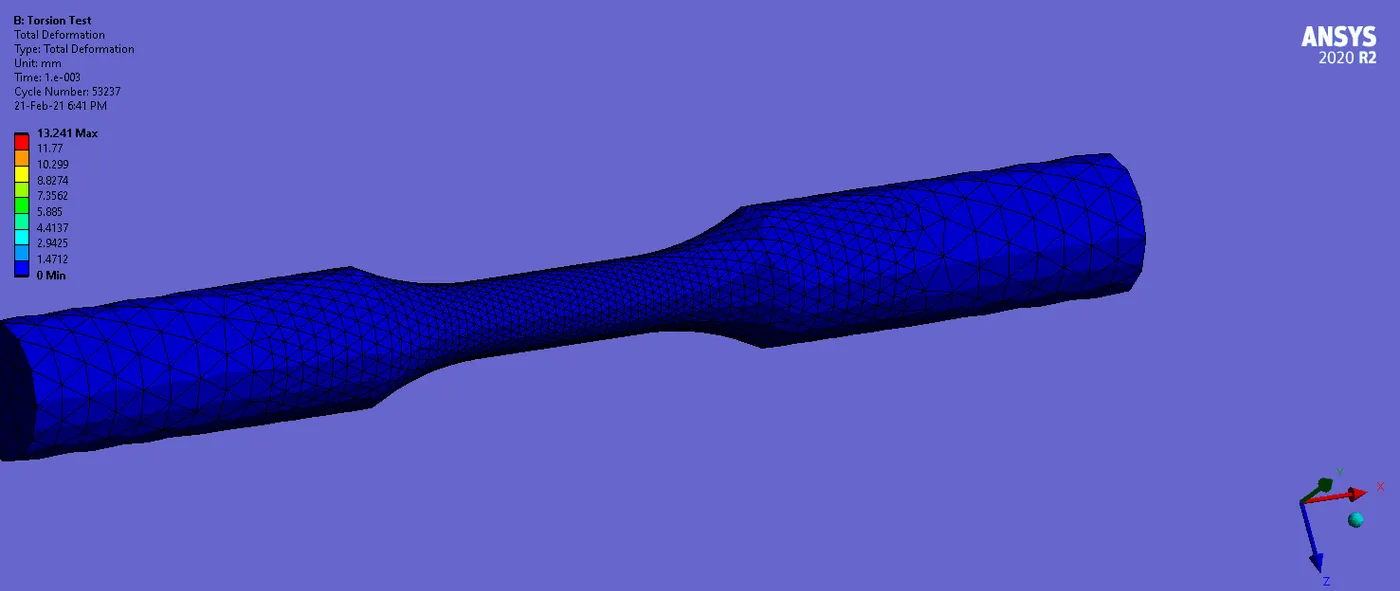
Total Deformation Contours:
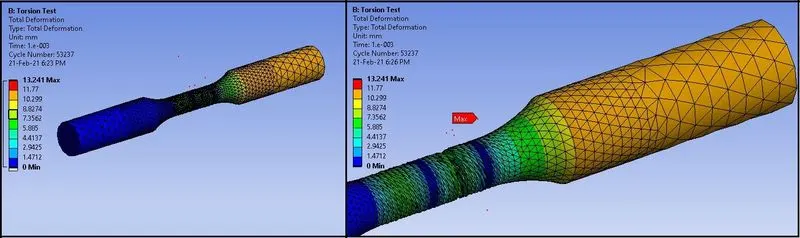
Total Deformation Plot & Data:
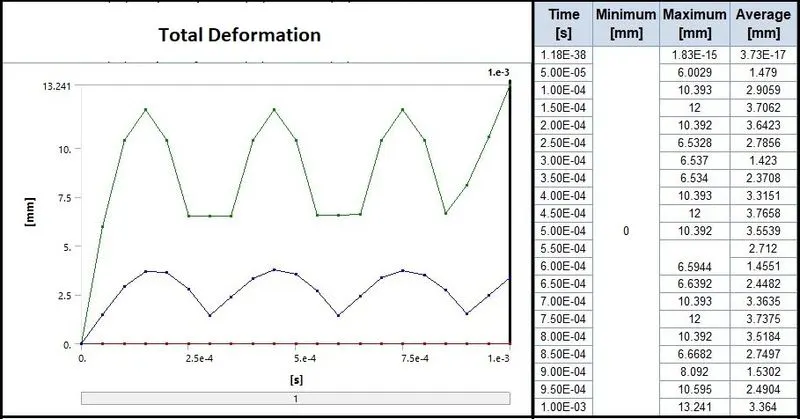
- Here we can see the maximum deformation is 13.241 mm.
- So, for the higher angle of rotation, very small deformation is happening.
- Also we can see that particles are exploding due to fracture.
- We can see the ups and downs in graph, which is due to rotation of the one end of specimen.
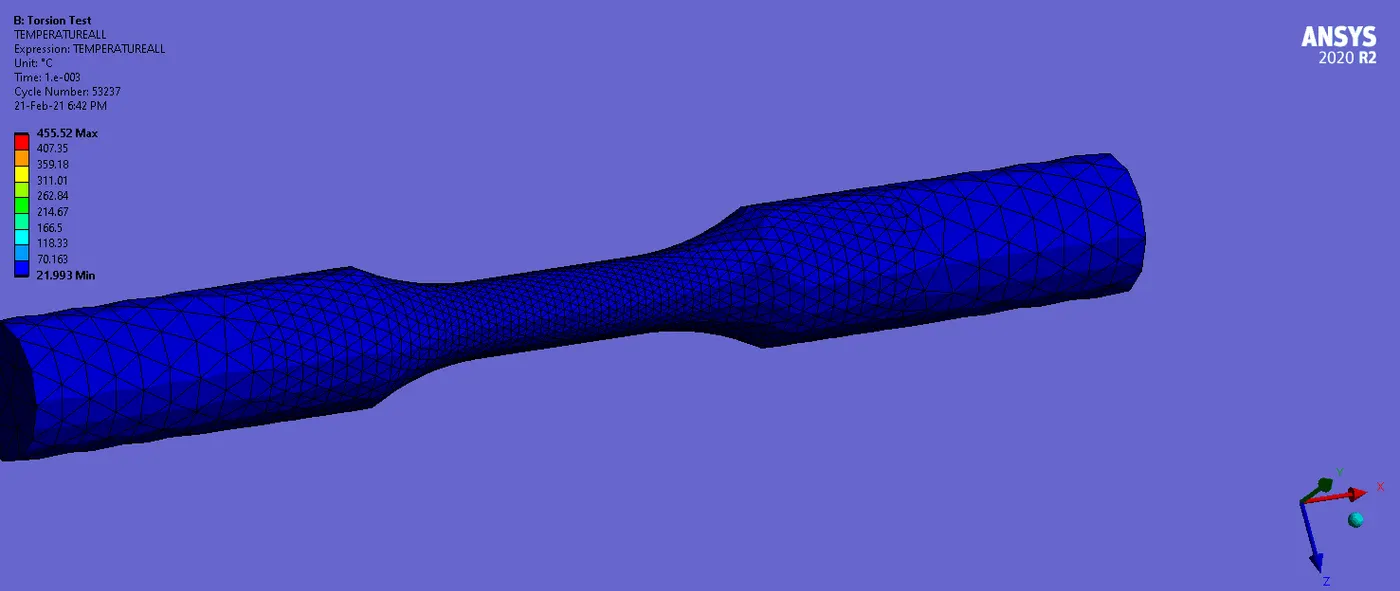
Temperature Contours:
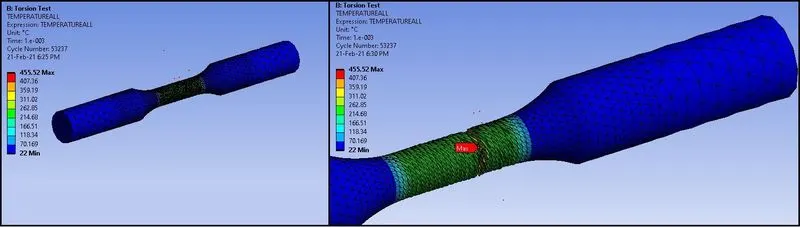
Temperature Deformation Plot & Data:
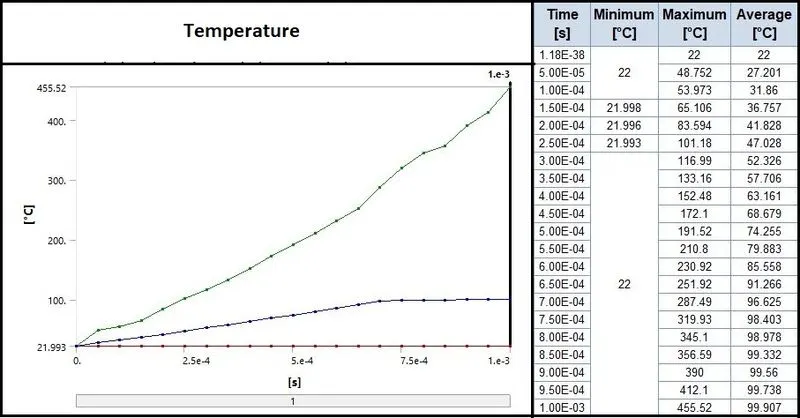
- From the temperature results, we can observe the high change in temperature.
- As the deformation increases, stress is also increases, and there will be heat generation.
- So, with increases in stress, we can see the rise in temperature.
- Here the temperature of the specimen is rising up to very high 455.52 0
- Excessive amount of heat is generating due to shearing effect at the neck area of the specimen, where twisting is happening and the particles are getting exploded due to fracture.
Energies:
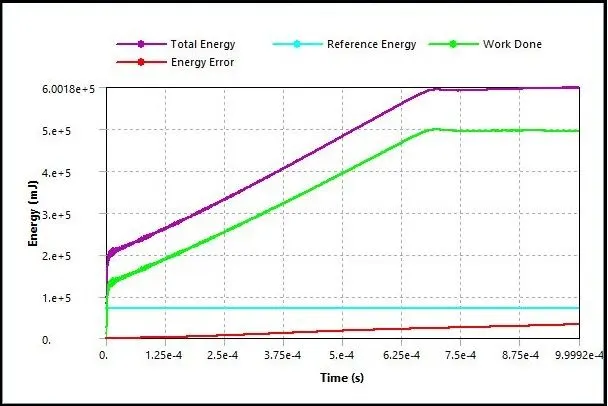
- Here from the energy plot, we can see that amount of work done is not transferred totally in to internal energy of the specimen.
- We can see there is some amount of energy error, which is due to energy dissipation during the fracture, where particles of the specimen explode.
_________________________________________________________________________________________________________
ANALYSIS OUTCOMES:
Stress-Strain Plot for Tension Test:
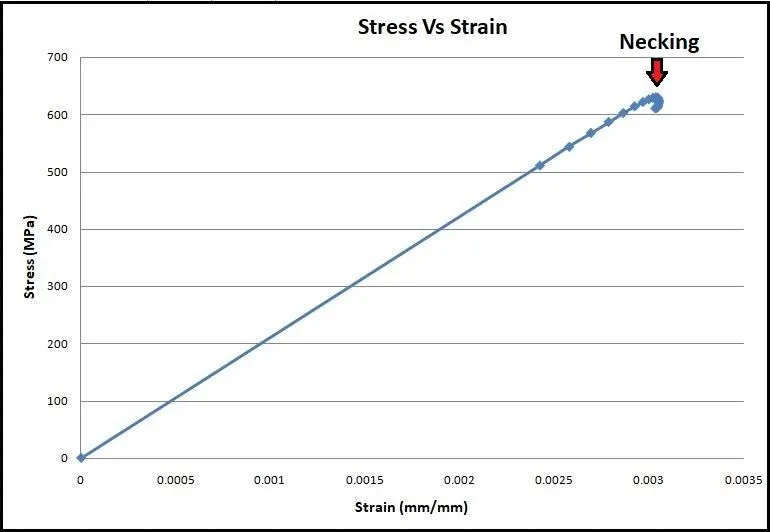
- From above Stress-Strain graph, we can observe that up to 600 Mpa stress, stress-strain graph is linear.
- When stress exceeds the 600 Mpa values, we can see that necking starts and failure occurs in the specimen.
Stress-Strain Plot for Torsion Test:
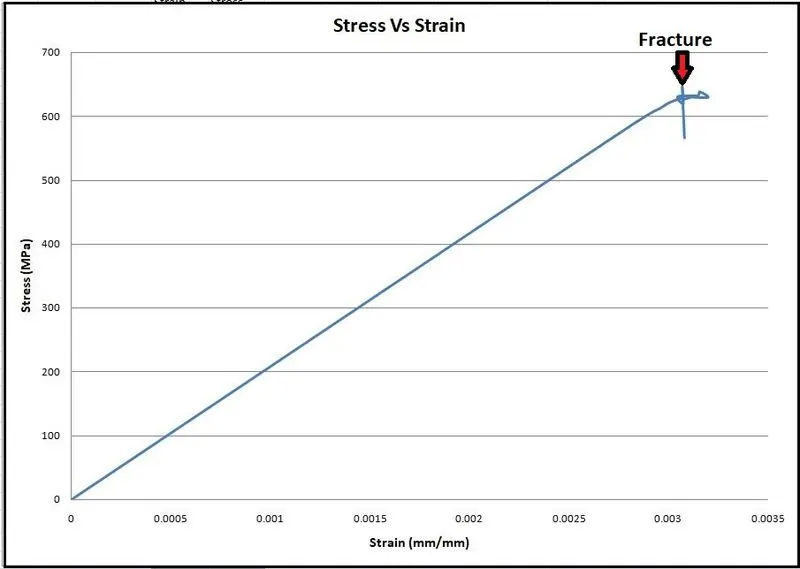
- From above Stress-Strain graph, we can observe same linear behavior of the specimen up to 600Mpa.
- After that we can see some spikes in the graph, which is due to sudden fracture.
- There is no necking in torsion. But due to excessive amount of torque and due to high stress, there is a sudden fracture occurs in the specimen.
Summary:

_________________________________________________________________________________________________________
Conclusion:
- From the above results, we can conclude that the failure of the specimen in Tension Test is due to permanent deformation due to elongation and sue to neck generation. This concludes that failure of the Specimen is due to max. Tensile Stress.
- Failure of the Specimen in the Torsion Test shows, the flat failure surface. This concludes that failure is due to Max. Shear Stress. Also it is ductile material, which indicates the failure in the Plane of maximum sheer stress perpendicular to the axis of the Specimen.
- Also we can see that Temperature in Torsion Test is very high due to high sheer stress.
- In Tension Test, Lateral Stress also occurs due to axial tension and reduction of the cross section area at neck portion.
- In Torsion Test, Shear Stress is important due to twisting of the specimen in the angular direction.
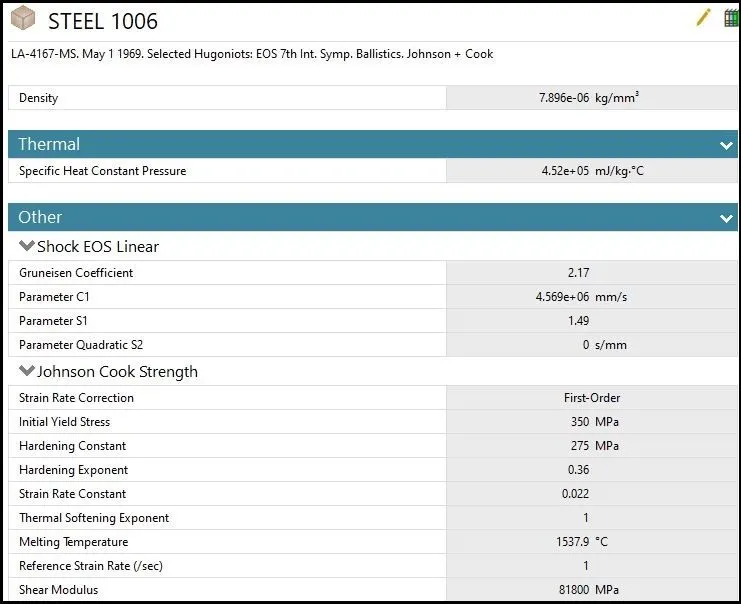
- As the material is Steel 1006, we know from the results that, the fracture in Tension Test initiates in the necked portion.
- For the Torsion Test fracture is occurring in flat surface, or in Shear plane, so steel is failing at large shear strains.
- Here the temperature is also important factor in both the Tests, as we know that at higher temperature elongation or fracture of the material can differ.
- Effectiveness and quality of materials used in manufacturing play a crucial role in bringing about marketplace success. Tensile tests help determine the effectiveness and behavior of a material when a stretching force acts on it. Tensile tests are done under optimum temperature and pressure conditions and determine the maximum strength or load that the material can withstand.
- The purpose of a torsion test is to determine sample behavior when twisted, or under tensional forces, as a result of applied moments that cause shear stress about the axis. Measurable values include: the modulus of elasticity in shear, yield shear strength, tensional fatigue life, ductility, ultimate shear strength, and modulus of rupture in shear. These values are dissimilar to those measured by an axial tensile test and are important in manufacturing as they may be used to simulate the service conditions, check the product’s quality and design, and ensure correct manufacture.
_________________________________________________________________________________________________________
References:
- Tensile testing - Wikipedia
- pdf (iaeme.com)
- Torsion Testing of Steel and Cast Iron - Odinity
- Behaviour of Iron and Steel Materials during Tensile Testing – IspatGuru
- Tension - Torsion Testing - SMART (smart-swansea.com)
- Torsion Testing - an overview | ScienceDirect Topics
- Purpose of Tensile Test (bizfluent.com)
- pdf (semanticscholar.org)
- 28-34.pdf (ijiet.com)
_________________________________________________________________________________________________________
Animations:
Here the Animations of Stress, Strain, Total Deformation and Temperature for Tension and Torsion Tests are given as below:
Tension Test:
Stress:
Strain:
Total Deformation:
Temperature:
_ _ _ _ _ _ _ _ _ _ _ _ _ _ _ _ _ _ _ _ _ _ _ _ _ _ _ _ _ _ _ _ _ _ _ _ _ _ _ _ _ _ _ ___ _ _ _ _ _ _ __ _ _ _ __ __ _ _ _ _ _ _ _ _ _ _ _
Torsion Test:
Stress:
Strain:
Total Deformation:
Temperature:
_________________________________________________________________________________________________________
Thanks & Regards,
Dharmesh Joshi