Week 9 - Senstivity Analysis Assignment
SENSITIVITY ANALYSIS
Objective: To write a code that takes all the reactions from the GRI mechanism and calculates 10 most sensitive reactions depanding on the temperature as sensitivity parameter.
Introduction: In this challenge, GRI mechanism of methane fuel is used from the cantera library to perform the sensitivity analysis w.r.t to temperature.
`CH_4+2(O_2+3.76N_2) = CO_2 + 2H_2O+7.52N_2`
The above equation gives us the final products that are obtained after a complete combustion after the reaction has reached a equilibrim state. However, For the reaction to achive the equilibrium state it will take lot of time. From the start of combustion to the equilibrium state there will be many intermediatri reactions taking place which results in the ignition delay of the fuel. By determining which reactions are effecting the ignition delay we can make changes to the fuel composition for desired output or can estimate the emissions effectively.
Sensitivity analysis: It is a technique used to determine how particular reactions will impact overall outcome under a given set of assumptions is defined as sensitive analysis. It’s usage will depend on one or more input variables within the specific conditions. Sensitivity analysis can be used for any activity or system.
"""
Python program to identify top 10 temperature sensitive reactions for the GRI 3.0 mechanism which uses methane as fuel.
"""

#Importing the modules to run mathematical and logical operations.
import numpy as np
import matplotlib.pyplot as plt
import cantera as ct
import sys

#Initial conditions
gas = ct.Solution('gri30.xml') # gas object is created from the solution class of cantera
T0 = 1500	#Temperature
P0 = ct.one_atm #Pressure
gas.TPX = T0, P0, {'CH4':1, 'O2':2, 'N2':7.52} #gas.TPX  represents initial values and species that are to be involved in the reaction mechanism.

r = ct.IdealGasConstPressureReactor(gas) #selection of the reactor which defines the govering equations that are to be solved.
sim = ct.ReactorNet([r]) # Connecting Reactor type to reactornet. In ReactorNet time integration is performed
reactions = gas.reaction_equations() #reaction equations are stored

# Adding reactions to sensitivity analysis
n = gas.n_reactions #no of reaction available = 325
r_id = np.linspace(1,n,n)# numbering each reaction
N = 10  # Number of sensitive reactions we want to see.

for i in range(n):
	r.add_sensitivity_reaction(i)# adding reaction to the reactor that are to be performed.
# relative and absolute tolerances for the solution
sim.rtol = 1e-06
sim.atol = 1e-15

# relative and absolute tolerances for the Sensitivities
sim.rtol_sensitivity = 1e-06
sim.atol_sensitivity = 1e-06

# Maximum temperature sensitivities of each reaction
Tmax = [0]*n
states = ct.SolutionArray(gas, extra=['t_in_ms'])#contains all values of each parameter for everytime step.

# Creating the time domain for the reactor network
t = np.linspace(0,2e-3,401)

# Outer time loop
for i in t:
	sim.advance(i)# calculating the parameters for every timestep of 't'. 'advance' method is used to integrate Reactor network.
	states.append(r.thermo.state, t_in_ms=i*1e3)# appending the state of the reactor at each timestep. state involves temperature, pressure etc..

	# Storing the highest temperature sensitivity object for each time step.
	for j in range(n):
		T = sim.sensitivity('temperature',j)
		if abs(T) >= abs(Tmax[j]):
			Tmax[j] = T

# sorting the most sensitive reaction equations based on temperature.
reactions = [r for s,r in sorted(zip(np.abs(Tmax),reactions), reverse=True)]
rid = [r for s,r in sorted(zip(np.abs(Tmax),r_id), reverse=True)]
Tmax = [T for abs_T, T in sorted(zip(np.abs(Tmax),Tmax), reverse=True)]


# Extracting the top 10 sensitive reactions for plotting.
r_id_plt = r_id[0:N]
rplt = reactions[0:N]
splt = Tmax[0:N]

# Printing the results
print("The top %d most temperature sensitive reactions:" % (N))
print("--------------------------------------------------------------------")
print("%1s %8s %4s %18s %12s %12s %4s" % ('|','Reaction ID','|','Reaction','|','Sensitivity','|'))
print("--------------------------------------------------------------------")
for i in range(N):
	print("%7d %10s %26s %4s %10.4f" % (r_id_plt[i],'|',rplt[i],'|',splt[i]))
print("--------------------------------------------------------------------")

# Extracting mole fractions of OH, H and CH4
OH = states.X[:, states.species_index('OH')]
H = states.X[:, states.species_index('H')]
CH4 = states.X[:, states.species_index('CH4')]

# Plotting the results
plt.figure(1)
plt.grid('ON')
plt.barh(rplt,splt,color=['red','black'],height=0.4)
plt.gca().invert_yaxis()
plt.xlabel("Temperature sensitivity")
plt.title("Most Temperature Sensitive Reactions of Gri 3.0")
plt.tight_layout()
plt.show()

plt.figure(2)
plt.subplot(2,2,1)
plt.plot(states.t_in_ms,states.T)
plt.grid('ON')
plt.xlabel('Time [ms]')
plt.ylabel('Temperature [K]')

plt.subplot(2,2,2)
plt.plot(states.t_in_ms,OH)
plt.grid('ON')
plt.xlabel('Time [ms]')
plt.ylabel('OH Mole Fraction')

plt.subplot(2,2,3)
plt.plot(states.t_in_ms,H)
plt.grid('ON')
plt.xlabel('Time [ms]')
plt.ylabel('H Mole Fraction')

plt.subplot(2,2,4)
plt.plot(states.t_in_ms,CH4)
plt.grid('ON')
plt.xlabel('Time [ms]')
plt.ylabel('CH4 Mole Fraction')
plt.tight_layout()
plt.show()Results:
Reactions represented in the tabular for that are most temperature sensitive reactions.
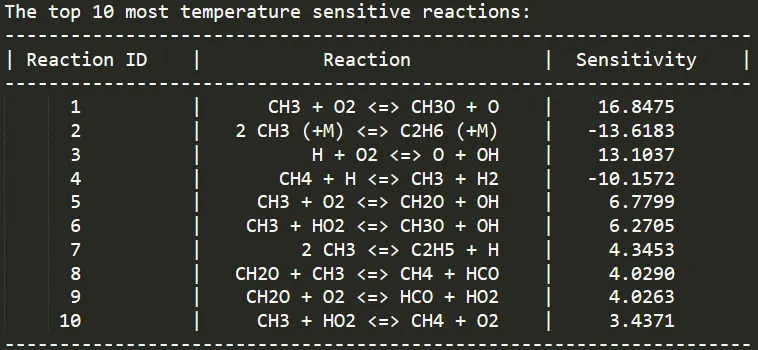
- For N=10, These the 10 most sensitive reactions.
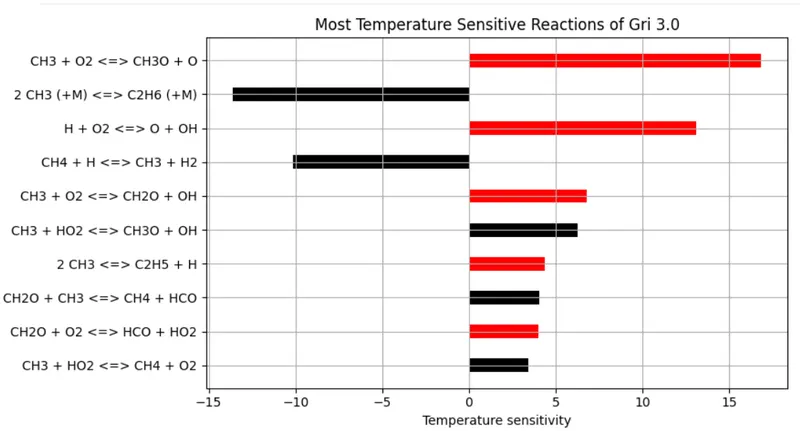
- Above graph, gives us the data about the temperature sensitive reactions. Effect of the reaction depends on the molar fractions of the species involved in the reaction.
- We can have more number of reactions in the graph by changing the value of 'N' in the above program.
- There are about 325 reactions involved in this mechanism.
- Most of the reactions are so small that we can ignore them. There effect on the ignition delay and reaction rate will be very minimal.
Conclusions:
- Sensitivity analysis is very important for the combustion to determine the reaction rates, emissions and ignition delays.
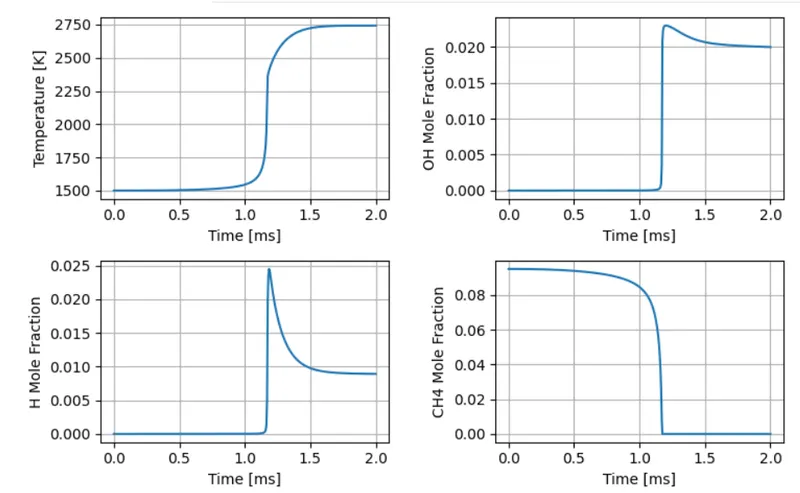
- From the above graphs of temperature, OH, H, CH4 variations started appearing after the combustion had taken place after 1ms.
- Temperature has reached the maximum flame temperature of 2750k.
- H and OH concentration has spiked up rapidly due the combustion. OH concentration ramained constant after the combustion however there is a drop in the H concentration due to the reaction with the Oxygen moleculesto form H2O.
- CH4 is the fuel reacted with oxygen and nitrogen for the combuction to take place which resulted in the drop of the concentration of it to zero. which tells that the fuel is completely utilized.