Senstivity Analysis of Methane Air Combustion in Cantera using Python
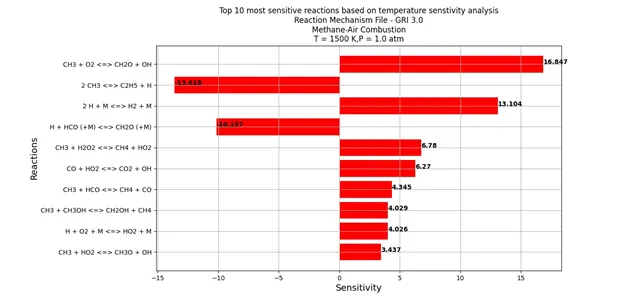
AIM – Determine the 10 most sensitive reactions with respect to temperature in stoichiometric methane air combustion using Cantera
THEORY -
Sensitivity analysis investigates the effect of parameter change on the solution of mathematical models. In chemical kinetics, models are usually based on differential equations and the results are concentration-time curves, reaction rates, and various kinetic features of the reaction.
What is the nature of the connections between solution and parameters and would it not be possible to describe the phenomena by fewer parameters? These are the topics of sensitivity analysis.
A sensitivity analysis has been performed in the present study based on temperature i.e. the top 10 reactions contributing to temperature change in the combustion process have been determined. This helps us to target the top reactions whose kinetic parameters can be tuned so that the simulation and experimental results match more closely.
Combustion process in a constant pressure reactor has been considered. The initial temperature and pressure are 1500 K and 1 atm respectively. The simulation has been run for 2 ms.
Solution Algorithm –
- Initialize a gas object from the Solution class. GRI30.xml can be used as the reaction mechanism file for input. Also initialize the total time of simulation.
- Set the initial temperature, pressure and species mole fraction of the gas object.
- Create a new object, say r, from the IdealGasConstPressureReactor class of Cantera.
- Use r as an input to the ReactorNet class and create a reactor network, say sim.
- Add the reactions whose sensitivity analysis has to be performed. In this case all the reactions in the GRI Mech 3.0 file have been considered.
- Define the relative absolute tolerances for both the sensitive analysis and the governing equations.
- Advance the sim object by 5e-6 seconds (s) for the total simulation time (2 ms).
- Append the thermal properties after each millisecond. For this, use the SolutionArray class for proper formatting of data.
- Extract the top 10 most sensitive reactions based on temperature and plot the sensitivities.
A parametric code has been written in Python so that the parameter and the number of top most sensitive reactions can easily be changed.
Results and Discussions –
The plot below shows the top 10 most sensitive reactions. A positive sensitivity coefficient indicates that increase in the temperature would increase the rate of that reaction while a negative coefficient indicates that an increase in temperature would decrease the rate coefficient of that reaction.
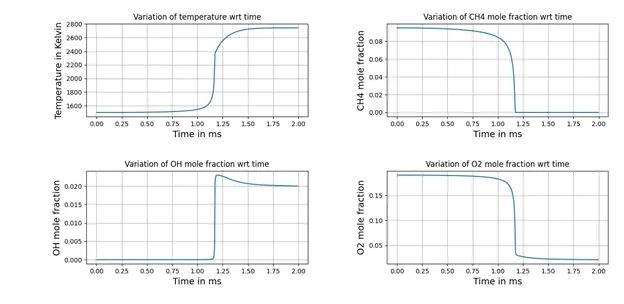
From the concentration and temperature plots shown below it can be observed that there is a spike in the values 1 ms. This is because of the ignition delay and auto ignition phenomenon at the given temperature and pressure. The concentration of CH4 and O2 decreases to 0 indication complete consumption of the fuel and the concentration of OH increases indicating the formation of OH radicals during the combustion process.
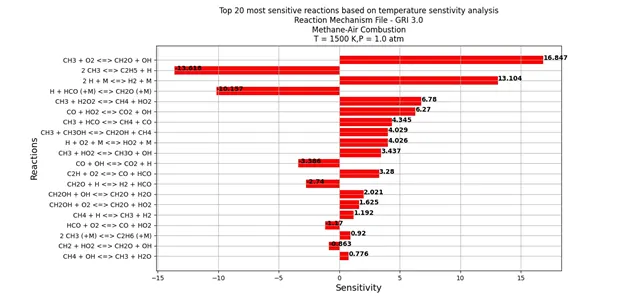
To highlight the parametric nature of the code, the top 20 most sensitive reactions have also been extracted and their sensitivities are shown below.
PYTHON CODE -
"""
Program to perform sensitivity analysis on methane air combustion wrt temperature in an Ideal gas
constant pressure reactor

Author - Sharique Iqbal
Date - 4 Nov 2020
"""

import math
import numpy as np
import matplotlib.pyplot as plt
import cantera as ct

gas = ct.Solution('gri30.xml')
T = 1500	#Initial temperature in Kelvin
P_atm = 101325 	#AtmosphericPressure in Pascal
P = P_atm	#InitialConditions for the reaction
phi = 1
species_dict = {'CH4':1,'O2':2/phi,'N2':3.76*2/phi}	#Species moles in the reactor. Moles of each species on
#reactant side written in terms of phi. Can also be written as mole fractiom
gas.TPX = T,P,species_dict
t_start = 0
t_end = 2e-3	#in seconds. End time of analysis
t_step = 5e-6	#in seconds. Values are calculated at each t_step. This is not the time step size of the ODE
r = ct.IdealGasConstPressureReactor(gas) #Object created from the ideal gas constant pressure reactor class of cantera
sim = ct.ReactorNet([r])	#Object created from the reactor newtork class of cantera. Helps in advancing the states at each time step
tot_reactions = gas.n_reactions	#Gives total number of reactions in the mechanism file
reac = gas.reaction_equations()	#Gives all the reaction equations
sensitivity = [0]*tot_reactions
n = 20	#Number of most sensitive reactions
parameter = 'temperature'	#Parameter against which the sensitivity analysis has to be performed

for i in range(0,tot_reactions):	#0 to 324, thus includes all 325 reactions. Number of reactions from GRI Mech file
	r.add_sensitivity_reaction(i)

#Tolerances for ODEs solving for conservation equations
sim.rtol = 1e-6	#Relative tolerance
sim.atol = 1e-15	#absolute tolerance

#Tolerances for ODE solving for the sensitivity
sim.rtol_sensitivity = 1e-6	#Relative tolerance
sim.atol_sensitivity = 1e-6	#Absolute tolerance

states = ct.SolutionArray(gas,extra = ['time_in_ms'])	#Data structure to store the results

for t in np.arange(t_start,t_end,t_step):
	sim.advance(t)	#Advance method in the reactorNet class advances the states at each time
	states.append(r.thermo.state,time_in_ms = t*1e3)
	for i in range(tot_reactions):
		s=sim.sensitivity(parameter,i)
		#Since we don't need temporal variation of sensitivity of each reaction with temp, just the maximumum values.
		if (np.abs(s)>np.abs(sensitivity[i])):
			sensitivity[i] = s
#Sorting the sensitivity list in descending order using absolute value sto retain the negative values also
sens_sort = sorted(sensitivity,key = abs, reverse = True)

#Storing the values of reaction number, reaction and sensitivity for top n sensitivity values
idx = [0]*n
reac_plot = [0]*n
s_plot = [0]*n
print('The top {} most sensitive reactions based on {} sensitivity analysis are : '.format(n,parameter))
for i in range(n):
	idx[i] = sensitivity.index(sens_sort[i])
	rn = idx[i]+1
	reac_plot[i] = reac[rn]
	s_plot[i] = sens_sort[i]
	msg = 'Reaction # {:4}  {:30} Sensitivity = {:4.4f}'.format(rn,reac_plot[i],s_plot[i])
	print(msg)

#Plotting the results
plt.figure(1)
plt.subplot(221)
plt.plot(states.time_in_ms,states.T)
plt.xlabel('Time in ms',fontsize = 14)
plt.ylabel('Temperature in Kelvin',fontsize = 14)
plt.title('Variation of temperature wrt time')
plt.grid('on')

plt.subplot(222)
plt.plot(states.time_in_ms,states.X[:,gas.species_index('CH4')])
plt.xlabel('Time in ms',fontsize = 14)
plt.ylabel('CH4 mole fraction',fontsize = 14)
plt.title('Variation of CH4 mole fraction wrt time')
plt.grid('on')

plt.subplot(223)
plt.plot(states.time_in_ms,states.X[:,gas.species_index('OH')])
plt.xlabel('Time in ms',fontsize = 14)
plt.ylabel('OH mole fraction',fontsize = 14)
plt.title('Variation of OH mole fraction wrt time')
plt.grid('on')

plt.subplot(224)
plt.plot(states.time_in_ms,states.X[:,gas.species_index('O2')])
plt.xlabel('Time in ms',fontsize = 14)
plt.ylabel('O2 mole fraction',fontsize = 14)
plt.title('Variation of O2 mole fraction wrt time')
plt.grid('on')
plt.tight_layout()

plt.figure(2)
reac_plot.reverse()	#Reversing to plot
s_plot.reverse()	#Reversing to plot
plt.barh(reac_plot,s_plot,color = 'red')
plt.grid('on')
plt.xlabel('Sensitivity',fontsize=14)
plt.ylabel('Reactions',fontsize=14)
plt.title('Top {} most sensitive reactions based on {} senstivity analysisnReaction Mechanism File - GRI 3.0nMethane-Air CombustionnT = {} K,P = {} atm'.format(n,parameter,T,P/P_atm))
for i, v in enumerate(s_plot):	#For values in front of bar chart
    plt.text(v, i, str(round(v,3)), color='black', fontweight='bold')
plt.gcf().subplots_adjust(left = 0.25,top = 0.85)	#To extend the left margin
plt.show()- Mahdi HabibiHello. I am looking for MATHLAB code to burn(combustion) methane in a constant volume. Please help me or send me the related link. Thanks