Week 9 - Senstivity Analysis Assignment
import sys
import numpy as np
import cantera as ct
import matplotlib.pyplot as plt
gas = ct.Solution('gri30.xml')
T = 1500
P = ct.one_atm
gas.TPX = T,P,{'CH4':1,'O2':2,'N2':7.52}
r = ct.IdealGasConstPressureReactor(gas,name = 'R1')
sim = ct.ReactorNet([r])
no_rxn = gas.n_reactions
for i in range(no_rxn):
r.add_sensitivity_reaction(i)
sim.rtol = 1e-6
sim.atol = 1e-15
sense=final=[]
rxn = []
maxi = [0]*no_rxn
maxi_1 = []
sim.rtol_sensitivity = 1e-6
sim.atol_sensitivity = 1e-6
states = ct.SolutionArray(gas,extra=['t','s2'])
for t in np.arange(0, 2e-3, 5e-6):
sim.advance(t)
for j in range(no_rxn):
s = sim.sensitivity(1,j)
states.append(r.thermo.state, t = 1000*t,s2=s)
if (np.abs(s) > np.abs(maxi[j])):
maxi[j] = s
maxi_1 = np.copy(maxi)
maxi_1.sort()
left_ptr = 0
right_ptr = len(maxi_1)-1
ctr = 0
while (ctr<10):
if np.abs(maxi_1[left_ptr])>np.abs(maxi_1[left_ptr]):
final.append(maxi_1[left_ptr])
left_ptr += 1
ctr = ctr+1
else:
final.append(maxi_1[right_ptr])
right_ptr = right_ptr - 1
ctr = ctr + 1
ctr = 0
final.reverse()
rxn.reverse()
while(ctr<10):
index = maxi.index(final[ctr])
rxn.append(sim.sensitivity_parameter_name(index))
ctr += 1
print(final)
plt.figure(1)
plt.barh(rxn,final)
plt.xlabel('Temp sensitivity')
plt.ylabel('reactions')
plt.show()
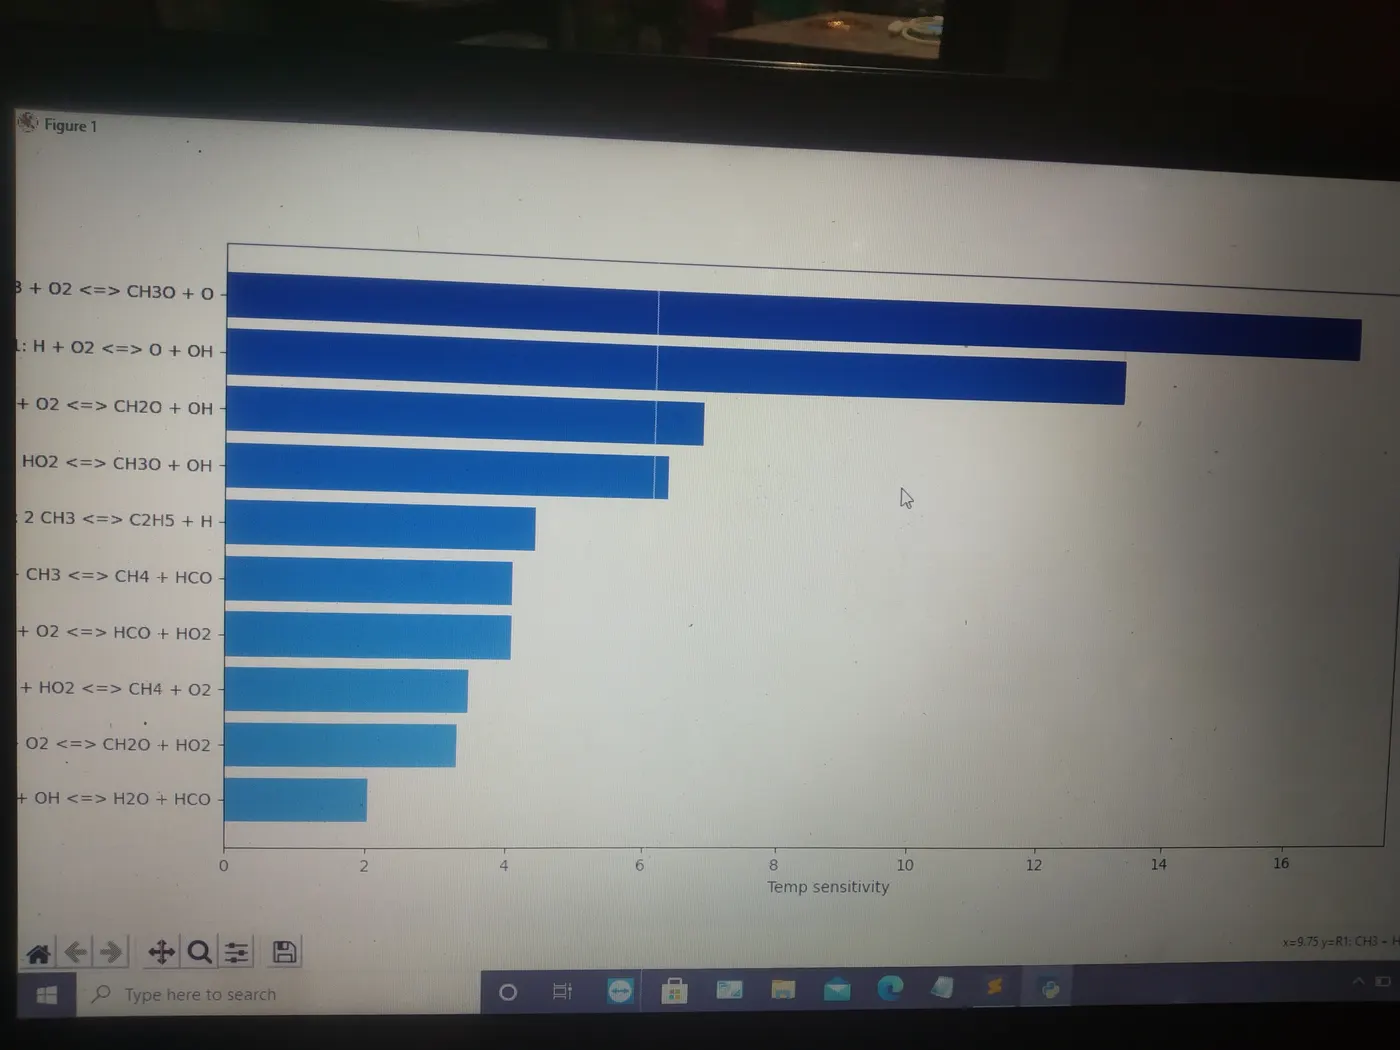
result:
from the sensitivity plot it can be clearly seen that reaction with highest positive and negative sensitivity
ths means if the rate of reaction increased ,the state temparature increases and we can obtain lesser ignition delay
also if we increase the rate of second reaction state temparature decreases and ignition delay increases