Week - 9 Material Modeling from Raw Data
AIM : Material modeling of MAT- 024 (PIECEWISE_LINEAR_PLASTICITY) card from raw data using data digitizer and ls-dyna.
OBJECTIVE :
- Extract the data from the given graph image by using data digitizer.
- cleaning the data and plot the graph to check the data is matching with original data.
- Convert the data into required SI unit by calculation.here the unit system taken is kg-mm-ms, GPa.
- Plot the data as a curve to define in the material card.
- Setup the simulation for tensile test on dogbone specimen to get the results.
- validate the output data by checking it that it matches with the original data.
PROCEDURE :
- First we have to install the data digitizer application in our system to extract data from the raw data graph image provided.
- After installing the application, load the given graph image and extract the points out from it.
- save the data points and load it in the excel sheet.
Note : there are two curve data gievn in the image, here we are extracting the value of the curve 1.
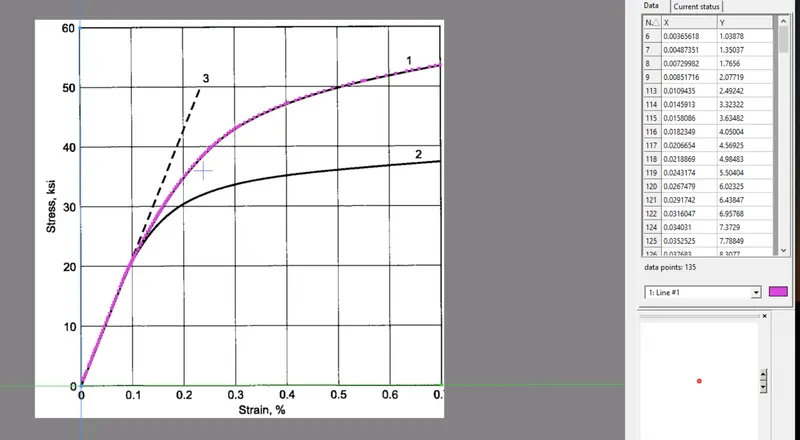
- Here the extracted data is exported in to excel sheet, where the data has to need cleanup so that it works perfectly in the LS-DYNA.
- Now, as per the given option between MAT_18 and MAT_24, we are taking MAT_024 card for the following procedure.
- MAT_024 (PIECEWISE_LINEAR_PLASTICITY) :
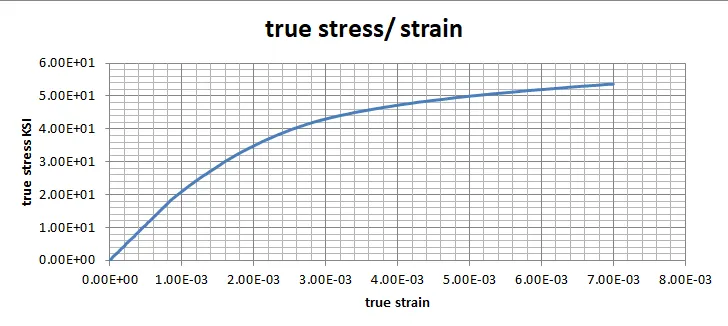
The card is used to define elasto plastic material model.In this card we have to provide curve data of effective stress / effective plastic strain. - the data we extracted from the graph is true stress in KSI unit and true strain in %, so we need to convert the values in the SI unit we are following and then convert into effective stress and effective plastic strain.
- In the below graph you can see the plot data of true stress in ksi and ture strain data.
FORMULA'S :
True stress = engg stress x exp ( true strain)
true strain = ln(1 + engg strain)
Effective plastic strain = true strain - ( true stress / E)
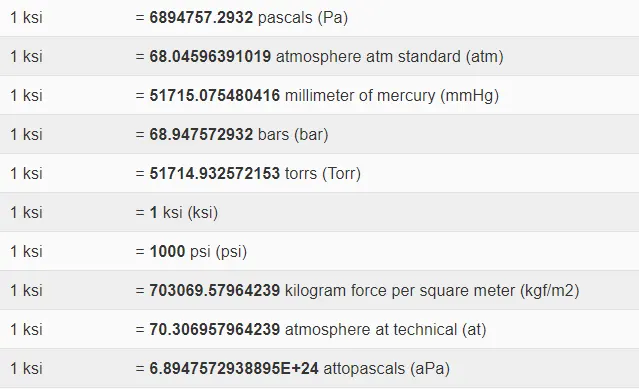
- from the above data we know that we have to change the unit from KSI to kg-mm-ms. for easy step we convert the data from KSI to pascal and then pascal to kg-mm-ms.
- In the below images you can see some conversion data in excel and curve plotted of the data true stress in GPA and true strain.
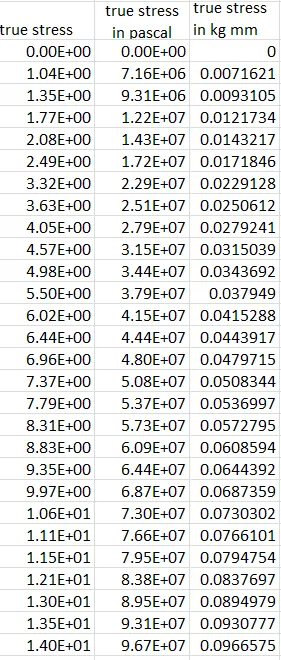
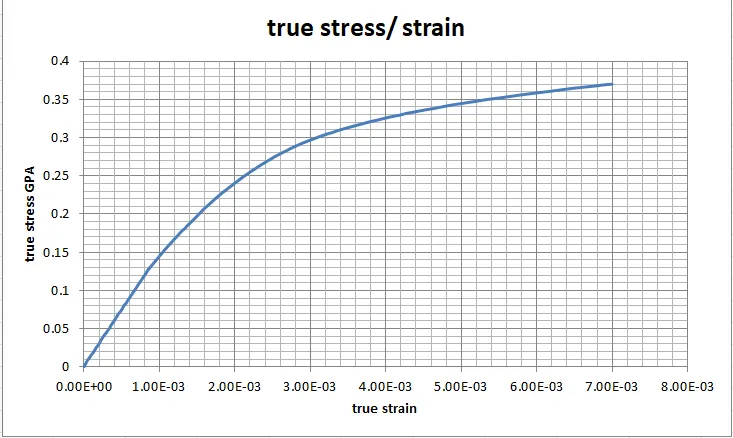
- As we can see that the curve is looking smooth after cleanup of data, now we can convert the true stress and true strain data into Effective stress and Effective plastic strain.
- In the below image you can see the plotted curve values of the effective stress/ effective plastic strain.
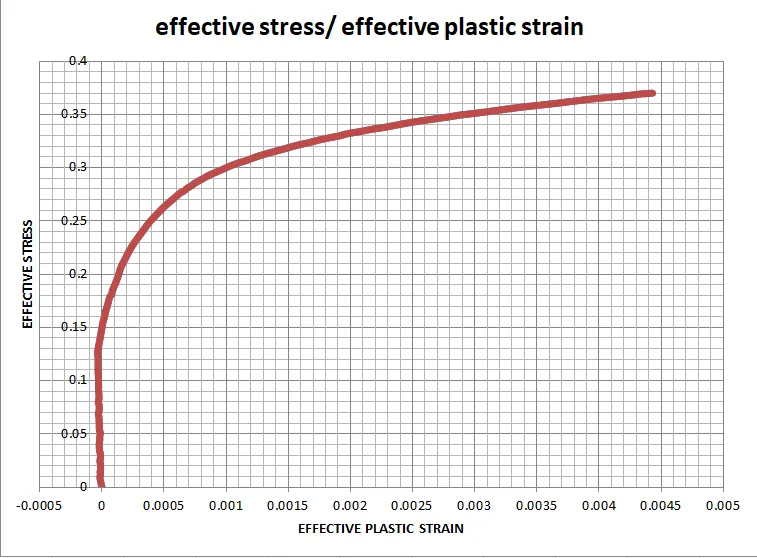
- from the curve it is clearly vissible that the non-linearity happens near the 0.15 Gpa. so, we submit the values from here for the curve as our intrest in in plastic region.
- Now, we move to the Ls-Prepost for setting up the dogbone specimen for the tensile test run. so, that we can validate the output result data.
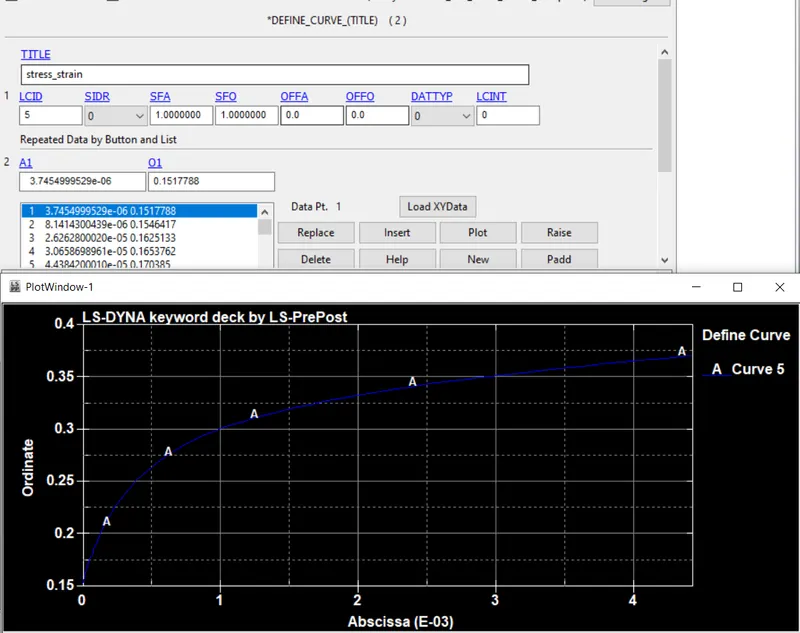
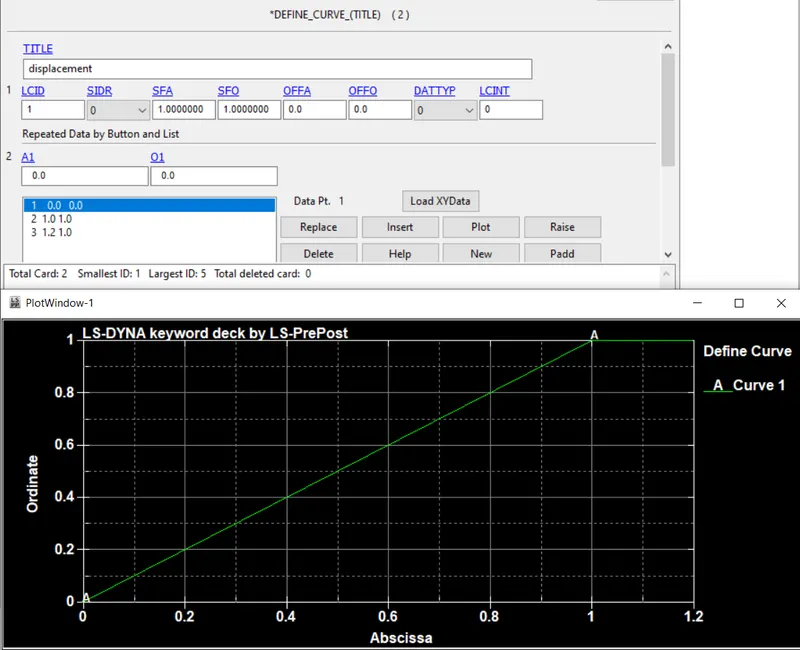
- the given dogbone model is imported in LS-Prepost and define the curves.
- the first we define a curve for the effective stress and effective plastic strain and second curve for the displacement for tensile test.
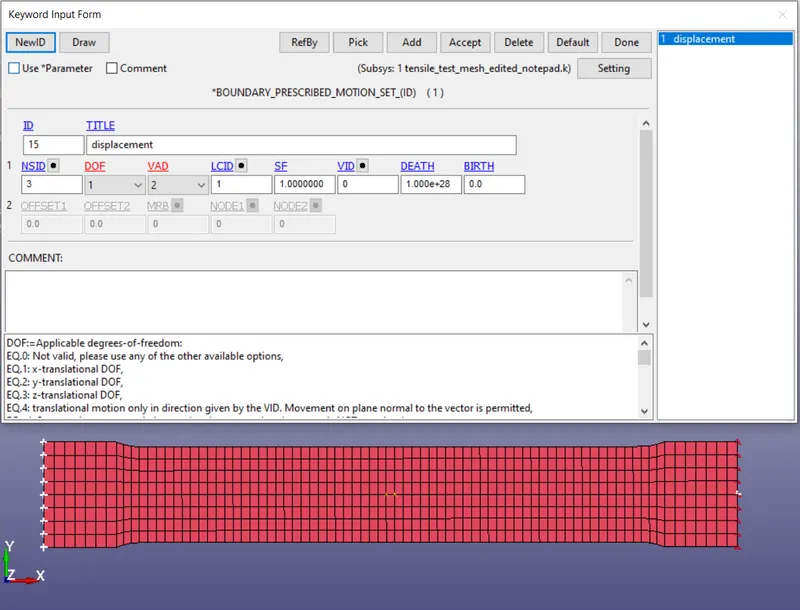
- now, the boundary conditions are applied to the nodes to control the free movement of the nodes.
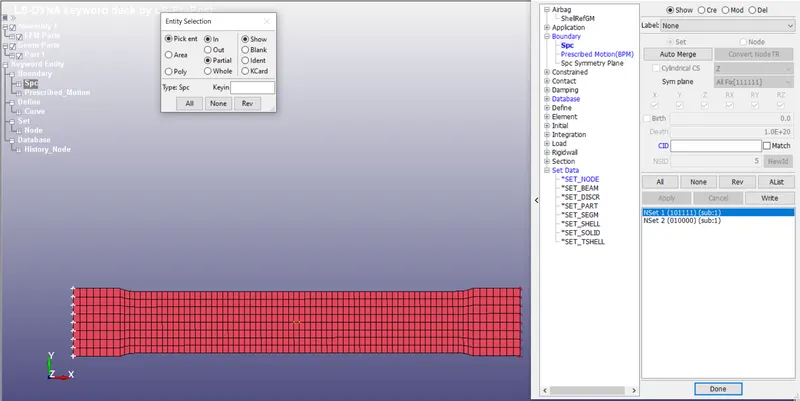
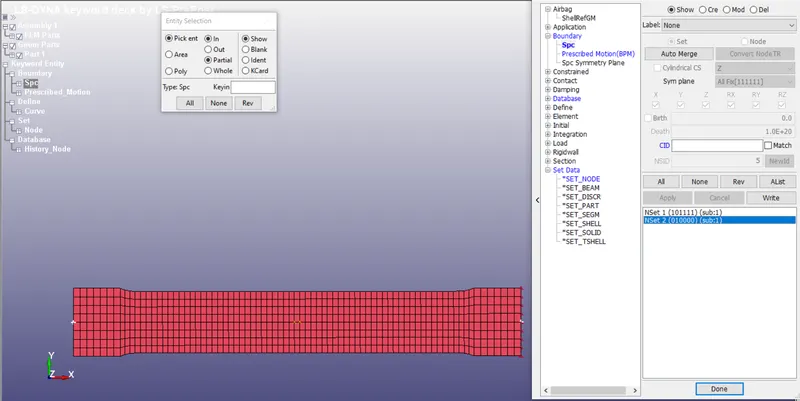
- from below images you can see that the left side corner nodes are arrested in all direction except Y-axis translation, so that when material expand or contrast it move freely in y-axis translational.
- the centre node from both corner is arrested in y-axis translation so that it cant move fron centre.
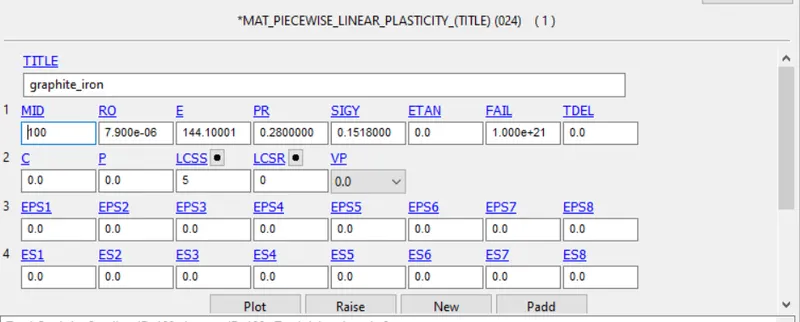
- Now, the material card is defined as behavior of plastic material and the effective stress/ effective palstic strain curve is applied in LCSS.
- In the below image you can see the following values submitted in the MAT-024 material card.
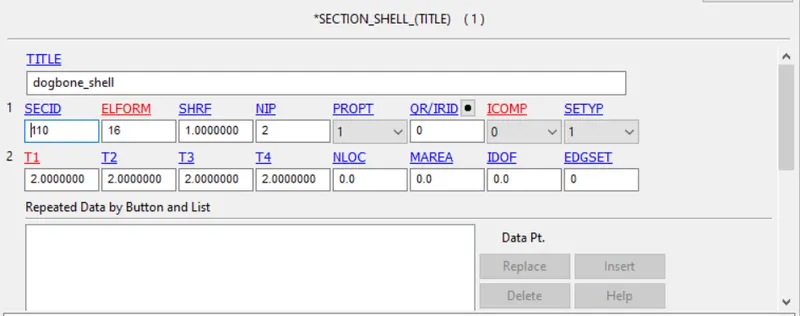
- Section shell card is defined as the given elements are in shell form, the thickness provied here is 2mm with elform of 16 which is fully integrated shell elements
- Now as we know that we are running tensile test for which IMPLICIT SOLVER is best option for the static structural problem.
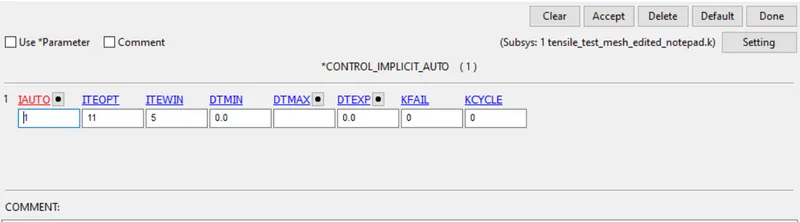
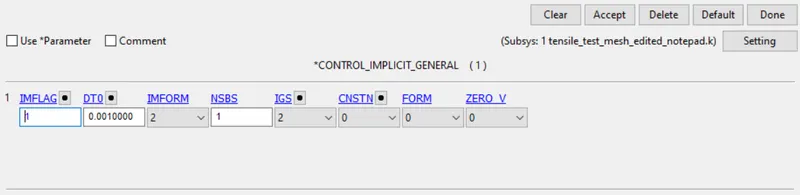
- we are defining CONTROL_IMPLICIT cards for the test.
- In the below images you can see the following Implicit auto and Implicit general card are defined whic are compulsary to run implicit solver by automatic adjusting the time step.
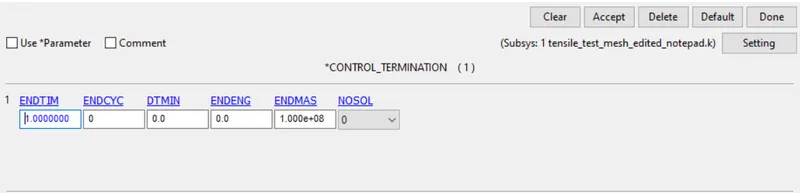
- now the CONTROL_TERMINATION card is used to define the end time of the simulation.
- Now the neccesary output data cards like DATABASE_EXTENT_BINARY , ASCII and D3PLOT are defined to store the output data in following intervals.
Note: To store the plastic strain data in output result the DATABASE_EXTENT_BINARY has to be used.
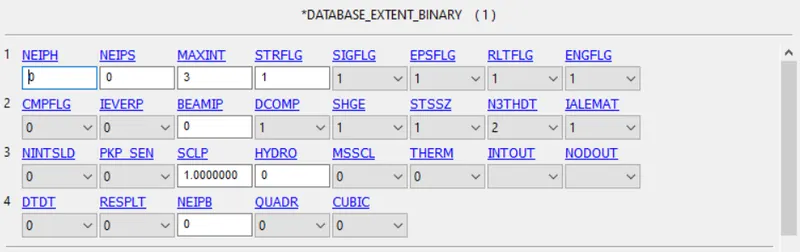
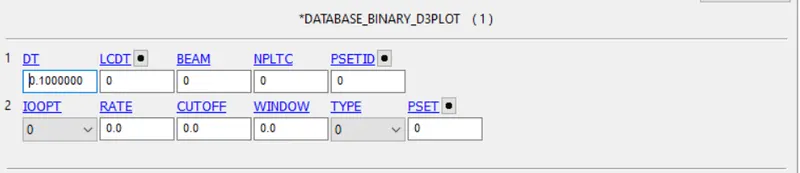
- Now the model has to be check in the model check manager and the save the file with .k extension.
- Open the file in the LS manager and run the test, before running the test make sure you select the solver and provide the memory as per the requirement.
RESULT AND CONCLUSION :
The test run succesfully and the output data is stored in the D3plot files. the given experimental raw data is used to modeled the MAT_024 material card to run tensile test on dogbone specimen and validate by comparing the output data in the below.
The test result simulation is shared through the link below and also the files related to the test are shred.
https://1drv.ms/u/s!AnGsOah9scM2gRqTQAfwa7gxW8nx?e=CnZUPt
- From the result data it is observed that the max effective stress induced is 0.379559 Gpa and the effective plastic strain is 0.00571199.
- the effective stress, effective plastic strain and low-ipt-x strain is plotted of the middle element and saved.
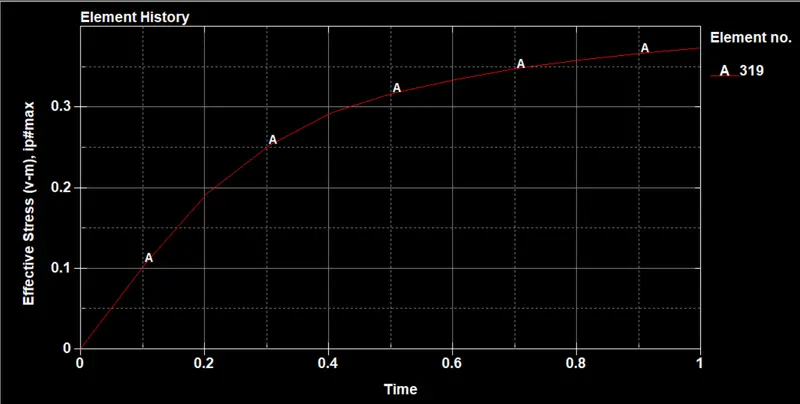
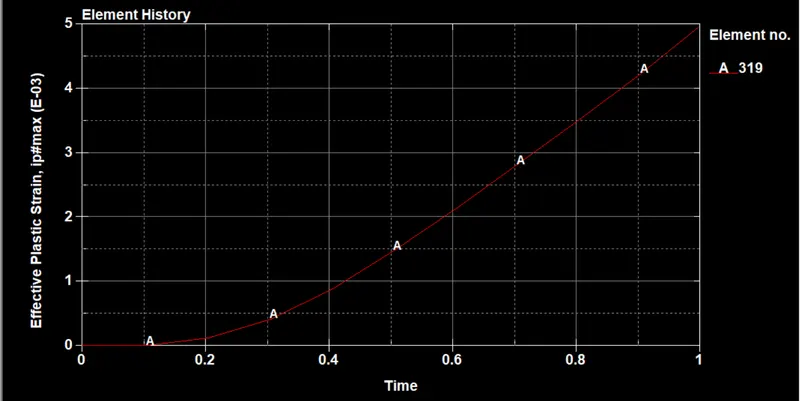
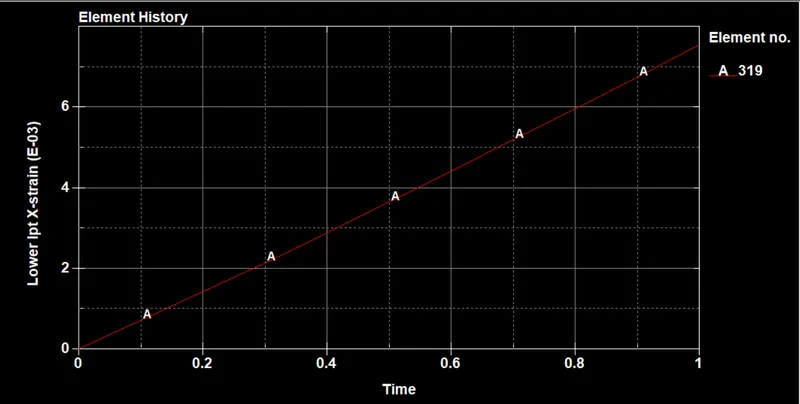
- The following data is stored and export in the excel sheet for the validation.
the low ipt x strain data is considered as true strain. - the comparison of the data is shown as in the form of curve. Legend shows given raw data and result data as simulation data.
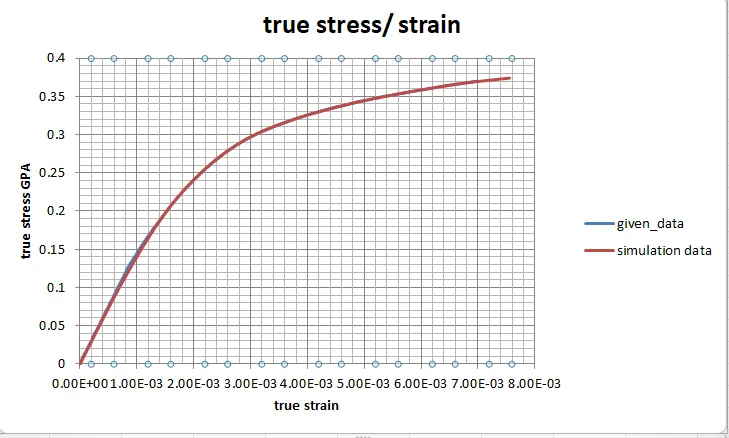
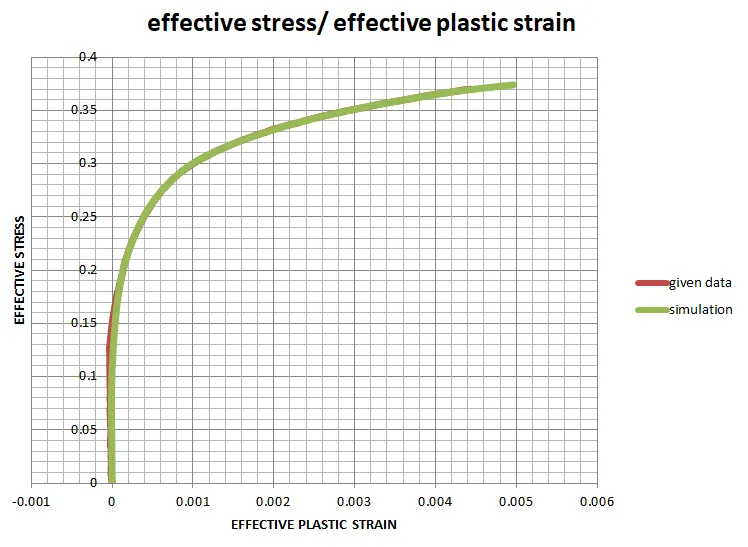
- As you can clearly observe from the above graphs that the validation of the experimental data is done the curve we have obtained from the simulation output data is exactly matches or fit with the given raw data.the given values are validate using the MAT_024 material card is done.
PROBLEMS :
- To be carefull while using CONTROL_IMPLICIT cards, small change in the values makes higher complexity in the problem.
- Understand the given values of stress and strain form, is that engg stress / strain (or) true stress/ strain.
- while extracting the points in data digitizer, try to pick points uniformly so that you can avoid data cleanup afterwards.
- while entering the curve values in notepad++ make sure of the column and row alignment.
- the displacment should be given in range, high range displacement can cause error or increase complexity which turns in high computational cost and time.