Week - 9 Material modeling from raw data
TITLE: MATERIAL MODELLING FROM RAW DATA
OBJECTIVE: To create material from raw data using strain stress curve
Dog bone specimen is used to test the material model.
MAT024 material card is used to model the data.
- Unit = kgmmms
- extracted data using digitizer software.
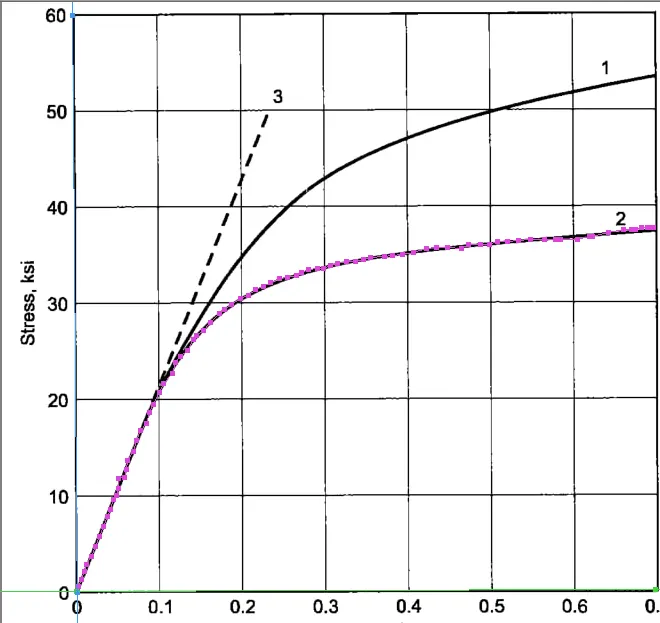
- As the curve obtained from this data is in Ksi unit systen therefore changed the unit system of the stress data(1Ksi = 0.00689476).
- The curve obtained from the raw data is too much noisy therfore to smooth the curve,curve fit operation is used in excel.
- Therefore 4th order polynomial is used to fit the curve.
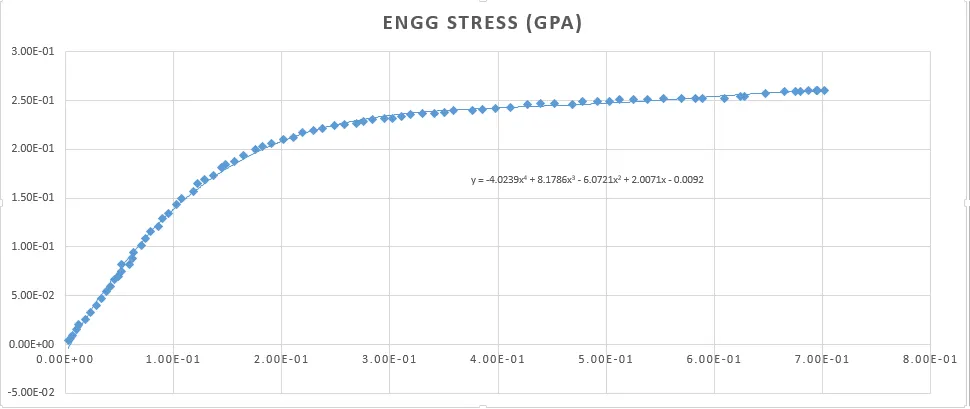
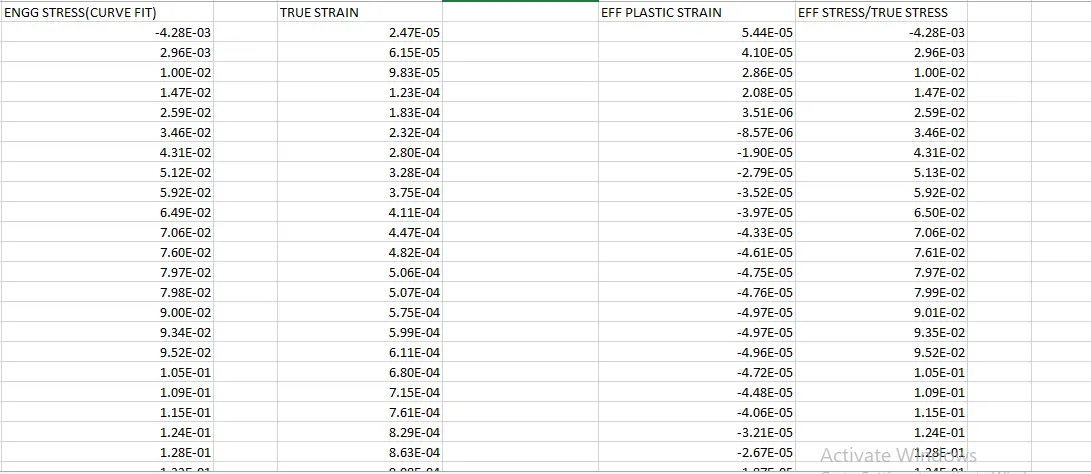
- From this data using formulae converted the strain and stress values to true stress and effective plastic strain.
- True strain = ln(1+engineering strain)
- True/effective stress = engineering stress(1+true strain)
- Effective plastic strain = true strain - true stress/E
- Given E = 20.9e+06 psi = 144.100 Gpa
- Final curve for the data
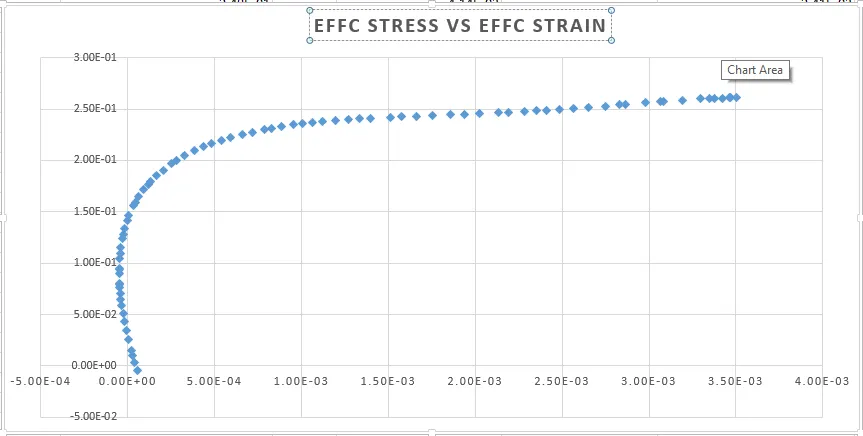
- Now Data is plotted in the define curve option.
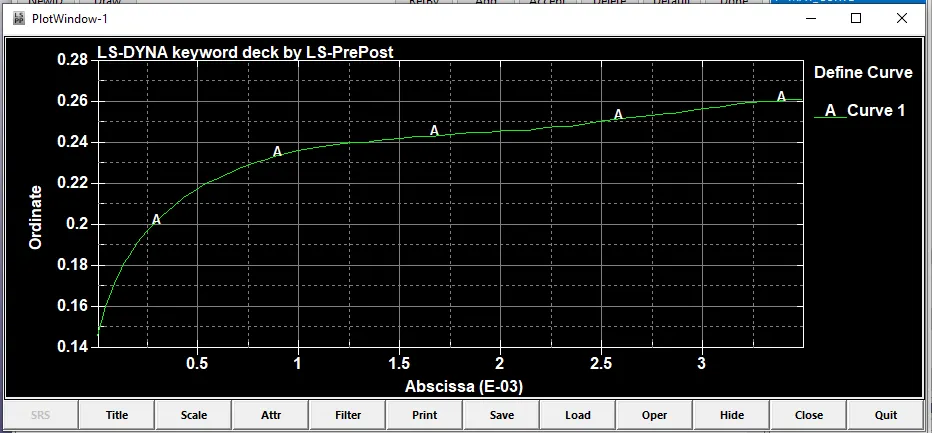
As the value of elastic region is inserted manually therfore curve is defined only for the plastic region.
- Now the simulation is setup.
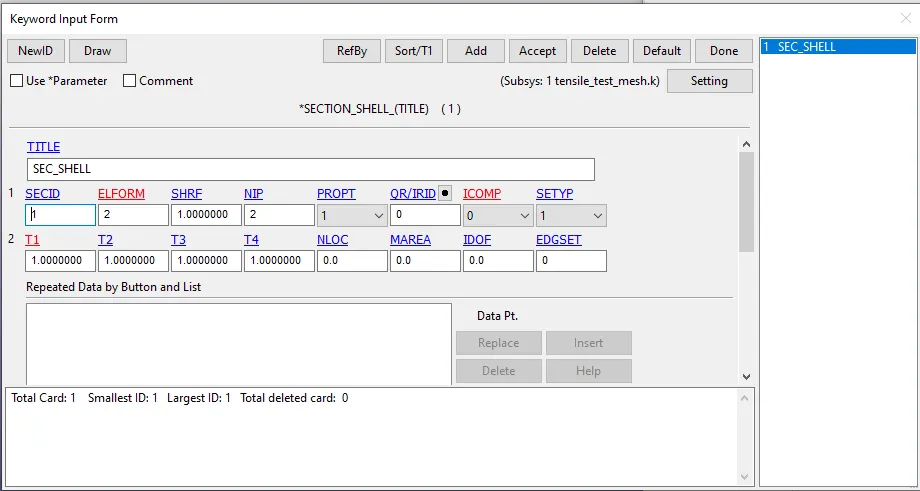
- Defined Section and materials.
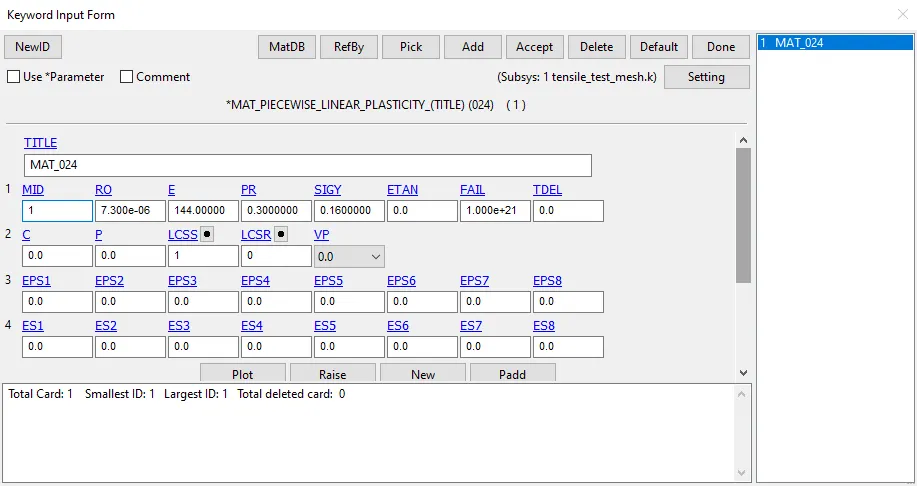
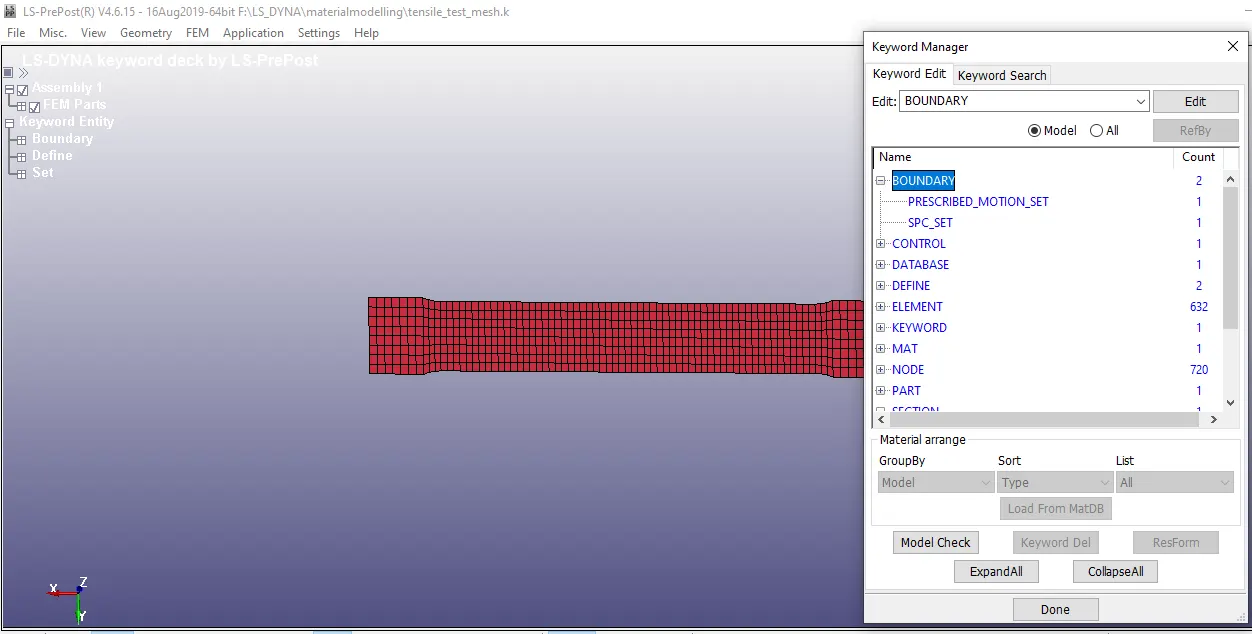
- For boundary condition,Set of node in one direction is constrained and other set of nodes in opposite direction is given to motion in x direction.
- Defined the control termination card at a termination time of 1ms.
- Defined database d3plot for results and contour.
- As the simulation is quasistatic in nature therfore for more accuracy implict solver is used to run the simulation.
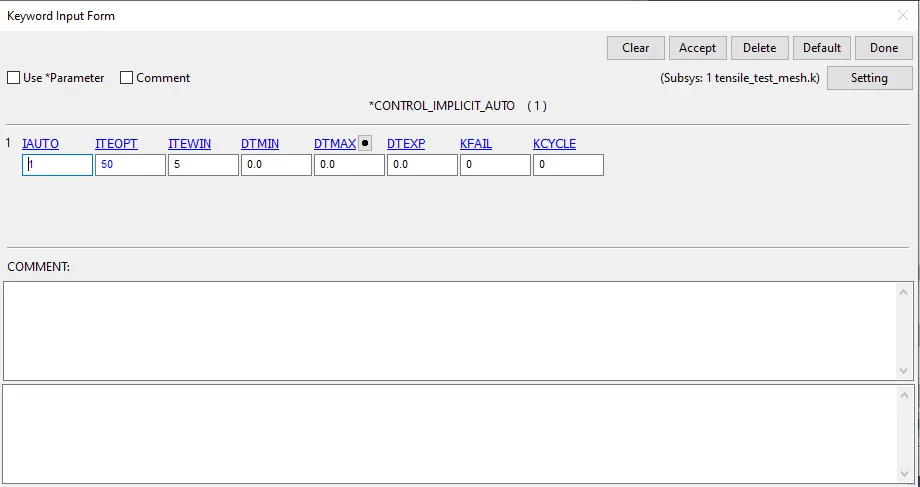
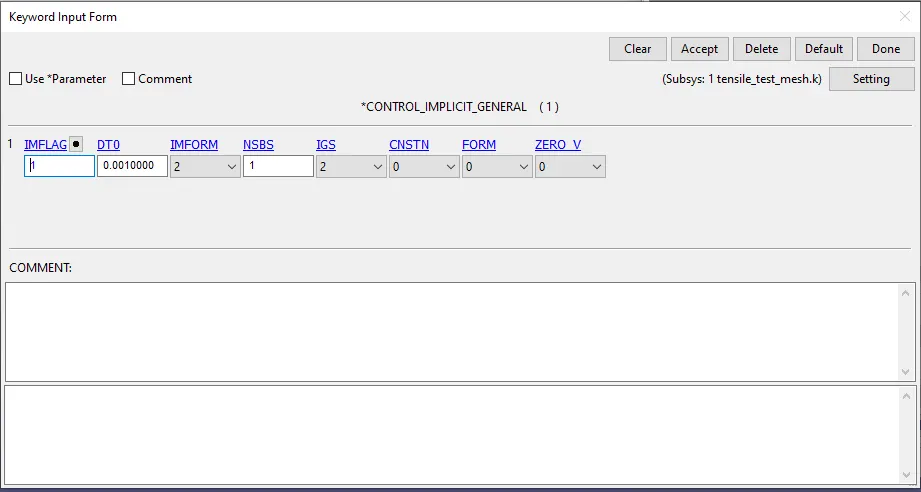
RESULTS:
- STRESS PLOT
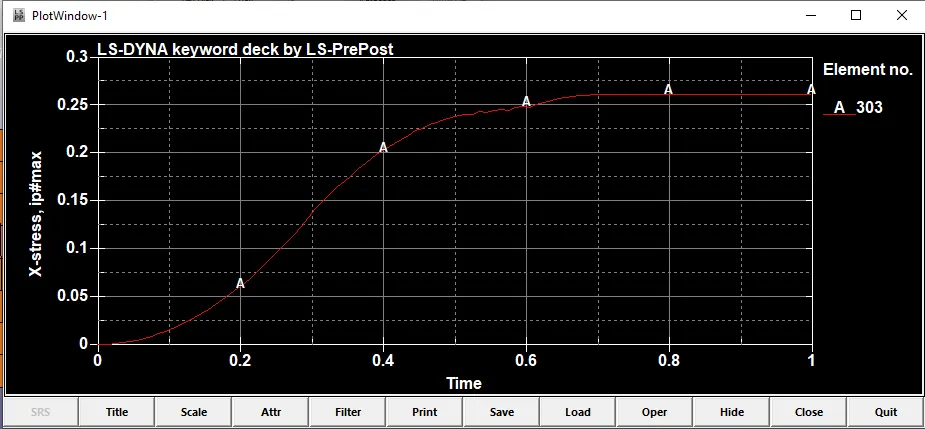
Stress increases with respect to time and keeps constant after 0.8ms.
- STRAIN PLOT
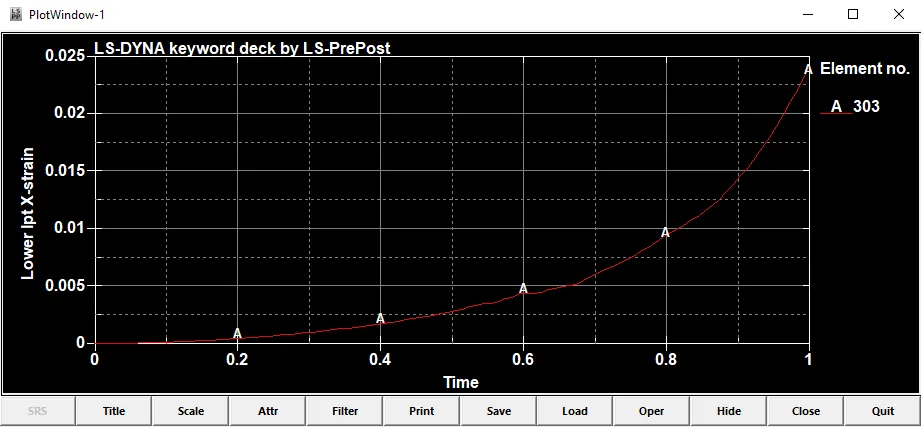
Strain increases gradually with respect to time.
- STRESS VS STRAIN PLOT
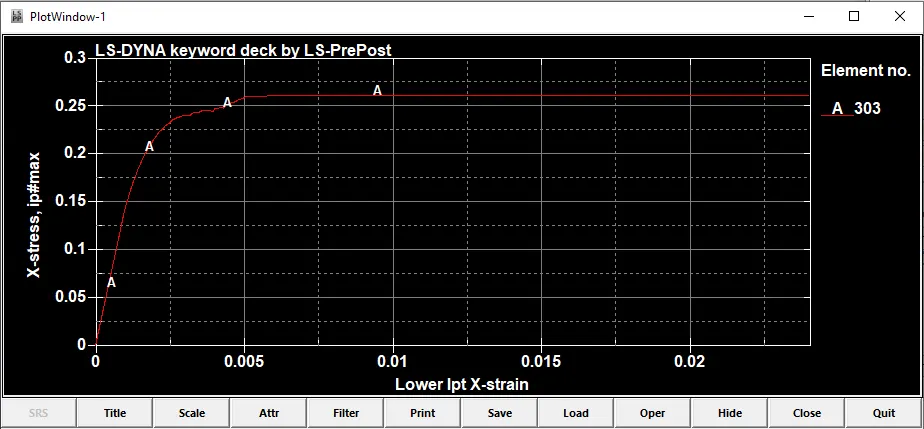
Stress increases with strain with respect to time and keeps constant after 0.5ms.
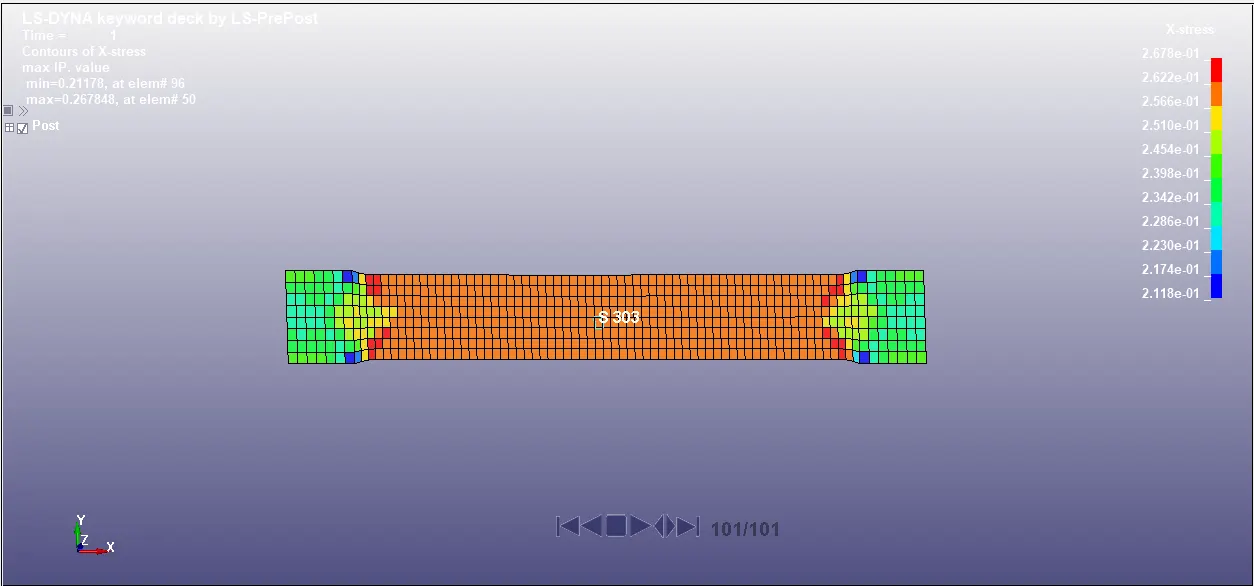
MAX STRESS = 0.26 Gpa
CONCLUSION:
- By comparing the final stress vs strain plot with the intial plot of stress and strain ,we can see that both are similar upto some extent.
- Raw data data is extracted and material is modelled using effective stress and strain plot.
- Implict analysis is performed for more accuracy of results.