Week - 9 Material modeling from raw data
Material modeling from raw data,
Objectives,
Use the data digitizer extract the data of Stress and Strain from the given graph. Use these data points and create the MAT_24_PIECEWISE_LINEAR_PLASTICITY material card. Convert the data to the Kg-mm-ms unit system.
Procedure,
Diagram of the true stress-strain curve of graphite iron casting with different material structures. Select any one of them and use the data digitizer to create the data points from the graph. Copied these values to excel, here use the trendline option, and generate the stress data for the same strain.
Stress values in ksi required our data in the kg-mm-ms unit. we are modeling the elastic-plastic material, so instead of engineering stress and strain values convert to the data in Effective stress and Effective plastic strain using the following formulas,
1. True Strain = Ln(1+Engg.strain)
2. True Stress = Engg.Stress(1+Engg.strain)
3. Effective Stress = True Stress
4. Effective Plastic Strain = True Strain -(True Stress/E), where E = 20.9e+06 psi
Where, 1 psi(pound-force per square inch) = 6.89476e-6 GPa and
1 ksi(kilopound-force per square inch) = 0.00689476 GPa.
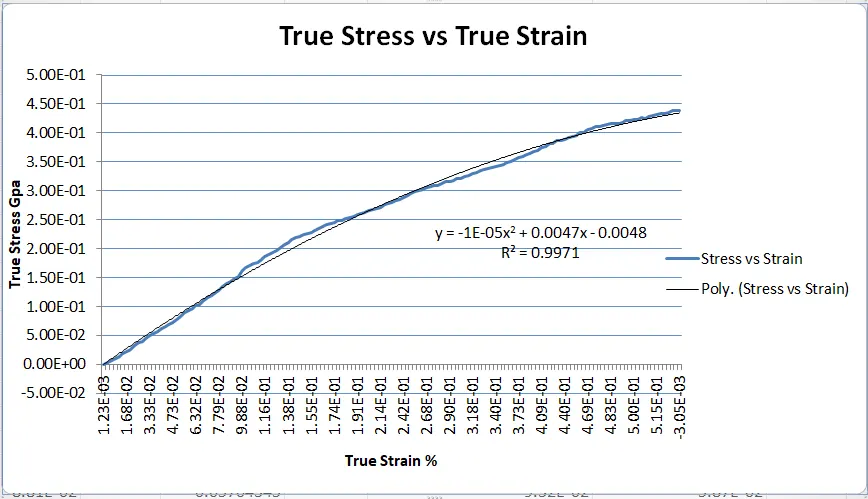
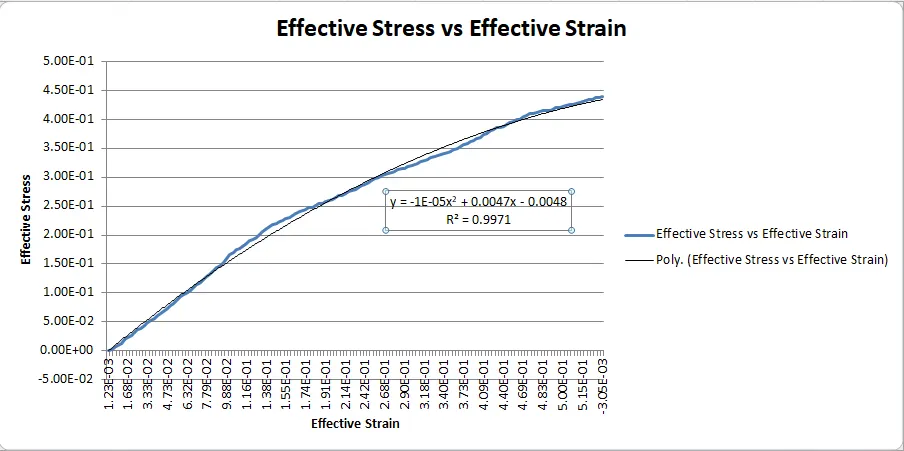
Use the material model with a dogbone specimen,
Use MAT24_PIECEWISE_LINEAR_PLASTICITY create the material card then create the section card using SECTIION_SHELL. After that, assign these two cards to the Part.
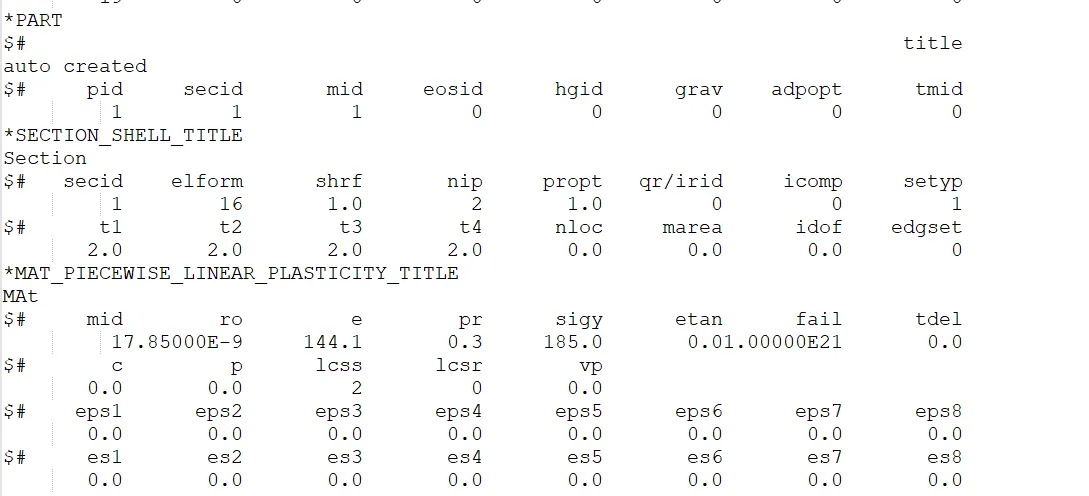
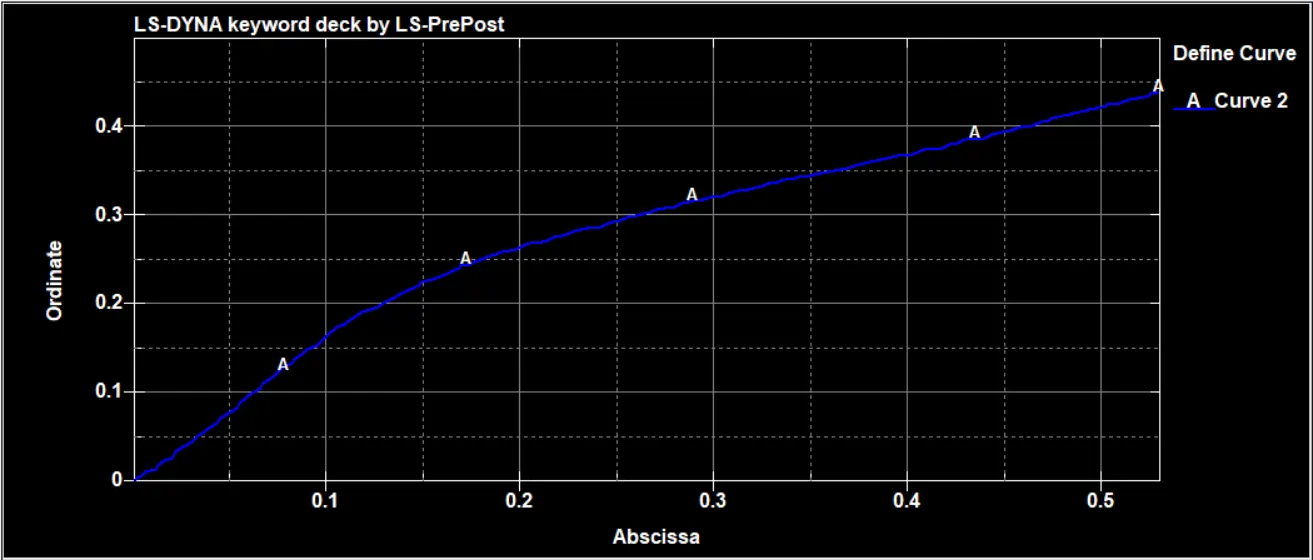
There are two curve defined one curve is used for displacement and another one define the material stress-strain properties, these curves get from the diagram of the true stress-strain curve.
In the dogbone specimen, constrained all nodes of the left side of the specimen. And right side node of the specimen constrained y and z-direction only.
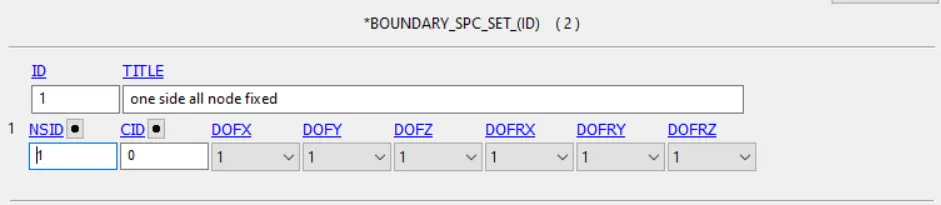
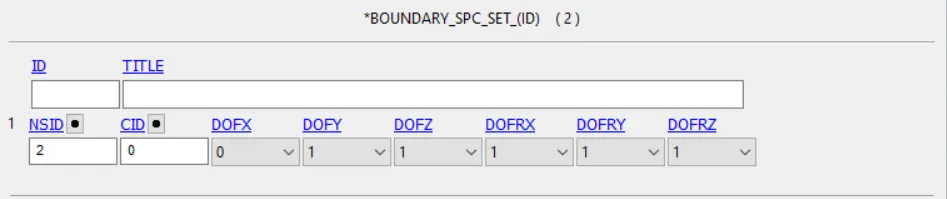
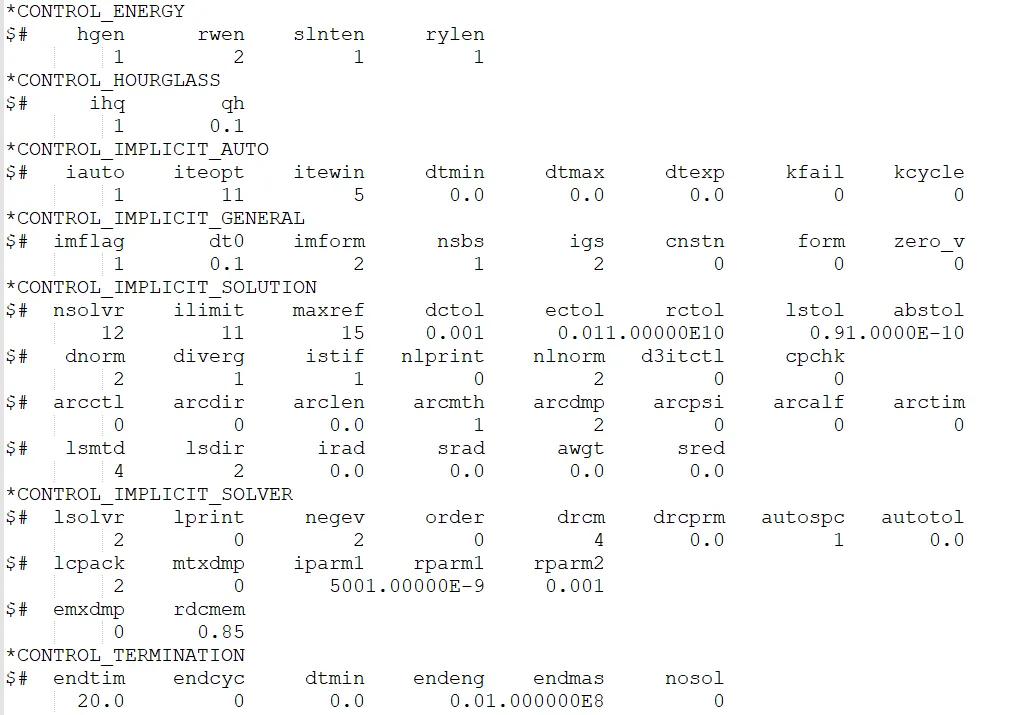
Create the BOUNDARY_PRESCRIBED_MOTION_SET to define the displacement of the specimen. In this case, we proceed with this activity using implicit simulation, so create the CONTROL_IMPLICIT cards define the solver type and time step info. Control Termination card defined in ms.
Results,
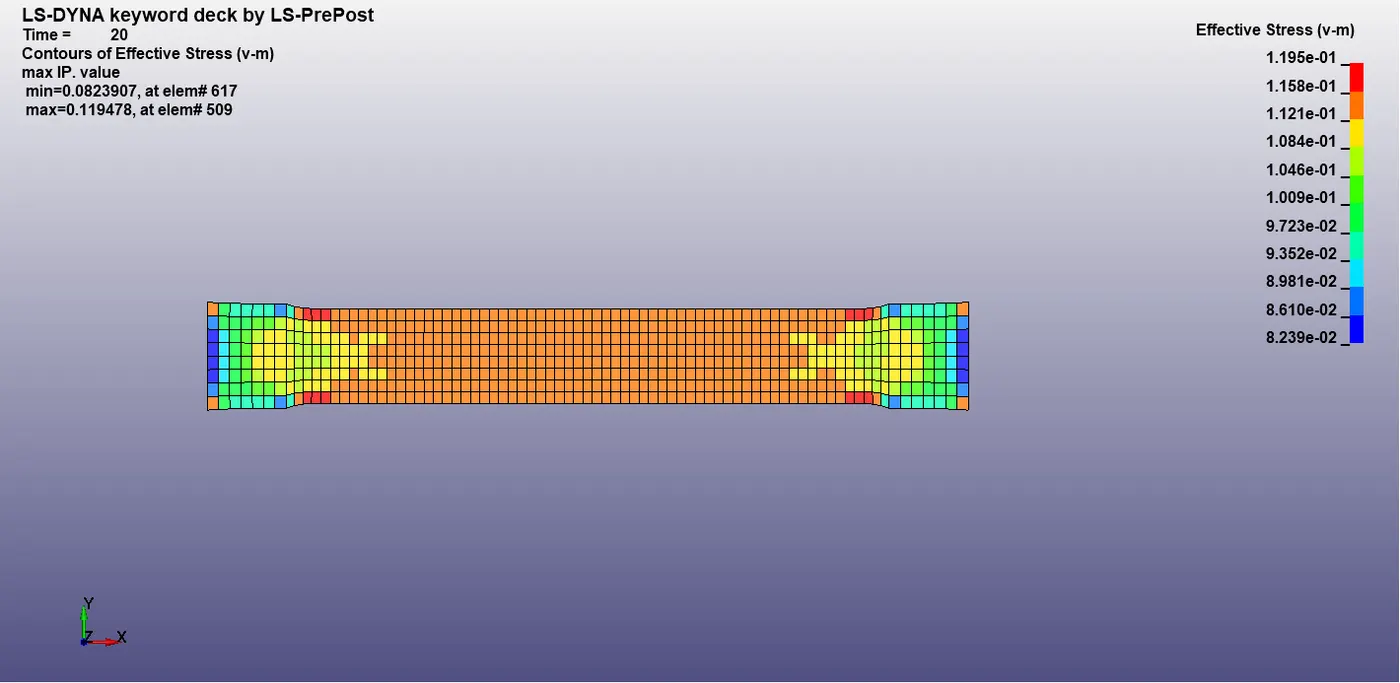
Fig. Effective Plastic stress
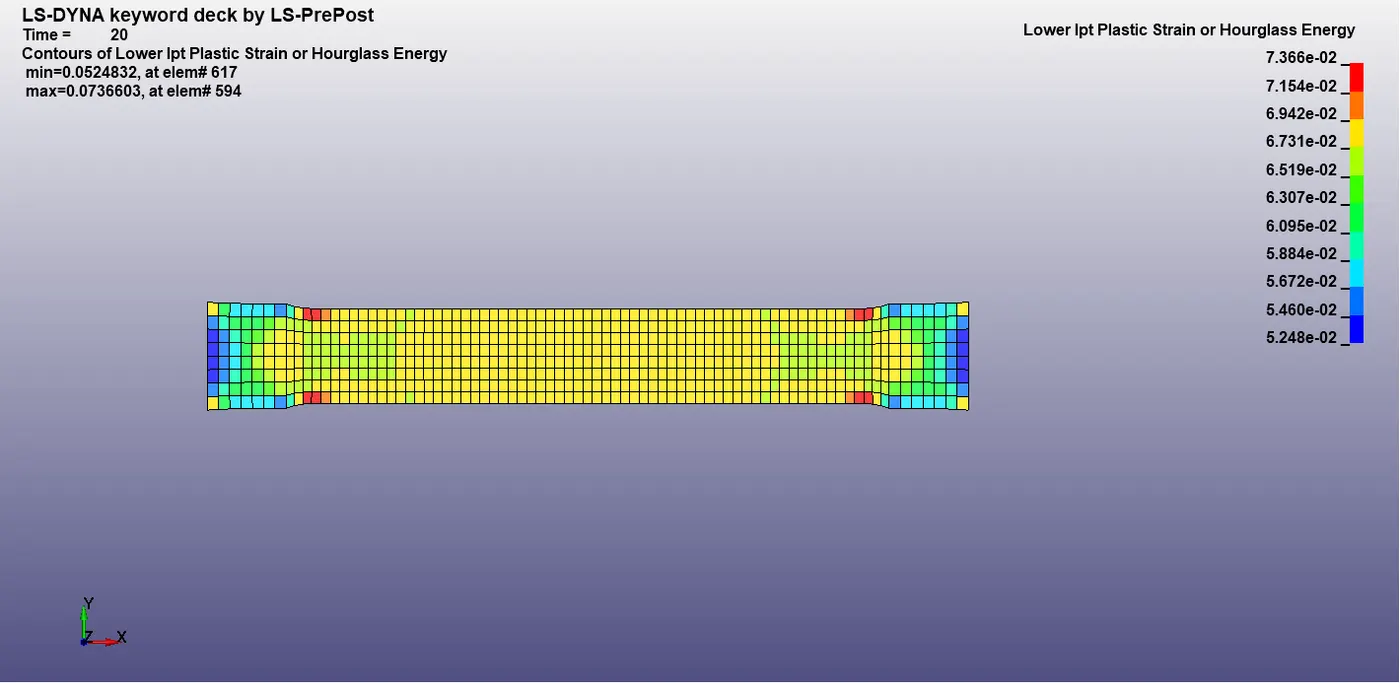
Fig. Effective Plastic Strain
The maximum stress 1.195e+01 at 20ms acting on the dogbone specimen and the maximum strain is 7.365e-02 at 20ms acting on the specimen.
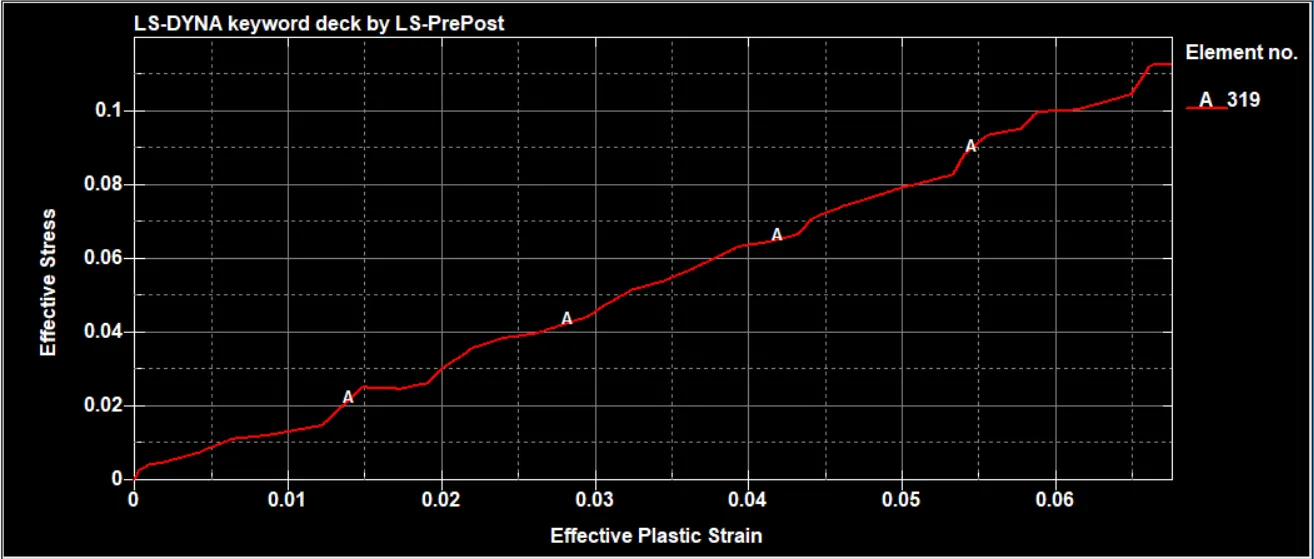
This is the final stress-strain curve from the LS-DYNA pre-post. From the graph, we can see that our material model value is up to the required accuracy almost matched with the calculated value.
Conclusion,
This assignment is learned in the process of modeling material in Ls Dyna from the graph/ tested data. This one also shows the simple variant in the simulation data. First, we use a diagram of the true stress-strain curve, get the data points from the data digitizer after that one is data cleanup is an important one. Because the graph is important so the curve needed to smooth and likely avoid the peaks and valleys.