Week - 9 Material modeling from raw data
Week - 9 Material modelling from raw data
Aim
– From the given true stress and strain curve create model MAT024 or MAT018 elasto plastic material and validate them by simulating simple tensile test.
Explanation
Using image digitizer the given true stress and strain values are extracted into csv format.
This data comes from material physical testing a specimen uniaxial or biaxial according to the requirements.
MAT018 - MAT_POWER_LAW_PLASTICITY
This is an isotropic plasticity model with rate effects which uses a power law hardening rule. It requires mass density, young’s modulus, poisson ratio, strength coefficient and hardening coefficient. The linear portion of the stress strain curve is from young’s modulus and poisson ratio. Plastic portion is governed by the hardening parameter.
MAT024 - MAT_PIECEWISE_LINEAR_PLASTICITY
This is also the isotropic plasticity model. Plastic region of the material can be inputted as effective stress and strain curve or we can manually enter the effective stress and strains. This card helps to implement the material property more accurately.
Procedure
- Data from the curve is given curve is extracted – to get true stress and strain %.
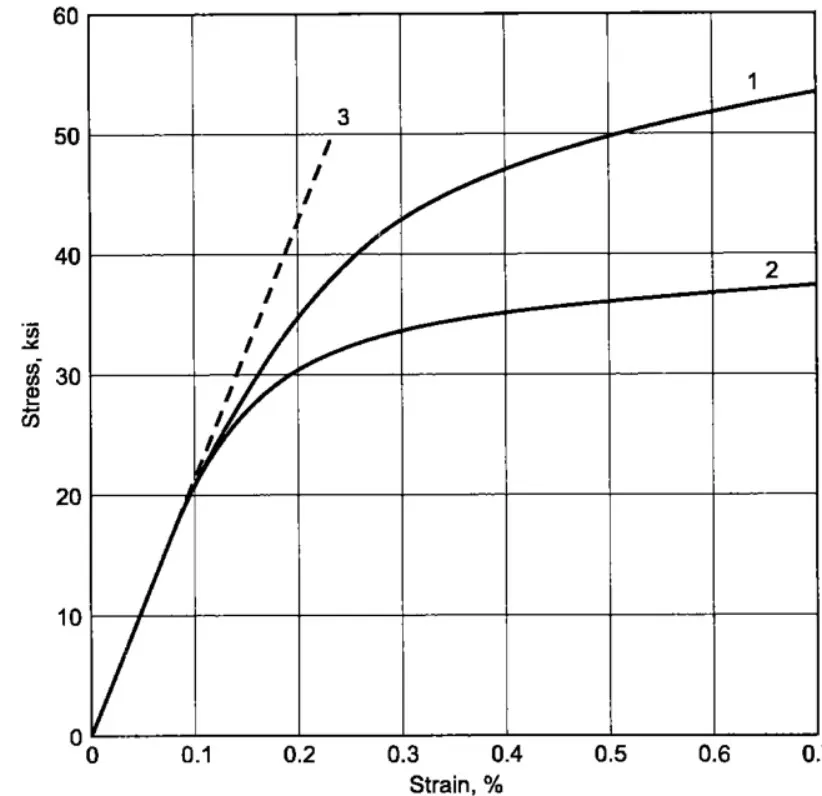
- Graph Stress is in ksi and strain in percent % hence it needs to be converted to MPa and Strain values. Selected data is curve fitted and 50 -70 points are extracted to be inputted into material card.
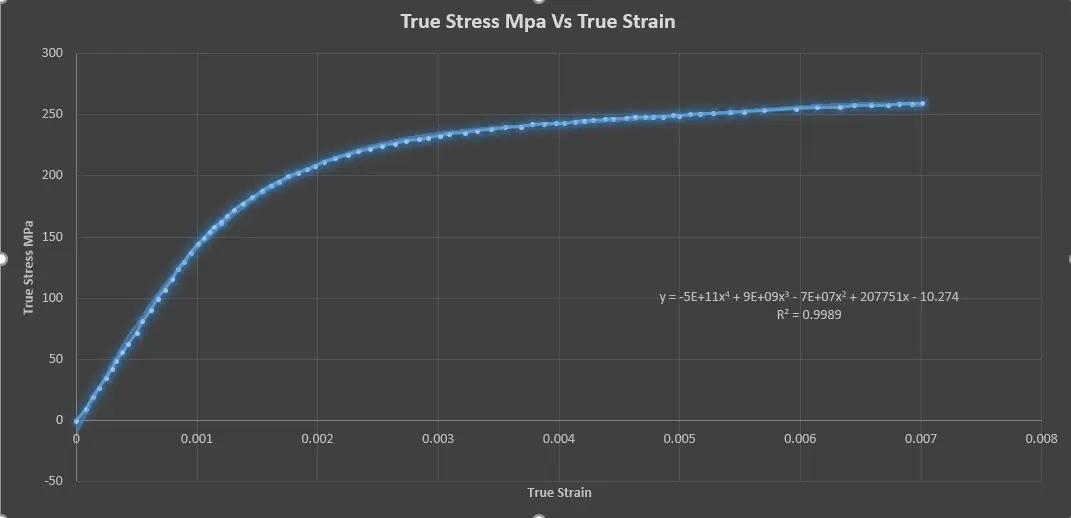
- True stress and strain needs to be converted to effective stress and strain values
- Effective Stress = True Stress
- Effective Strain = True Strain - True Stress/ Elastic Modulus
- This effective strain and stress needs to be inputted into the material card through a load curve. (The first point must be zero corresponding to the initial yield stress)
- Create the curve and MAT024 card with
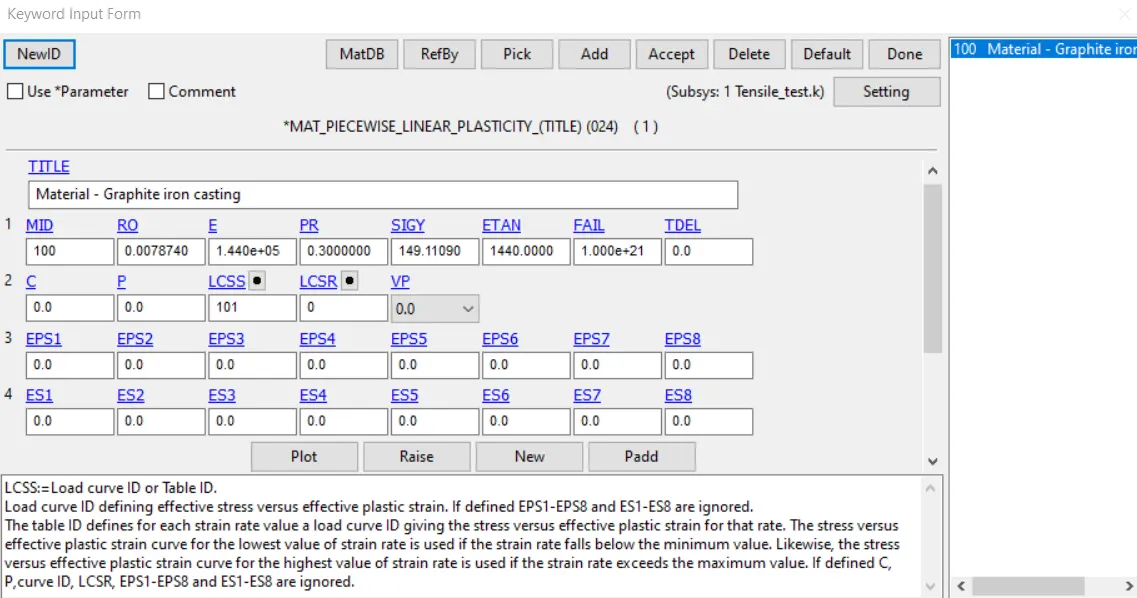
E= 1.440e+05 MPa ;
Poisson Ratio = 0.33 ;
Yield stress = 149.11090 MPa ( Data is from the final linear point from the stress strain graph)
Tangent Modulus = 1440.0000 MPa ( 1% of E)
Load curve is related to the defined effective stress and strain curve.
- Boundary condition for the dogbone specimen
- SPC is created to fix one end of the specimen with only y dof released (lateral defomation is allowed in y direction).
- Another SPC for the neutral point with y only DOF contrained.
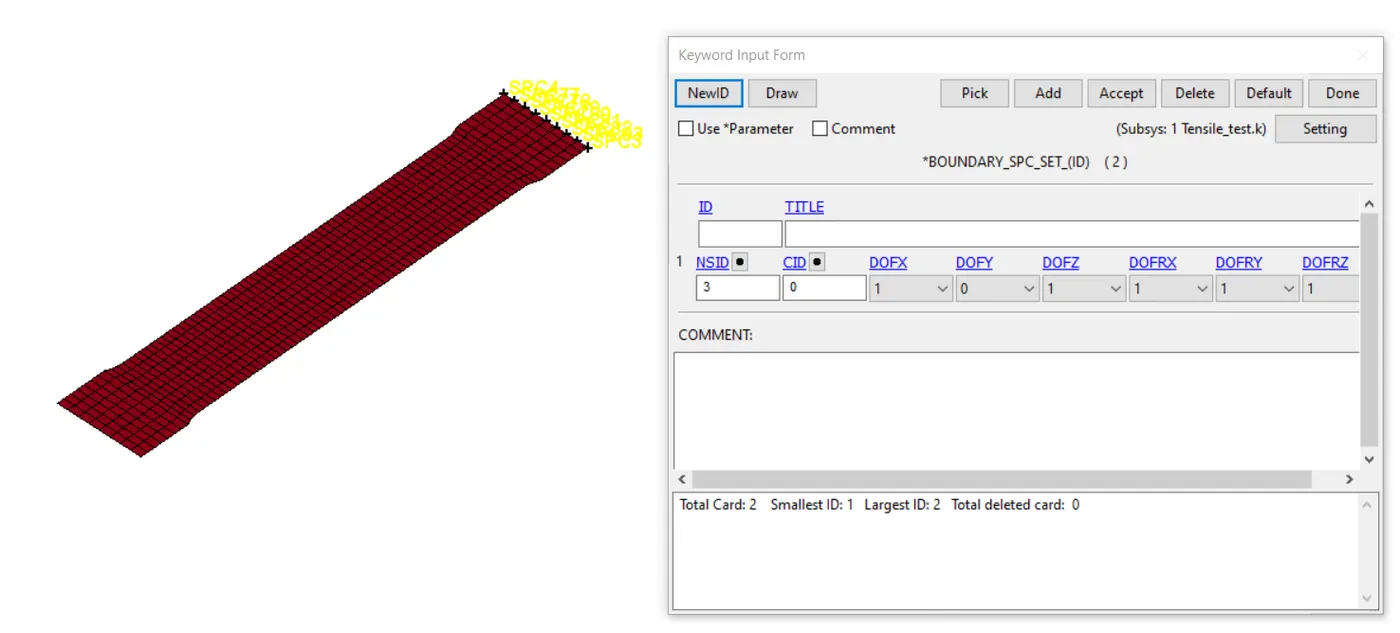
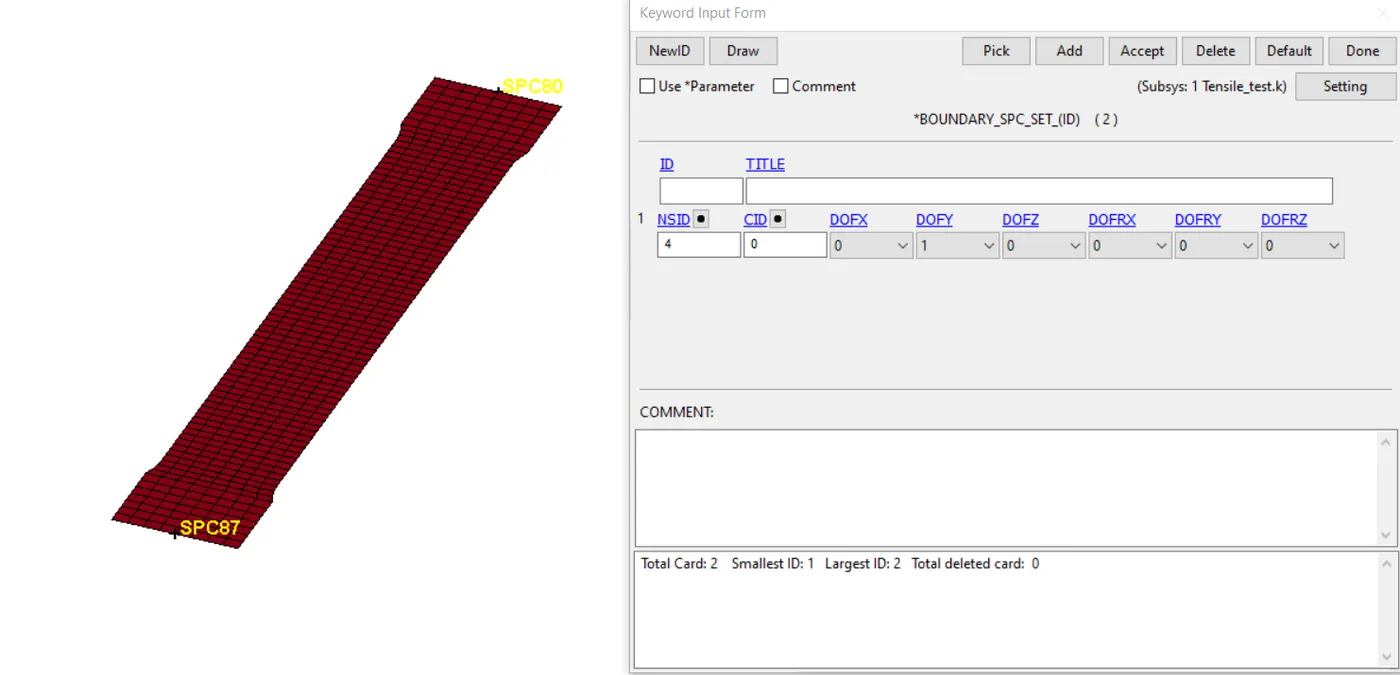
- Prescribed motion displacement is given to the other end of the specimen to be put under tensile load.
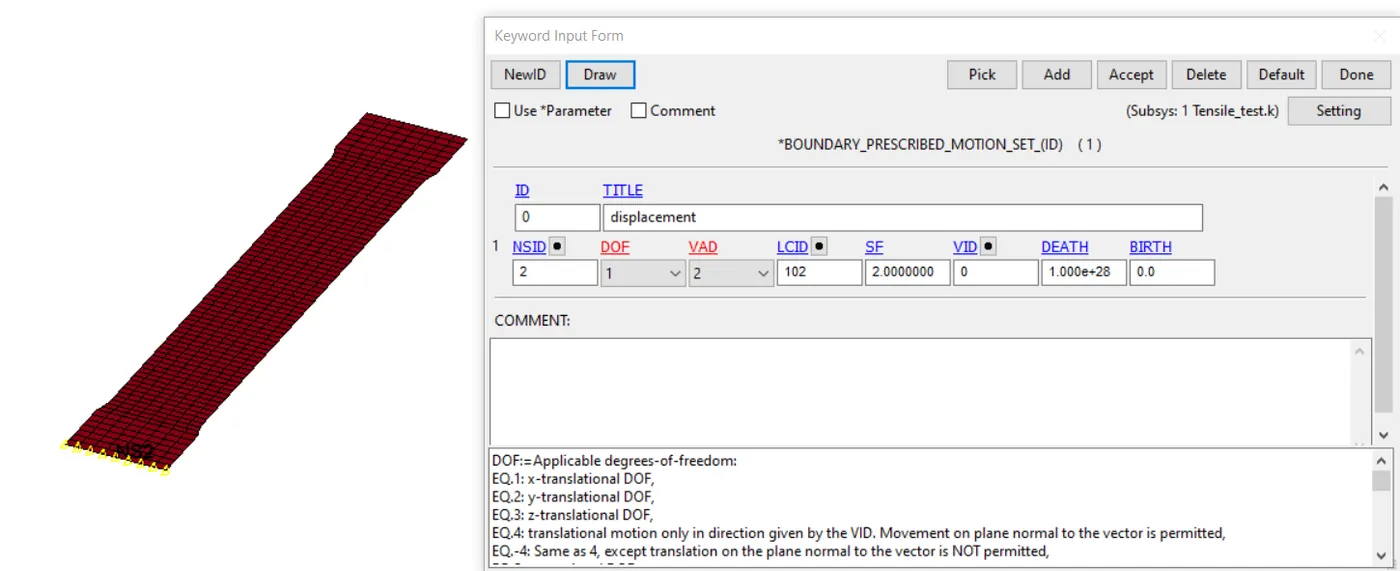
- Control cards are created like termination and Implicit cards such as CONTROL_IMPLICIT_AUTO,CONTROL_IMPLICIT_GENERAL,CONTROL_IMPLICIT_SOLUTION,CONTROL_IMPLICIT_SOLVER
- DTMIN and DTMAX are 0.01 and 0.1 ms for this run and Initial DT is 0.01ms.
Results and Conclusion
- Effective VM stress
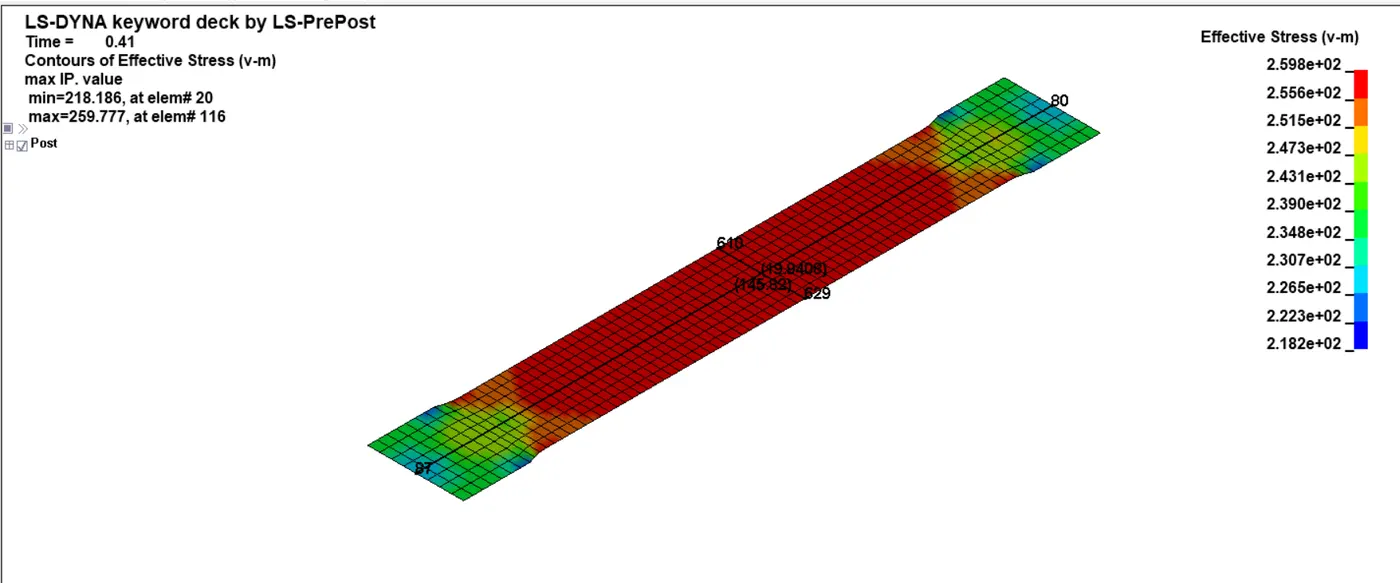
Material undergoes lateral compression and longitudinal elongation leading to plastic deformation in the material.
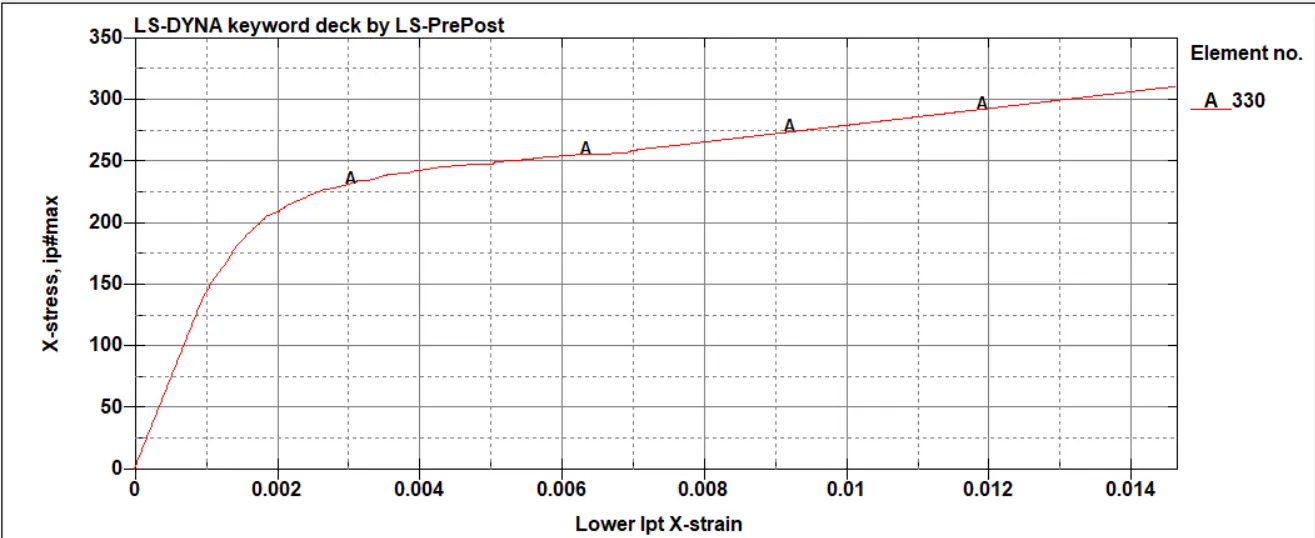
The x stress vs strain graph of the specimen, the material follows the given inputted material data of effective stress and strain but the portion after 0.007 strain is extrapolated by the solver.
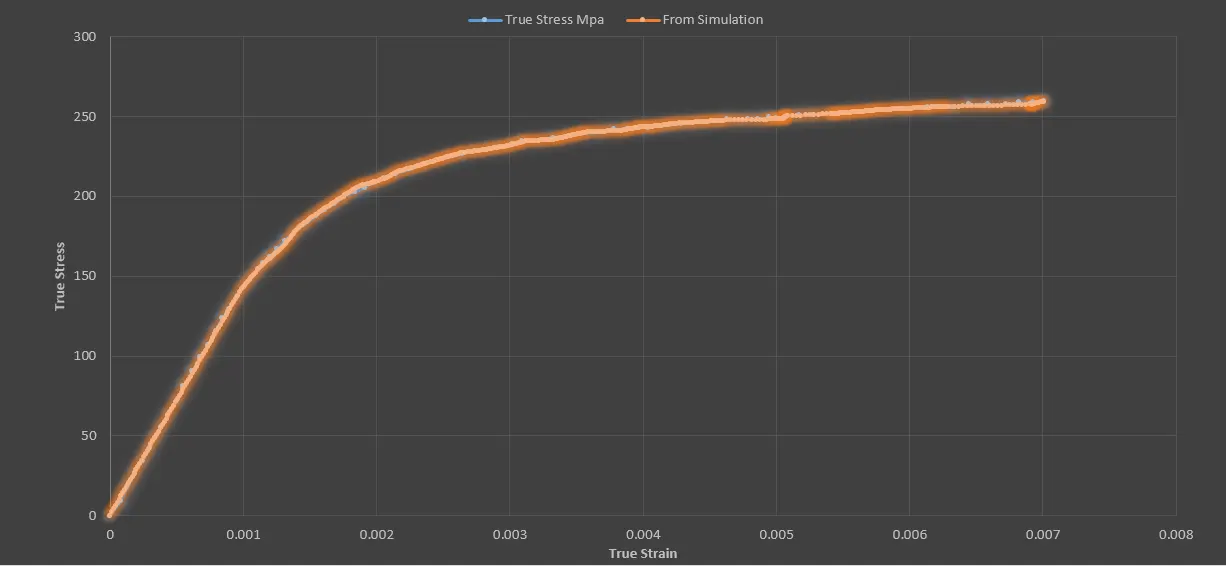
From the above the graph we can see that the simulated and true stress / strain given is validated. ( Given Plot is blue color plot behind the Orange Simulated Tensile test curve)
Hence it can be concluded that the card is working as per the inputted curve for the MAT024.