Week - 9 Material Modeling from Raw Data
MATERIAL MODEL USING STRESS-STRAIN DATA CURVE OF STEEL
Objective: To create material model for given stress-strain curve of steel and validate it using the given dog-bone specimen
- Extraction of Data from the given Diagram.
- Cleaning the data and matching with the original data
- Select a proper unit system kg-mm-ms.
- To create material card using the given data points.
- Validating the created material card for given
Procedure:
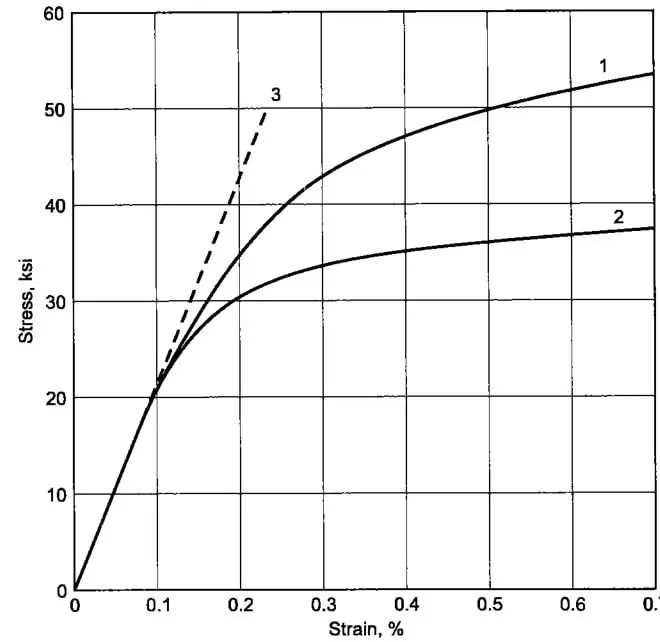
Extract the Data:
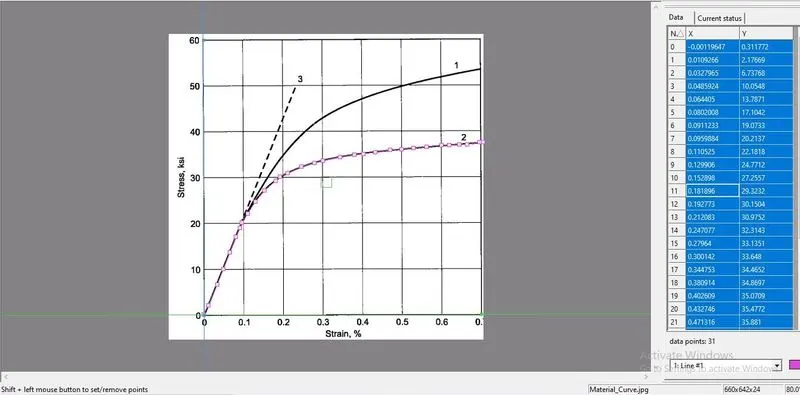
The data points are extracted from given material curve using data digitizer. The curve number 2 is selected for extracting the data. Then the extracted data is exported excel sheet using the export option the software
Now there are two materials given one
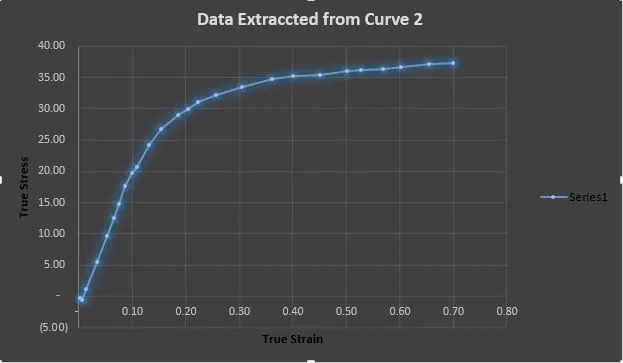
Data clean up-Curve fitting:
"The data point extracted from the image is always noisy and the data points are selected manually by picking each point so they will be some human error and Since, Ls-Dyna will accept only the monotonically increasing" curves. We need to clean up the curve and fit the rough data. This is done using Microsoft EXCEL.
0.2% offset yield strength: 0.248211GPa.
"Once the unit conversion is done, we can see the extracted data are True stress and True strain But to define a Stress-Strain curve in *MAT_ 24 card, we have to define it in Effective stress and Effective plastic strain format. The" true stress and strain values are converted into Effective stress and Effective plastic strain value using the following formula.
Effective stress = True stress
Effective plastic strain = True strain – True stress/ E
Young's Modulus is given for the material as 20E+6psi i.e. 137.917GPa.
"As the stress value increases, there coverable strain (true stress/£} increases as well. For metals, E is very large compared to the yield stress so it’s fairly common practice in the case of metals to just subtract off a constant value equal to the strain at initial yield from all subsequent strain values." "The True stress, in this case, is taken as the yield strength point from the true stress-strain curve. The value is about"
True Stress / E = 0.13373/137.917
True Stress/E=0.00097.
"The hardening curve which is defined in the material card should start ideally with yield strength and effective plastic strain (at yield strength) as a first point. So, we can remove the elastic region data point from the curve."
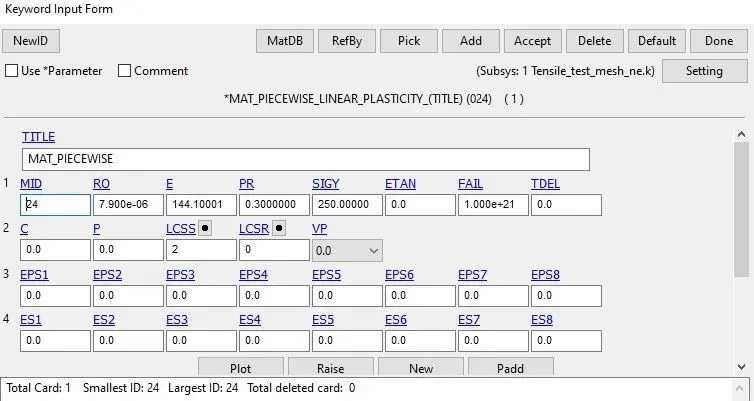
The effective plastic strain is calculated in the excel sheet from the true stress value using the relation Effective plastic strain = True strain - (True stress/ Young's modulus) "The region of the curve after the yield point (144 Gpa) is the plastic part of the curve.
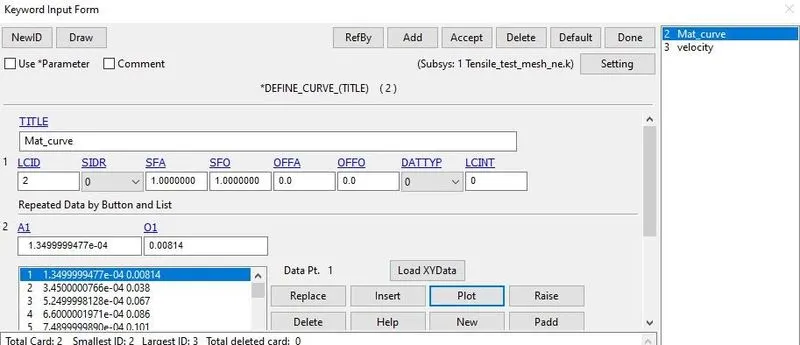
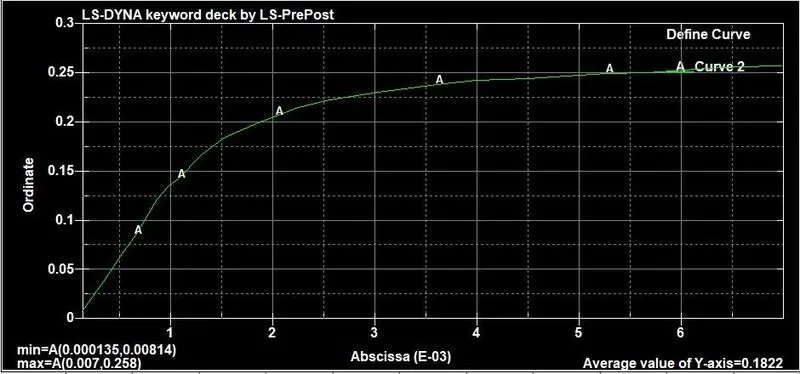
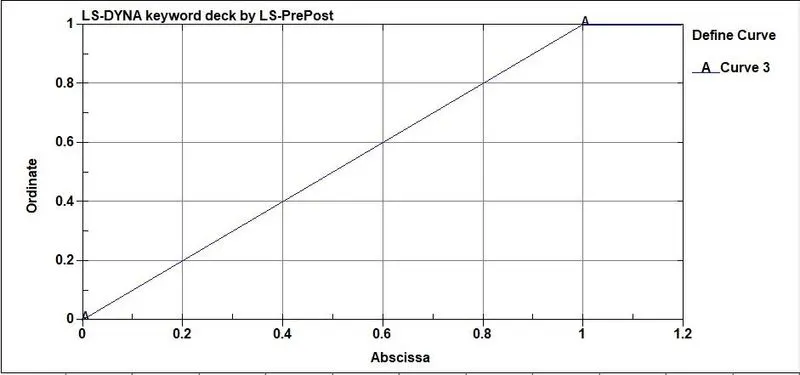
Therefore the values in the excel sheet after this stress point, and the corresponding EPS values are input into LS Dyna and the curve is generated as “shown below
Boundary Condition.
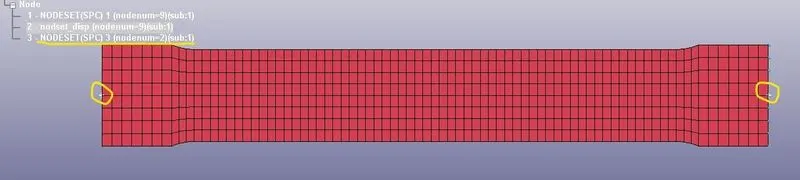
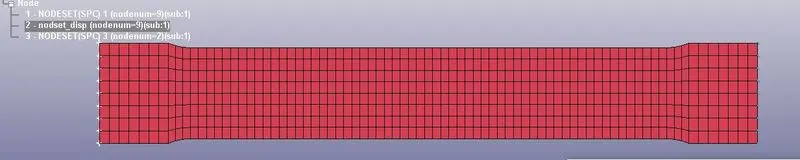
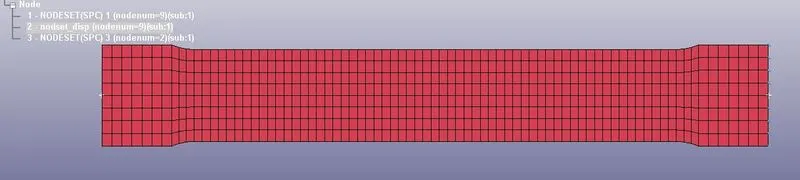
Since we performing a Tensile Test where one end of the specimen is fixed and the displacement is added to the other end so we will use two types of boundary conditions on the Specimen.
BOUNDARY_SPC_SET:
To fix one end of the specimen as a test procedure we will constraint all the DOF accept Y direction (because specimen will elongate in the X direction and simultaneously contract in Y) for edge node on one end of the specimen. “First, the image is processed and the x-scale and y-scale are decided (min,max values). Then the data points” “are selected from the image. Selected data points are displayed with the X and Y coordinates in the top right corner of the application. Finally, the file is saved in a suitable format in the local directory file.
Database & Control Card:
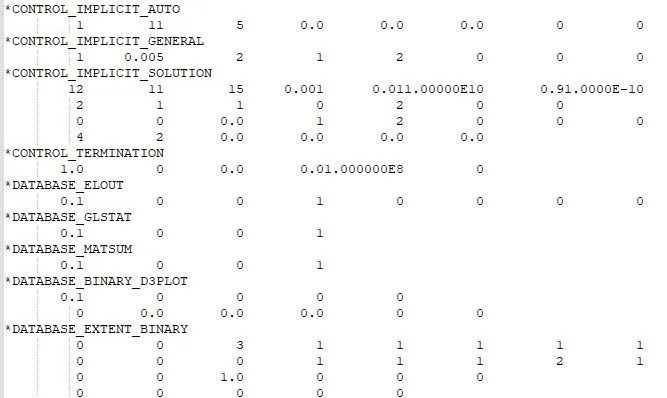
Database and control cards are assigned as it shown in the below.
The Time step for BINARY _D3PLOT and ASCII assigned 0.1ms
Database Extent Binary card to compute the elastic strain the model which is 1 for STRFLG
Since the specimen is using for tensile test here it is quasi-static
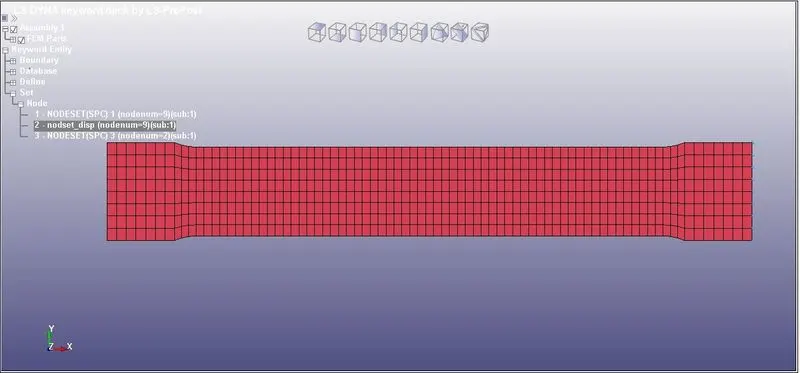
This is the meshed model of dog-bone for tensile test.
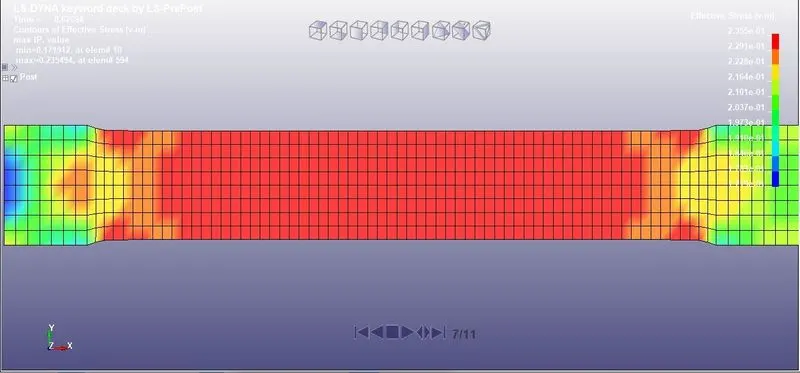
Maximum Stress we can observe from the above image as .0.259 at the element no 116.
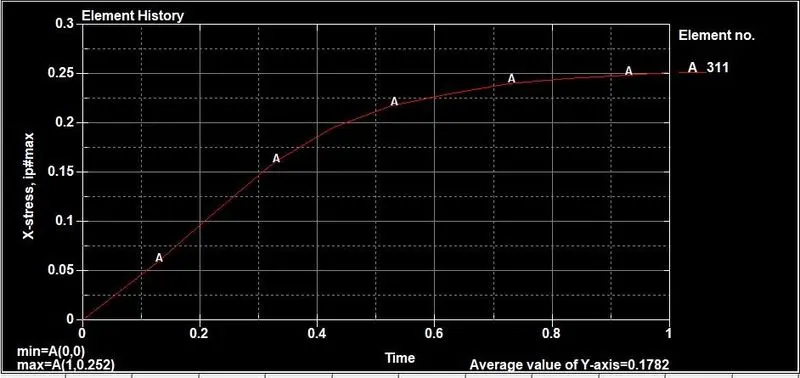
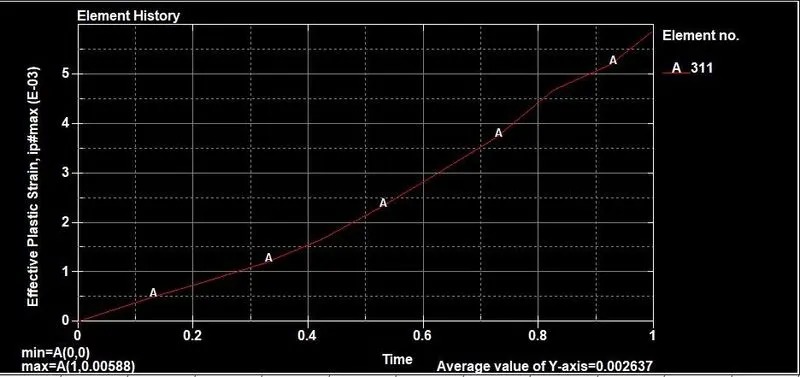
From the simulation data we can see the graph of effective plastic strain and effective stress
Conclusion
The True stress and strain values obtained from the Graphite Iron casting is found to be Similar to the simulated value
The main objective is to extract the material data to compare with the material model a MAT 024 Piecewise Linear Plasticity material card from the "given true stress/ strain raw data and use it to perform a uniaxial tension test of the given dog-bone specimen and also validate the post-processing stress-strain results with the given raw data .It was observed that the stress-strain curves obtained from the uniaxial test simulation almost behave in a similar fashion as of the given raw data for the challenge. However, the yield point slightly varies for the obtained simulated curves in comparison with the actual given raw data. This could have happened either due to improper modeling of material card parameters (such as “density, poisons ratio, etc.) or mesh still requires some refinement."