Week 9 Challenge (DHEV)
Q1) Sample current data (Pack_Current_test.mat) is provided for a battery test cycle. Input the current data to the battery model (can use “From Workspace” block) and examine the open circuit voltage and terminal voltage of the pack, SoC and the internal resistance. Export the variables to the workspace (can use “To Workspace” block) and plot the current, voltages, SoC and internal resistance as a function of time. Write in brief on the observed trend, whether it was expected or not.
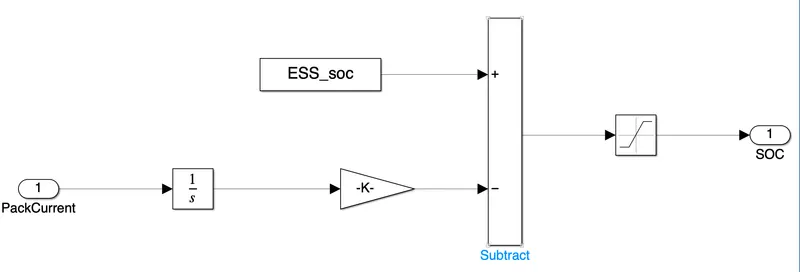
SOC Estimation Block :
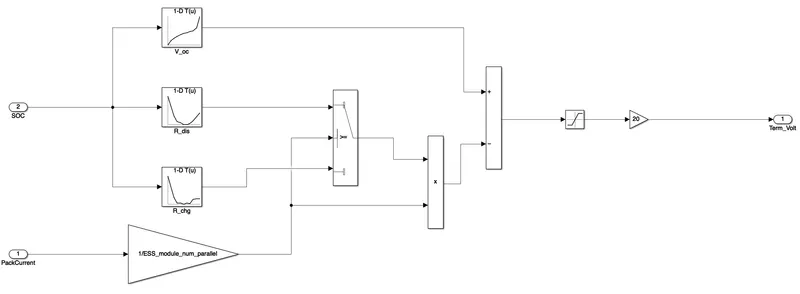
Terminal Voltage block :
Explantion :
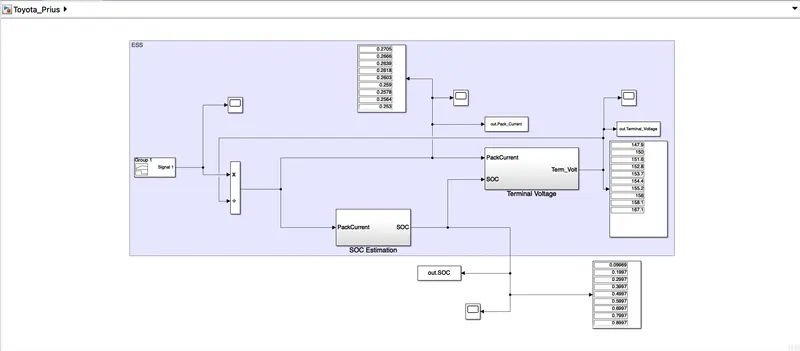
In this figure we could see the model for Battery Test using Toyota prius model as the data input from theADVISOR tool.
We have created a model for Battery test, using input values from Toyota prius so that we get output of Both SOC and Voltage.
We are using SOC Estimation for calculating SOC value and Terminal Voltage for Calculating Voltagevalue.
Inside SOC Estimation is shown in above block.
Inside Terminal Voltage is shown in above block.
Where as the input data is given by use of FROM WORKSPACE block and TO WORKSPACE block is used for getting the values and sending back the output Values to the workspace block.
Graphs :
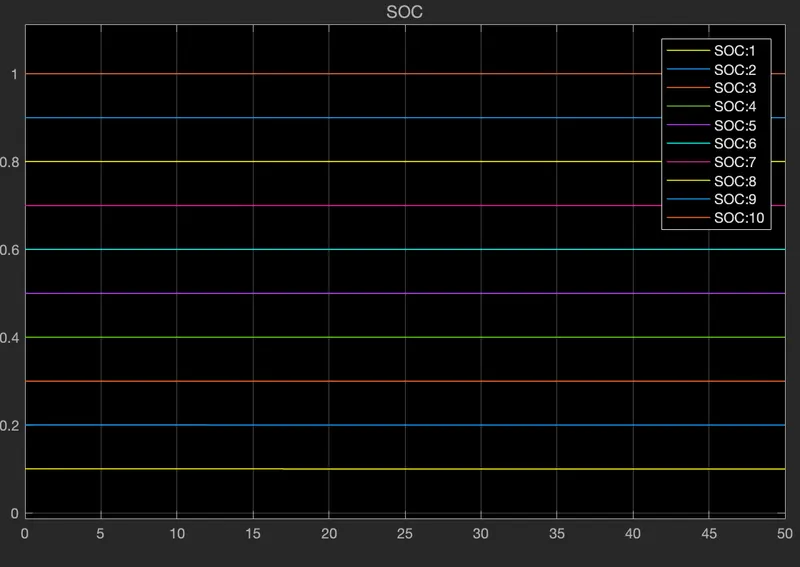
SOC Plot :
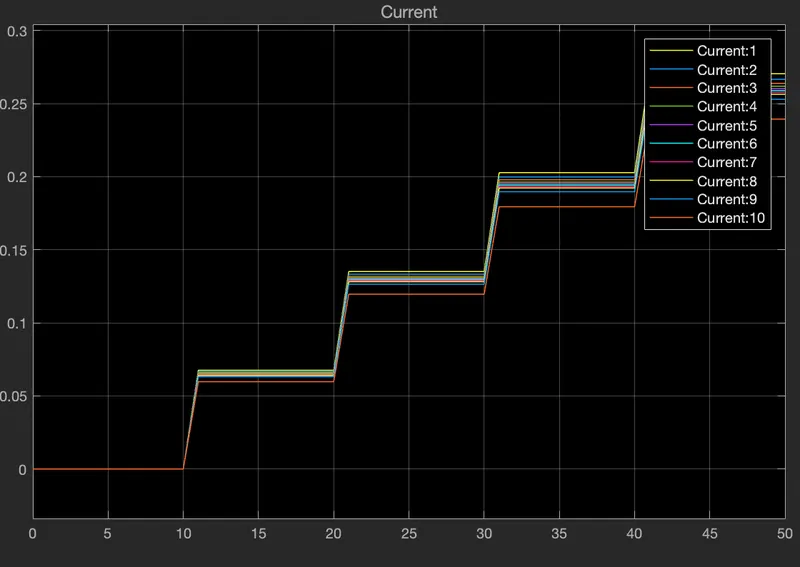
Current Plot :
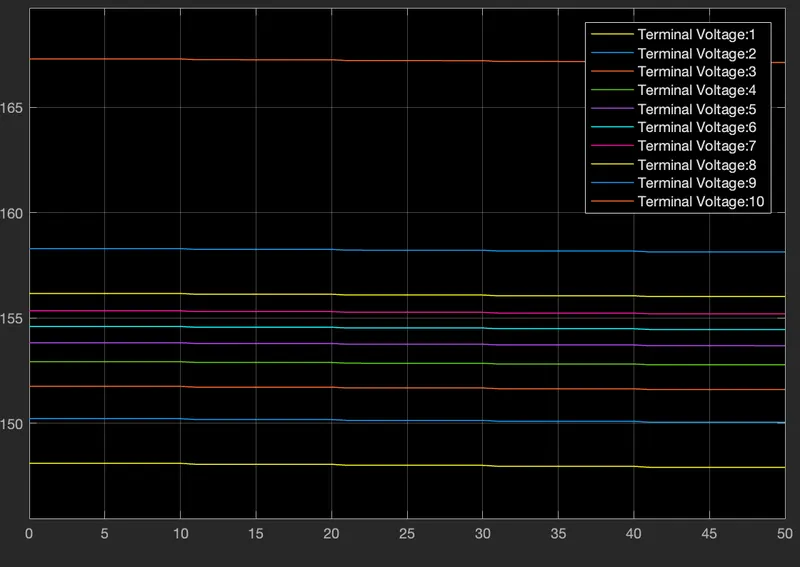
Voltage Plot :
SOC Values :
| No. of Inputs | Plotted Values | Time (sec) |
| 1 | 0.09969 | 0 to 50 |
| 2 | 0.1997 | 0 to 50 |
| 3 | 0.2997 | 0 to 50 |
| 4 | 0.3997 | 0 to 50 |
| 5 | 0.4997 | 0 to 50 |
| 6 | 0.5997 | 0 to 50 |
| 7 | 0.6997 | 0 to 50 |
| 8 | 0.7997 | 0 to 50 |
| 9 | 0.8997 | 0 to 50 |
Current Values :
| No. of Inputs | Plotted Values | Time (sec) |
| 1 | 0.2705 | 0 to 50 |
| 2 | 0.2666 | 0 to 50 |
| 3 | 0.2639 | 0 to 50 |
| 4 | 0.2618 | 0 to 50 |
| 5 | 0.2603 | 0 to 50 |
| 6 | 0.2590 | 0 to 50 |
| 7 | 0.2578 | 0 to 50 |
| 8 | 0.2564 | 0 to 50 |
| 9 | 0.2530 | 0 to 50 |
Voltage Values :
| No. of Inputs | Plotted Values | Time (sec) |
| 1 | 147.9 | 0 to 50 |
| 2 | 150 | 0 to 50 |
| 3 | 151.6 | 0 to 50 |
| 4 | 152.8 | 0 to 50 |
| 5 | 153.7 | 0 to 50 |
| 6 | 154.4 | 0 to 50 |
| 7 | 155.2 | 0 to 50 |
| 8 | 156 | 0 to 50 |
| 9 | 158.1 | 0 to 50 |
| 10 | 167.1 | 0 to 50 |
Q2) Calculate the average discharging and charging efficiency for the battery.

Note: Experiment with the solver type and time step and select the one that gives you reasonable results. Make a note of what was selected. Also, the Matlab plots should be labeled properly in terms of signal names and units, etc.
% Calculating Efficiency
V_oc = SOC;
V = Terminal_Voltage;
I = Pack_current;

% Formula
% Dis(I>0)= A = intergral (V*I/V_oc*I)
% chg(I<0)= B = intergral (V_oc*I/V*I)

% Calculation
a = V.*I;
b = V_oc.*I;
Al = sum (x(a,b));
Bl = sum (y(a,b));
% A = (I>0);
% B = (I<0);
%% Function
function [A] = x(a,b)
A = (a/b);
end
function [B] = y(a,b)
B = (b/a);
end